Final Report for MAB Young Scientist Award 2006
Distribution of seagrass and its ecological
importance of Jeju Island, Korea
SUNG MI LEE December 2007
Department of Earth and Marine Sciences Hanyang University Sangnok-gu, Ansan, Kyeonggi-do, South Korea
CONTENTS
CONTENTS ... 1
1. Introduction ... 2
2. Methods ... 3
2.1. Site ... 3 2.2. Seagrass distribution ... 32.3. Shoot density, biomass, morphological characteristics, leaf production, flowering shoot characteristics and strategy measurements ... 4
2.4. Physical parameters ... 4
2.5. Statistical analysis ... 5
3. Result ... 6
3.1. Distribution and physical parameters ... 6
3.2. Shoot density and biomass ... 8
3.3. Morphological characteristics ... 10
3.4. Leaf productivity ... 13
3.5. Morphological characteristics of flowering shoot (FS) and strategy ... 14
3.6. Soft corals distribution in JIBR ... 15
4. Discussions ... 16
1. Introduction
Seagrasses are a functional group of approximately 60 species of underwater marine flowering plants. Thousands of associated marine plant and animal species utilize seagrass habitat. Seagrasses provide habitat for fish and shellfish, and nursery areas to the larger ocean (Thayer et al., 1978; Canuel et al., 1997; Bianchi et al., 1999). They
perform important physical functions such as filtering coastal waters, dissipating wave energy and anchoring sediments. Seagrasses often occur in proximity to, and are ecologically linked with, coral reefs, mangroves, salt marshes, bivalve reefs and other marine habitats. Seagrasses are the primary food source of manatees, dugongs and green sea turtles, all of which are threatened, charismatic species of great public interest. Seagrasses are valuable yet overlooked habitats which provide important ecological and economic components of coastal ecosystems worldwide. Although there are extensive seagrass beds on all of the world's continents except Antarctica, seagrasses are in serious decline or have been totally destroyed in many locations (Green and Short,
World Atlas of Seagrasses, 2003).
The biogeographical distribution of one seagrass, Zostera, was reported as being
widely spread throughout all of Korea’s coastal area (Lee et al., Kor. J. Ecol., 2001).
Five species of Zostera were identified in the eastern, southern and western coast
regions (Z. asiatica, Z. caespitosa, Z. caulescens and Z. marina, Z. japonica), in
mixed-species meadows or mono-mixed-species strands. However, current knowledge of seagrass distribution around Jeju Island (JI) is very limited, as studies on seagrass and associated shallow coastal ecosystems are nearly absent.
The objective of this study is to evaluate the biogeographical distribution of the genus
Zostera in JI, as well as its ecological characteristics. And ecological characteristics of
the seagrass were examined for patterns related to the seasonal variability of environmental factors (i.e., temperature, light and sediments), for a better understanding of JI’s coastal ecosystems, including the Jeju Island Biosphere Reserve (JIBR).
2.
Methods
2.1. Site
Jeju Island is situated in the southern part of the Korean Peninsula and covers a lava plateau with a shield volcano at an elevation of 1,950 meters above sea level. The JIBR was designated as a UNESCO’s Biosphere Reserve in December 2002. It covers Mt. Halla National Park (1,950 m), a mid-mountain zone between 200 and 600 m elevation (excluding the city planning area), the Seoguipo City Marine Park (including the three islets of Beom-seom, Mun-seom and Seop-sem), and the two streams, Hyodon-cheon and Young-cheon. Its total area is 83,094 ha. The study included the marine area of the JIBR and neighboring coastal areas (Fig.1).
Fig.1. Map showing Jeju Island and Jeju Biosphere Reserve, Korea .
2.2. Seagrass distribution
The boundaries of seagrasses and soft coral meadows were mapped from a boat driven slowly around the perimeter of each seagrass and soft coral bed, with single GPS position fixes recorded every 4 seconds. SCUBA diving allowed to identify distribution of the seagrass and soft coral with underwater sampling equipment, including an underwater camera and optical instruments.
2.3. Shoot density, biomass, morphological characteristics, leaf production, flowering shoot characteristics and strategy measurements
Measurements of shoot morphometrics, biomass and density were monitored monthly. Shoot density was estimated within a PVC framed permanent quadrate (0.25 x 2 m) by counting the number of the shoots. Above ground biomass was estimated by multiplying the mean number of shoots (density) by the monthly mean individual shoot weight.
Morphometric samples of 10 – 20 grown-up vegetative shoots (VS) with undamaged leaves, without rhizome or roots, were taken from randomly distributed patches. For morphometric changes of prepared samples, the number of leaves per shoot, shoot height, sheath length, rhizome length, sheath width, rhizome width and individual shoot part weight (DW) were determined.
Leaf production productivities were measured using the leaf marking technique (Zieman 1974). About 10 randomly chosen seagrass shoots were punched the bundle sheath and then collected after 4weeks. Separated leaf materials into leaf tissues produced before and after punching were measured for lengths and widths and then dried at 60℃ to a constant weight (Lee et al. 2004).
The sample of flowering shoot (FS) was taken 10 – 20 grown-up shoots. For change of FS characters of prepared samples, the number of branch per FS, FS height, the number of spadix per FS, the number of seed per FS and individual FS weight (DW)
will be determined. The life reproductive cycle of Z. marina was described using three
phenological stages visually identifiable and modified from Meling-López and Ibarra-Obando (1999): RS1, male and female flower development; RS2, fruit development, and RS3, seed ripeness. For stages 1 and 3, only their occurrences were noted, while the remaining stages were presented as percentages.
2.4. Physical parameters
Water temperature (± 0.1°C) will be measured at the subtidal seagrass canopy level for each sampling site using electronic probes (YSI, M-33). Underwater photon flux density were measured using Hobo data logger (TBI32-05+37, Onset Computer Corp.)
encased in a waterproof underwater housing. Daily photne flux density (mol m-2 d-1)
Surface sediments were obtained from the top 10 cm layer at each site using a cylindrical PVC corer (i.d. 10 cm). Collected samples then were oven-dried and later
burned at 500℃ for 4 h to determine organic matter. Sediment grain size was
determined by dry sieving as outlined by Shepard (1954), and sand fractions (particle
size greater than 4Φ) were separated from mud fractions (silt + clay; particle size ≤
4Φ).
2.5. Statistical analysis
The coefficient of variation (CV) of the different parameters was determined to assess the seasonal variability. Statistical analyses were performed using SPSS Windows Software (Version 10.0, SPSS Inc., Chicago, IL, USA, 1997). Differences in shoot density, biomass, plant morphological characteristics, leaf productivity and morphological characteristics of FS were tested between sampling times and species for significance. Data are tested for normality and homogeneity of the variance to meet the assumptions for parametric statistics. Cross correlation analysis using the Pearson coefficients was performed for the relationships among shoot density, biomass, plant morphological characteristics, leaf productivity, morphological characteristics of FS and environmental factors, and also were used to examine the similarity of seasonal patterns across species.
3. Result
3.1. Distribution and physical parameters
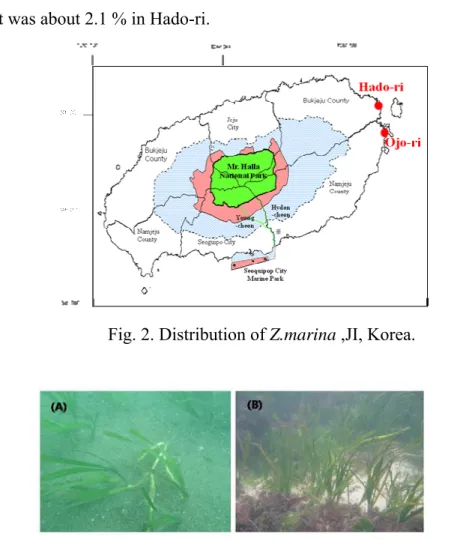
In the surveyed area of JI, Z. marina distributed in Ojo-ri and Hado-ri(Fig. 2 and Fig.
3). Z. marina populations were found in mostly stable subtidal habitats. After
preliminary distribution research, surveys were conducted regularly in Hado-ri.
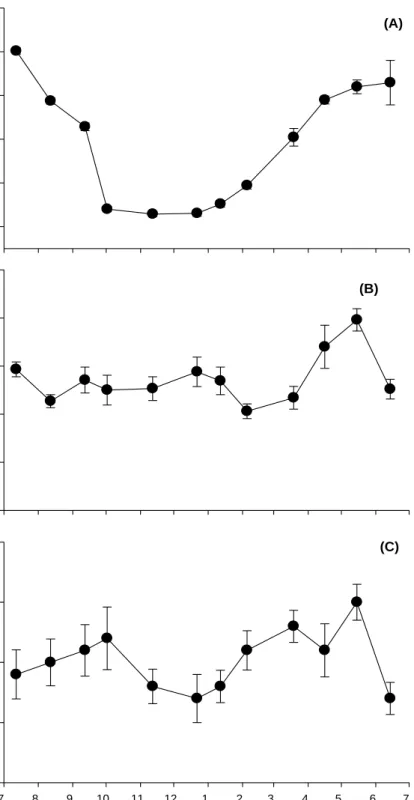
Water temperature at JI showed a strong seasonal trend ranging from 13.4 °C in February to 27.2 °C in September (Fig. 4(A)). And underwater photon flux density was also seasonal trend. Monthly average photon flux density ranged from 14.5 mol photons m-2 d-1 in February to 65.3 mol photons m-2 d-1 in August (Fig. 4(B)).
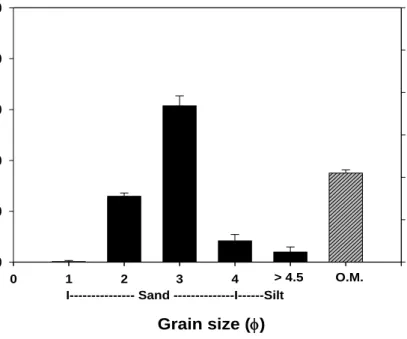
The sediment from the study site was composed primarily of sandy sand, which was characterized as having a sand composition of 87.6 % and a silt and clay composition of 12.4 % of the sediment in terms of dry weight (Fig. 5). The average organic matter in sediment was about 2.1 % in Hado-ri.
Fig. 2. Distribution of Z.marina ,JI, Korea.
W a te r t e m p er a tu re( oC) 0 5 10 15 20 25 30 2006 Month 2007 7 8 9 10 11 12 1 2 3 4 5 6 7 P hot on f lu x de nsi ty (m o l ph ot o n s m -2 d -1 ) 0 10 20 30 40 50 60 70 80
Fig. 4. Seasonal variation of water temperature and photon flux density in Hado-ri, JI, Korea. Gr a in s iz e ( % ) 0 20 40 60 80 100 O rgar n ic m a tt er cont ent ( % ) Grain size (φ) 0 1 2 3 4 5 6 7 0 1 2 3 4 5 6 > 4.5 O.M. I--- Sand ---I---Silt
3.2. Shoot density and biomass
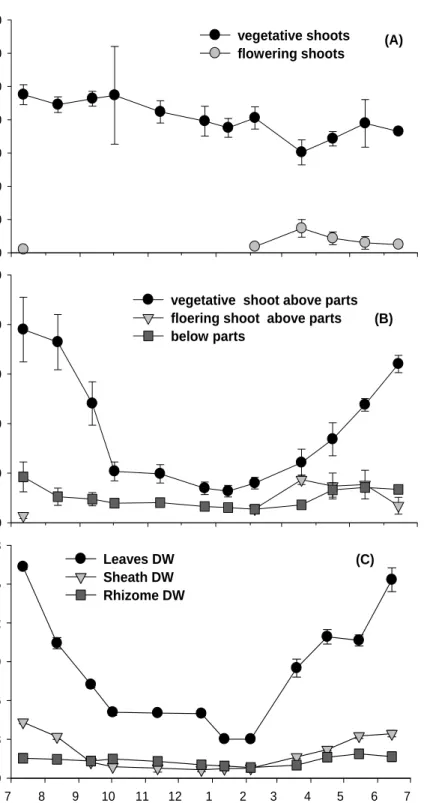
Shoot density revealed obvious temporal variation, increasing in spring and summer, and decreasing in winter (Fig. 6(A)). In July, VS shoot density showed the highest value
(475.5 ± 30.0 shoots m-2), whereas the lowest value was observed in March (302.0 ±
27.0 shoots m-2). RS occurred between February and July, and the proportion of
reproductive shoots ranged from 2.0 to 19.6 %, with a maximum in March.
The biomass of Z. marima in the study area showed significant temporal variation,
decreasing in winter and increasing in summer (Fig. 6(B), P < 0.001). The biomass of
VS above parts was estimated the highest in July (389.8 ± 65.1 g DW m-2) and the
lowest in January (63.7 ± 11.6 g DW m-2). The biomass of RS above parts was
estimated the highest in July (86.8 ± 9.4 g DW m-2) and the lowest in January (14.0 ±
5.4 g DW m-2). Below parts biomass showed the highest in July and the lowest in
February (Fig. 6(B)). Biomass of individual plant parts was significantly different (p < 0.001), ranging from 0.46 g in February to 2.22 g in July (Fig. 6(C)). The dry weight of the leaves showed temporal variation, increasing in spring and summer, and decreasing in fall and winter (Fig. 6(C))
Sh oot d e nsi ty (shoot s m -2 ) 0 100 200 300 400 500 600 700 vegetative shoots flowering shoots B iom ass (g D W m -2 ) 0 100 200 300 400 500
vegetative shoot above parts floering shoot above parts below parts (A) (B) 2006 Month 2007 7 8 9 10 11 12 1 2 3 4 5 6 7 D ry w e ig h t (g ) 0.0 0.3 0.6 0.9 1.2 1.5 1.8 Leaves DW Sheath DW Rhizome DW (C)
Fig. 6. Shoot density and biomass in Hado-ri, JI, Korea. (A) : shoot density, (B) : biomass and (C) : Individual dry weight (DW).
3.3. Morphological characteristics
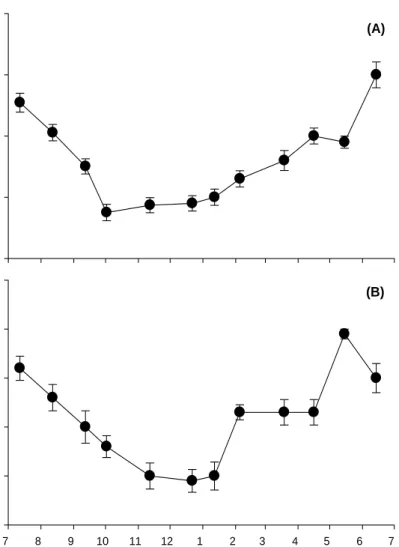
Shoot length and rhizome internode length showed significant temporal variation (Fig. 7(A) and (B), P < 0.01). And the number of leaves per shoot fluctuated with sampling time (Fig. 7(C)). Shoot length in the study site was the longest in July (120. 3 ± 1.4 cm) and the shortest in December (46.1 ± 1.3 cm), whereas rhizome internode length was short in February (10.3 ± 0.7 mm) and long in May (19.8 ± 1.2 mm). Average number of leaves per shoot ranged from 5.2 leaves in December to 6.0 leaves in May (Fig. 7(C)).
Leaf width and rhizome diameter showed significant temporal variation (Fig. 8, P < 0.01). Leaf width increased in spring and summer and decreased in fall and winter, and also rhizome diameter showed similar temporal trends (Fig. 8(A)). The leaf width was estimated the widest in June (9.0 ± 0.2 mm) and the narrowset in October (6.8 ± 0.1 mm). The rhizome diameter was estimated the widest est in May (4.9 ± 0.1 mm) and the narrowest in October (3.4 ± 0.1 mm).
S h o o t L e ng th (c m ) 40 60 80 100 120 140 R h iz ome Le ngt h( cm ) 0 5 10 15 20 25 2006 Month 2007 7 8 9 10 11 12 1 2 3 4 5 6 7 Leaf Num b er 4.5 5.0 5.5 6.0 6.5 (A) (B) (C)
Fig. 7. Morphological characteristics of Z. marina in Hado-ri, JI, Korea. (A) : shoot length,
Leaf W idt h( mm ) 6 7 8 9 10 2006 Month 2007 7 8 9 10 11 12 1 2 3 4 5 6 7 R h iz o m e W idt h( m m ) 3.0 3.5 4.0 4.5 5.0 5.5 (A) (B)
Fig. 8. Morphological characteristics of Z. marina in Hado-ri, JI, Korea. (A) : leaf width and
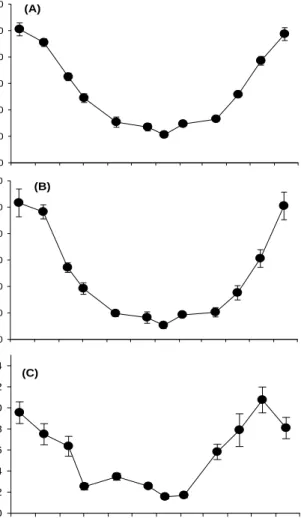
3.4. Leaf productivity
The leaf productivity of Z. marina produced well-developed shoots throughout the
year and showed significant differences through time (p < 0.001). Z. marina leaf
productivity exhibited similar seasonal trend to that of leaf growth (Fig. 9). Leaf growth was the highest during July (50.5 ± 1.0 mm shoot-1 d-1) and the lowest in January (10.5 ± 1.0 mm shoot-1 d-1). Leaf productivity was the highest during July (103.2 ± 10.5 mg DW shoot-1 d-1) and the lowest in January (11.5 ± 2.3 mg DW shoot-1 d-1). LAI showed significant temporal variation (Fig. 9(C), P < 0.01). In the estimated of LAI, the lowest value was exhibited in January with a value of 1.5 m2 m-2 and the highest value was displayed in May, with a value of 10.7 m2 m-2.
L e a f gr ow th ( m m s hoot -1 d -1) 0 10 20 30 40 50 60 Le a f pr oduc ti v it y ( m g DW s hoot -1 d -1) 0 20 40 60 80 100 120 (A) (B) 7 8 9 10 11 12 1 2 3 4 5 6 7 LA I ( m 2 m -2) 0 2 4 6 8 10 12 14 2006 Month 2007 (C)
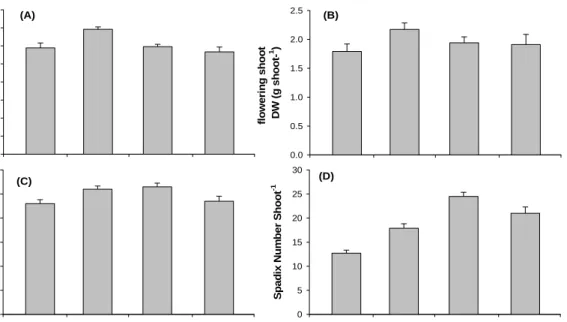
3.5. Morphological characteristics of flowering shoot (FS) and strategy
The formation of FS started in February and continued until late June, with most FS being formed between mid-April and mid-May (Fig. 10). FS existed 90 days on average from the stage of visible spathes to deterioration of the shoot. FS disappearance started during highest water temperature. FS length and dry weight showed the highest peak in April (138.3 ± 2.7 cm, 2.2 ± 0.1 g DW shoot-1) and the lowest value in June (113.3 ± 5.4
cm, 1.8 ± 0.1 g DW shoot-1). Also, the number of branch per FS and of spadix per FS
were the highest value in May (5.3 ± 0.2 branches, 24.5 ± 0.9 spadix) and the lowest value in July (4.6 ± 0.2 branches, 12.7 ± 0.7 spadix). Reproductive phase of RS1 was the highest in March (100 %) and the lowest in June (7.3 %), whereas Reproductive phase of RS3 was the highest in June (56.6 %, Table 1).
fl ow e ri n g s h o o t Leng th (c m ) 0 20 40 60 80 100 120 140 160 fl ow e ri n g shoo t D W ( g s h oot -1 ) 0.0 0.5 1.0 1.5 2.0 2.5 Month 3 4 5 6 7 Br ench Nu m b er 0 1 2 3 4 5 6 Month 3 4 5 6 7 S p ad ix N u m b er S h o o t -1 0 5 10 15 20 25 30 (A) (B) (C) (D)
Fig. 8. Morphological characteristics of FSchanges in Hado-ri, JI, Korea. (A) : FS height, (B) : FS dry weight, (C) : branch number and (D) : number of spadix per FS
Table 1. Percentage of Reproductive phases in Hado-ri, JI, based on spathe development: RS1, male and female flower development; RS2, fruit development; RS3, seed ripeness (n=19~275).
Date RS 1 (%) RS 2 (%) RS 3 (%) 2005 12 Mar. 91.2 8.8 -16 Apr. 17.6 82.4 -15 May. 10.5 66.0 23.5 14 Jun. 7.3 36.1 56.6
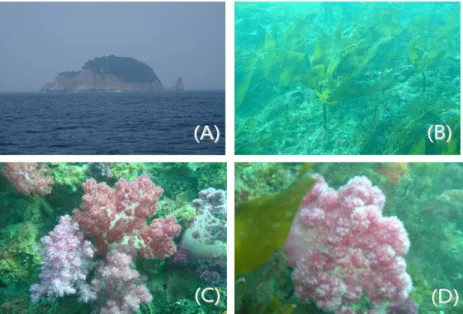
3.6. Soft corals distribution in JIBR
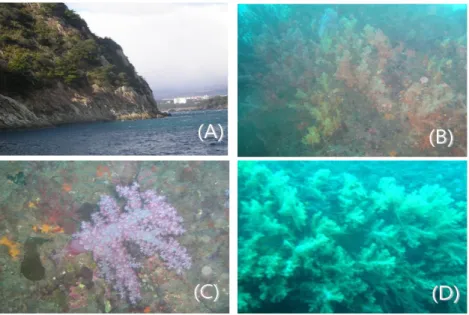
Soft corals Dendronepthya putteri, D. palaoensis, D. palaoensis and Scleronephthya
gracillimum were identified from the surveyed sites (Fig. 11 and Fig. 12). Most of the
Dendronepthya sp. was distributed at 3~6m in water depth while S. gracillimum was
occurred at 6~9m in water depth. In Mun-Seom islet bed, there are 4 soft coral and 4 algal species. And in Seop-seom islet bed, there are 5 soft coral and 7 algal species. Yet, importantly seagrass was not found in these islet beds.
Fig. 12. Photographs of dominated soft-corals in Seop-seom islet bed, JI, Korea. (A): Seop-sem Islet, (B): S. gracillimum, (C): D. putteri, (D): D. palaoensis .
4. Discussions
In temperate regions, the strong seasonality of seagrass has been demonstrated to respond, in the form of plant growth, to seasonal variations in light and temperature
(Phillips et al., 1983; Olesen and Sand-Jensen, 1994; Laugier et al., 1999). Temporal
changes in the shoot size of seagrasses are attributed to changes in various factors, such as underwater irradiance (Koch & Beer 1996; Vermaat & Verhagen 1996; Moore et al.
1997) and water temperature (Phillips et al. 1983; Orth & Moore 1986; Meling-Lopez
& Ibarra-Obando 1999; Lee et al. 2005). In temperate regions, seagrass production,
biomass, and shoot size usually increase with increasing water temperature and light availability in spring and summer and decrease again in fall and winter (Phillips et al.
1983; Orth & Moore 1986; Vermaat & Verhagen 1996). In this study, Z. marina
populations in Hodo-ri were located in the more stable subtidal habitat. Also, water temperature as well as underwater photon flux density in the study site were more stable and higher than other habitat in Korea (Lee et al. 2004, Lee et al. 2006). Z. marina at
Hodo-ri, there were clear temporal trends in plant morphology, density, biomass, and
production. Z. marina began to grow in January and reached its maximum biomass in
July and sexual reproduction in February to July. Biomass was correlated with water
temperature and irradiance (r2 = 0.56, P = 0.02). And Z. marina at Hodo-ri showed
higher values in density, biomass, and production than other habitat in Korea (Lee et al.
2004, Lee et al. 2006).
Since seagrass communities contribute significantly to the primary production of coastal and estuarine ecosystems, production dynamics of seagrasses has been a main subject of the seagrass researches (McRoy and McMillan 1997; Zieman and Wetzel 1980; Dunton 1990). Seagrass primary productivities are regulated by underwater irradiance, water column and sediment (Lee and Dunton 2000). Thus, variations in these factors are reflected in survival, distribution and temporal or special production variations of seagrass. In the present study, productivities of Z. marina exhibited distinct
seasonal trend, increasing during early spring and decreasing during summer period. The seagrass growth trend in this study also was identical to seasonal patterns. Leaf growth and productivity was the highest in July and the lowest in January.
FS of Z. marina in Hodo-ri appeared in February and disappeared in July, similar to
the results of other studies, FS of Z. marina (Lee et al 2006). But, FS period of Z.
marina was longer than that of Lee et al. (2006). The FS period probably was
influenced by water (Phillips et a.l, 1983). Potential seed production (193.6 m−2) within
the Z. marina population in JI was slightly lower than other habitat in Korea (Lee et al.
2006).
5. Conclusions
The temporal dynamics of Z. marina were monitored in the JIBR on the southern
coast of Korea. Plant morphological characteristics, shoot density, biomass, productivity morphological characteristics of FS and reproductive strategy were monitored from July
2006 to June 2007. Z. marina occurred in the subtidal zone from 0.5 to 2.5 m below the
marina in the JIBR showed seasonal variation in the biomass and shoot density.
Morphological characteristics also showed seasonal variation. And ecological characteristics of the seagrass are related to the seasonal variability of water temperature and light. In the islets of Mun-Seom and Seop-Seom, there are total of 4 coral and 4 algal species.
This study provided the data to establish seagrass distribution and to understand the interactions between seagrass and environmental factors. Seagrass associated flora and fauna are the main component of marine biodiversity of the JI. The study will contribute to the understanding of shallow water seagrass bed ecosystems of the region, which has been largely neglected until now. The information obtained from this study will further provide a scientific base for long-term monitoring, management practices and sustainable development of the JI, as well as the neighboring coastal zone of the JIBR.
6. References
Bianchi T.S., Argyrou M. and Chippett H.F. 1999. Contribution of vascular-plant carbon to surface sediments across the coastal margin of Cyprus (eastern Mediterranean). Org. Geochem., 6: 502-507.
Canuel E.A., Freeman K.H. and Wakeham S.G. 1997. Isotopic composition of lipid biomarker compounds in estuarine plants and surface sediments. Limnol. Oceanog., 42: 1570-1583.
Dunton K. H. 1990. Production ecology of Ruppia maritime L.S.I. and Halodule
wrightii Aschers. in two subtropical estuaries. J. Exp. Mar. Biol. Ecol., 143:
147-164.
Green E.P. and Short F.T. 2003. World Atlas of Seagrasses. University of California Press, Berkeley.
Koch E.W. and Beer S. 1996. Tides, light and the distribution of Zostera marina in
Laugier T., Rigollet V. and Casabianca M.L. 1999. Seasonal dynamics in mixed
eelgrass beds, Zostera marina L. and Z. noltii Hornem., in a Mediterranean
coastal lagoon (Thau lagoon, France). Aquat. Bot., 63: 51–69.
Lee K.S. and Dunton K. H. 2000. Effects of nitrogen enrichment on biomass allocation,
growth, and leaf morphology of seagrass Thalassia testudinum. Mar. Ecol. Prog.
Ser., 196: 39-48.
Lee K.S., Park J.I., Chung I.K., Kang D.W. and Huh S. H. 2004. Production ecology of
the seagrass Zostera marina in Jin Dong Bay, Korea. Algae, 19 (1): 39-47
Lee K.S., Park S.R. and Kim J.B. 2005 Production dynamics of the eelgrass, Zostera
marina in two bay systems on the south coast of the Korean Peninsula. Mar.
Biol., 1473: 1091– 1108.
Lee S.Y., Kim T.J., Heo S. and Choi C.I. 2001. Study on the ecological and taxonomical characteristics of Zostera (Zosteraceae) in Korea. Kor. J. Ecol., 23: 149-156.
Lee S.Y., Lee S.M. and Kim J.B. 2006. Temporal dynamics of subtidal Zostera marina
and intertidal Zostera japonica on the southern coast of Korea. Mar. Ecol.. 27
(2): 99-186
McRoy C.P. and McMillan C. 1997. Production ecology and physiology of seagrass. In: McRoy C.P. and Helfferich C. (eds), Seagrass ecosystems: a scientific persective. Dekker, New Yok, pp. 53-81.
Meling-Lopez A.E. and Ibarra-Obando S.E. 1999. Annual life cycles of two Zostera
marina L. populations in the Gulf of California: contrasts in seasonality and
reproductive effort. Aquat. Bot., 65: 55-69.
Moore K.A., Wetzel R.L. and Orth R.J. 1997. Seasonal pulses of turbidity and their
relations to eelgrass (Zostera marina L.) survival in an estuary. J. Exp. Mar.
Biol. Ecol., 215: 115–134
Olesen B. 1999. Reproduction in Danish eelgrass (Zostera marina L.) stands:
size-dependence and biomass partitioning. Aquat. Bot., 65: 209–219.
Olesen B. and Sand-Jensen K. 1994. Biomass–density patterns in the temperate seagrass
Orth R.J. and Moore K.A. 1986. Seasonal and year-to-year variations in growth of
Zostera marina L. (eelgrass) in the lower Chesapeake Bay. Aquat. Bot., 24:
335–341.
Phillips R.C., McMillan C. and Bridges K.W. 1983. Phenology of eelgrass, Zostera
marina, L., along latitudinal gradients in North America. Aquat. Bot., 15: 145–
156.
Shepard F.P. 1954. Nomenclature based on sand-silt-clay ratios. J. Sedimentol. Petrol., 24: 151–158.
Thayer B.P., Parker P.L., LaCroix M.W. and Fry B. 1978. The stable carbon isotope ratio of some components of an eelgrass, Zostera marina. Oecologia., 35: 1-12.
Vermaat J.E. and Verhagen F.C.A. 1996. Seasonal variation in the intertidal seagrass
Zostera noltii Hornem.: coupling demographic and physiological patterns.
Aquat. Bot., 52: 259–281.
Zieman J.C. 1974. Methods for the study of the growth and production of turtle grass, Konig. Aquaculture, 4: 139-143.
Zieman J.C. and Wetzel R.G. 1980. Productivity in seagrasses: methods and rates. In: Phillips R.C. and McRoy C.P. (eds), Handbook of seagrass biology: an ecosystem perspective. Garland STPM Press. New York. pp. 87-116.