From Image to Personalized Cardiac Simulation:
Encoding Anatomical Structures into a
Model-Based Segmentation Framework
Hannes Nickisch1, Hans Barschdorf1, Frank M. Weber1, Martin W. Krueger2,Olaf D¨ossel2, and J¨urgen Weese1 1 Philips Research Hamburg, Germany
2 Institute of Biomedical Engineering, Karlsruhe Institute of Technology (KIT), Karlsruhe, Germany
Abstract. Whole organ scale patient specific biophysical simulations contribute to the understanding, diagnosis and treatment of complex diseases such as cardiac arrhythmia. However, many individual steps are required to bridge the gap from an anatomical scan to a personal-ized biophysical model. In biophysical modeling, differential equations are solved on spatial domains represented by volumetric meshes of high resolution and in model-based segmentation, surface or volume meshes represent the patient’s geometry. We simplify the personalization pro-cess by representing the simulation mesh and additional relevant struc-tures relative to the segmentation mesh. Using a surface correspondence preserving model-based segmentation algorithm, we facilitate the inte-gration of anatomical information into biophysical models avoiding a complex processing pipeline. In a simulation study, we observe surface correspondence of up to 1.6 mm accuracy for the four heart chambers. We compare isotropic and anisotropic atrial excitation propagation in a personalized simulation.
Keywords: model-based segmentation, electrophysiological structures, biophysical modeling and simulation
1
Introduction
Personalized simulations of the heart [18] require – in addition to patient anatomy – structures such as the fast conduction tracts or muscle fibre directions hardly visible in clinical images but key for excitation propagation. Given the pa-tient’s heart anatomy, this information may be reconstructed by rule-based ap-proaches [19,9] or by mapping a specific atlas to the patient [12]. Model-based segmentation (MBS) [5,21] allows to directly link this information to the generic model subsequently personalized by adaptation to an image. Good surface cor-respondence after the adaptation process (as suggested by [8]) is a prerequisite. We propose a generic interface for MBS, in which meshes carry additional information such as fast conduction tracts or muscle fibre directions. Anatom-ical personalization is achieved by representing relevant structures relative to
1 2
1 2
Underlying Anatomy Real Location Segmented CT Scan Real Location Invisible Average Anatomy
Average Location
Mean Mesh Encoded Structure
2
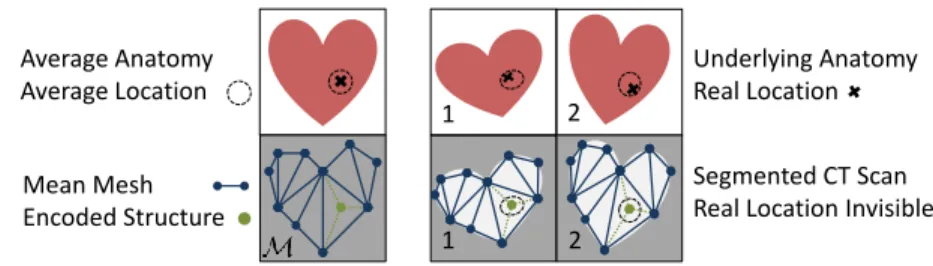
Fig. 1. Interface for structure encoding. Left: Functional structures (green) are en-coded by linear combinations (thin dotted lines) of vertices of the segmentation mesh (blue) elements such as triangles or tetrahedra.Right: The mesh can be adapted to patient anatomies and the encoded structures transform accordingly.
the (partly volumetric) segmentation mesh prior to adaptation, see Fig. 1 (bot-tom left). During the adaptation of the segmentation mesh to image data, the structures are deformed in the same way as the mesh, see Fig. 1 (bottom right). The positions of the structures in an average anatomy can be obtained from his-tological studies or specialized measurements beforehand. For fast conduction tracts, this information is qualitative rather than quantitative [13] and cannot be obtained from CT scans. Relative encoding or atlas-based approaches do not capture variations across patients per se; these have to be modeled on top.
We investigate for the MBS approach presented in [5], to what extent vertex positions of the generic model are mapped to corresponding positions. Because a dense set of thousands of manual landmarks as ground truth can hardly be defined with sufficient accuracy, we perform MBS of a patient’s dataset using the heart shape derived from other individuals as starting point. As metric, we compare the distance of corresponding vertices along the mesh surface. We map muscle fibre directions and fast conduction tracts to the right atrium and simulate atrial excitation propagation on a patient-specific mesh.
Previous approaches use a pipeline of segmentation, marching cubes meshing, mesh decimation and atlas registration [16] or surface correspondence matching, subsampling and thin plate spline warping [7,11]. We avoid these steps.
2
Encoding of Simulation Structures
Since the resolution of segmentation meshes is optimized for segmentation and not for biophysical simulations, we cannot simply attach structures to mesh ver-tices. In order to decouple mesh resolution from simulation structure positions, we use local coordinates (relative to the segmentation mesh)α∈Rd+instead of global coordinates. A segmentation meshMis composed of a set of verticesVM
and a set of elements EM. Every element e∈ EM is a convex combination of a
small set of vertices{v1, ..,vd} ⊂ VM. Triangles and tetrahedra are very common
mesh elements. As the elementseare convex sets of points, we can represent any of their interior pointsx∈e⊂R3 in terms of local coordinatesx=Pdi=1αivi
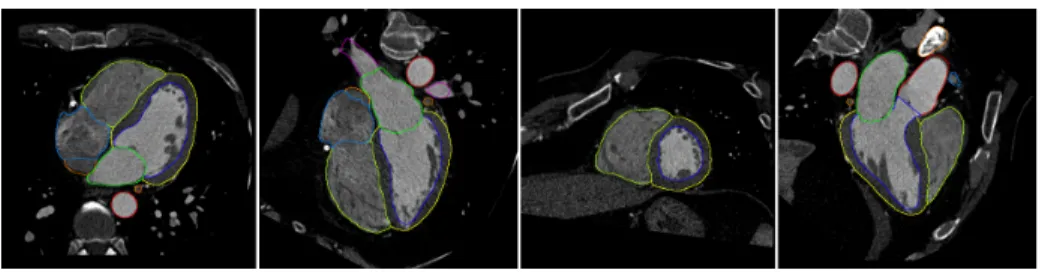
Fig. 2.Four views on one out of the 37 segmented CT data sets.
whereαi≥0 and 1 =P d
i=1αi. For a pointxoutside the meshMwe have two
options: On the one hand, its projectionz=PM(x) = arg minz∈e∈EMkx−zk
can be used (discarding small numerical deviations). On the other hand, we can explicitly encode finite wall thickness in (or height above) a triangulated surface by the scaled normal ˜n=n/pknk,n= (v2−v1)×(v3−v1) using the relation
x=P3
i=1αivi+α4·n˜. The factor p
knk(unlikeknk) rescales the wall thickness linearly and not quadratically as the normalnwould.
We represent directions (and not positions) of muscle fibersf ∈R3as vectors
starting ate’s center byf =Pd
i=1(αi−d1)vi.
3
Analysis of Surface Correspondence
In the following, we empirically assess the surface correspondence achieved by the segmentation algorithm [5] after different shape initialisations. First, we describe our evaluation approach (3.1), next, we discuss the distance measures used (3.2) and then, we present results on a dataset of 37 CT scans (example shown in Fig. 2) acquired by a Philips iCT scanner (3.3 and 3.4). Finally, we describe a simulation of excitation propagation in the human atria (3.5).
3.1 Approach
An assessment of the surface correspondence by a densely sampled set of ground truth landmark points is practically impossible. Therefore, we follow an indirect approach where we look at the positional error of the segmentation algorithm itself instead of the anatomical variation in a group of patients.
The segmentation algorithm [5] applies a sequence of parametric, multi-affine and deformable adaptation steps to an average initial shape balancing attraction by the initial shape and the image features. The final nonrigid adaptation of the mesh (as done in [5]) is driven by two energies: an internal energy provides the mesh with stiffness along the surface and keeps the vertex distribution similar to the mean mesh (surface curvature is not penalised) and an external energy pulls the mesh along its normals towards edges with features similar to the ones in the training set. There is no explicit mechanism to enforce surface correspondence
Mean Mesh
Adapted Meshes
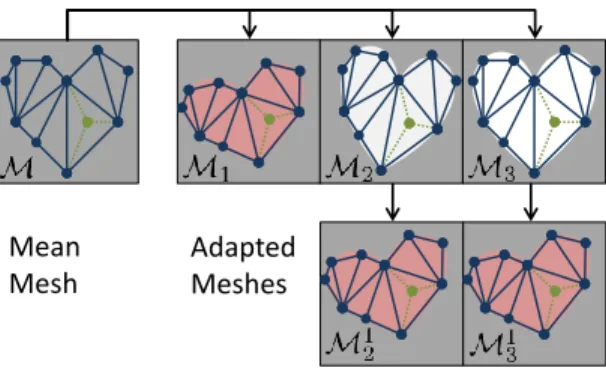
Fig. 3.Surface correspondence is validated by adapting a mean meshMto different anatomies and using the resulting meshesMjas mean meshes for a second adaptation step whose outputs are compared to each other.
but correspondence is implicitly preserved because the external energy acts along the surface only.
We vary the intial shape model and analyze the surface correspondence of the resulting segmentations. The initial shapes cover the possible anatomical variations in a group of patients, hence, we obtain a faithful measure of surface correspondence that can be evaluated for every vertex of the segmentation mesh. The shape variations in a group of patients tend to be overestimated by this approach because the difference between initial shape and adapted mesh is bigger than the difference between mean shape and adapted mesh on average.
We have a set of anatomical imagesI1, .., IN (see Fig. 3), a mean meshM
and a segmentation algorithmS : (M, Ii)7→ Mi using the mean mesh as a soft
geometrical constraint [5] and returning an adapted meshMi. Then we use the
adapted meshMj as new mean mesh, computeM j
k ←S(Mj, Ik) and compare
the vertex distances between the meshesMkandM j
kadapted to the same image
Ik. Small distances along the surface and simultaneously a high segmentation
quality indicate good surface correspondence across different imagesI.
3.2 Distance Measures
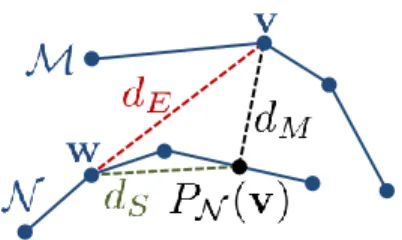
There are several distance measures between topologically identical meshes M and N with corresponding vertices v ∈ M, w ∈ N, see Fig. 4. Segmentation quality is assessed by the mesh-to-mesh distancedM focusing on the differences
between the surfaces. Absolute deviations between corresponding vertices are quantified by the Euclidean distance dE. Our validation experiments use dS to
measure the shiftalong the surface defined by the mesh.
3.3 Analysis of the Results
We composed a dataset ofN = 37 CT scans acquired at the same heart phase (diastasis/reduced filling) yielding very good segmentation quality, see Fig. 2.
Fig. 4. Distance measures between corresponding vertices v and w of topologically identical meshesMand N: Euclidean distancedE, mesh-to-mesh distancedM (after projection) and surface distancedS.
“Very good” means that we require a mesh-to-mesh distance dM between
seg-mentations with different initial shapes below 5 mm for 99% of the vertices. We obtained an average mesh-to-mesh distance of 0.6 mm. Allj= 1..37 scans were segmented and we used the resultsMj as initial shapes for the final
segmenta-tion of other datasets as explained in secsegmenta-tion 3.1 yieldingMjk. As a next step, we computed surface distancesdS betweenM
j
k and the segmentationMk from
the initial shape to asess the degree of surface correspondence.
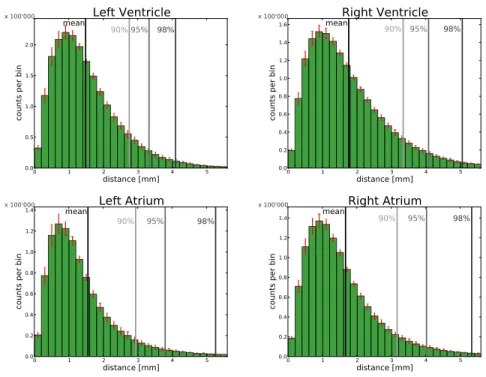
Error histograms for the vertices of the four heart chambers are shown in Fig. 5. The average surface error over the four heart chambers amounts to 1.6 mm. Note that sincedE, dM anddS form a triangle, a small mesh distance
dM implies dE ≈ dS. It can be seen that the surface error dS is smallest for
the left ventricle. Further, most of the vertices have an error of 1 mm since the histograms have a peak around that value and there are some outliers (in the order of a few percent) that show larger errors. Also, the histograms are very consistent across different scans as indicated by the small error bars.
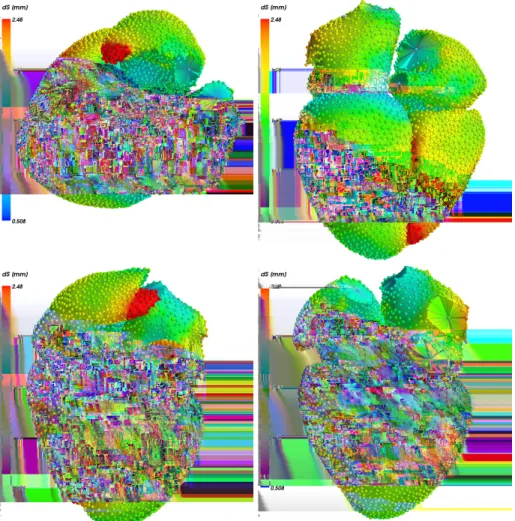
Looking at the spatial distribution of the errors (Fig. 6), we see outliers in right atrial high curvature regions and in the lower part of the right ventricle.
3.4 Examples of Encoded Structures
We used our approach to encode muscle fiber directions in a volumetric left ventricle mesh using a rule-based approach [19] needed for electrophysiological and mechanical simulations, see Fig. 7 left. As shown by Figs. 5 (upper left) and 6, the surface correspondence error in the left ventricle is 1.5 mm on average.
Secondly, we encoded the sinus node (SN), Crista Terminalis (CT), pectinate muscles (PM), Bachmann bundle (BB), and right atrial inferior isthmus (II) as placed by the rule-based approach of [9] in the right atrium, see Fig. 7 left.
Average distance SN CT PM BB II
Euclidean distancedE [mm] 1.95 1.83 1.82 1.79 1.86 Mesh-to-mesh distancedM [mm] 0.50 0.51 0.48 0.56 0.48 Surface distancedS[mm] 1.95 1.84 1.83 1.79 1.87
0 1 2 3 4 5 distance [mm] 0.0 0.5 1.0 1.5 2.0
counts per bin
mean 90%95% 98% x 100'000
Left Ventricle
0 1 2 3 4 5 distance [mm] 0.0 0.2 0.4 0.6 0.8 1.0 1.2 1.4 1.6counts per bin
mean 90% 95% 98% x 100'000
Right Ventricle
0 1 2 3 4 5 distance [mm] 0.0 0.2 0.4 0.6 0.8 1.0 1.2 1.4counts per bin
mean 90% 95% 98% x 100'000
Left Atrium
0 1 2 3 4 5 distance [mm] 0.0 0.2 0.4 0.6 0.8 1.0 1.2 1.4counts per bin
mean 90% 95% 98%
x 100'000
Right Atrium
Fig. 5. Surface error histograms dS for N = 37 patients at the same heart phase (diastasis). We show results for the four heart chambers: left/right ventricle/atrium. We computed histograms for all N = 37 scans individually and visualize the mean (green bar) and two times its standard error (red) capturing 95% of the variance.
Summarizing the table, we find the average surface correspondence errordS (see
Fig. 4) for all five structures to be below 2 mm.
3.5 Simulating Atrial Excitation Propagation
To demonstrate our pipeline from image to simulation, we encode three things into the segmentation mesh: the location and fiber directionsfxalong the Crista Terminalis (see Fig. 7) and the simulation mesh itself, which has a four times higher resolution than the segmentation mesh. Excitation propagation is mod-eled by the anisotropic eikonal equation 1/v2x=∇τx>Dx∇τx, which we solve by a fast marching algorithm [17]. Here vx∈R+ is the local propagation velocity, τx ∈R+ is the resulting local activation time and the local tensorDx ∈R3×3
models the anisotropy caused by different conduction velocities along fiber di-rectionsfx and orthogonal to them. In Fig. 8, we compare an isotropic and an anisotropic simulation as done in [9]. We use a velocity ofvx= 0.9ms, andDx=I in the isotropic case (upper row) as well asDx= 32fxfx>+
1
2Iin the anisotropic case (lower row). This corresponds to a velocity of 2vx along the fibers and vx/2 orthogonal to the fibers in the anisotropic case. One can clearly see that
Fig. 6.Spatial distribution of the surface errorsdSaveraged over a subgroup ofN= 24 patients (segmented with the same mesh) at the same heart phase (diastasis).
the shape of the wavefront distinctively differs (as in [9]) and the personalized anisotropy is important.
4
Discussion and Conclusion
In this paper we have presented a generic interface allowing to encode informa-tion in mesh models used for model-based segmentainforma-tion. Once the mesh models are adapted to data, we obtain a personalised model for subsequent biophysical simulations. Experiments performed for the segmentation approach of [5] show that vertex positions of the generic model are mapped to corresponding positions after adapting the model toN = 37 CT scans with an average overall accuracy
Fig. 7.Encoded structures.LeftRule-based atrial fast conduction pathways [9], where the colors of the fibers correspond to 1) Sinus Node, 2) Crista Terminalis, 3) Pectinate Muscles, 4) Bachman Bundle, and 5) Inferior Isthmus.RightRule-based muscle fiber directions [19] encoded in volumetric left ventricular mesh.
Fig. 8.Excitation propagation in the human atria.Upper rowisotropic andlower rowanisotropic propagation using the Crista Terminalis.Left columnlocal activation timesτx,right columnsmembrane potential after 30, 60, and 90 ms.
of 1.6 mm for the heart chambers. These errors exclude anatomical variations in position across patients and they are larger than the segmentation error assessed by point-to-surface distances with an average of 0.55 mm. However, these errors are much smaller than the typical size of, for example, fast conducting pathways in the atria. We have demonstrated our pipeline from image data to biophysical model in a atrial excitation propagation simulation. The resulting models can be further used, for example to quantify the influence of myocardial structures on the excitation propagation in the atria [1].
The segmentation approach may be further optimized to better reconstruct corresponding positions after model adaptation, e.g., by locally adjusting the
mesh resolution or locally modifying the internal energy. In contrast, it does not handle variations of these structures between different individuals. However, if the structures are visible in the image, their position may be refined on an individual basis. This has been done similarly for detecting the coronary ostia on the aortic bulbus [20] or modeling the Purkinje system [4,15] or for personalising Purkinje terminals [2].
Beyond structure encoding, we also attached a mesh optimized for biophysical simulations directly to the model (host mesh fitting e.g.[14,6]) and simulated atrial excitation propagation. This is an alternative to registering a mesh for biophysical simulations to a binary segmentation result [10]. We could also use FieldML [3] to formalize the coupling of a simulation to a personalized anatomy. Thus, the direct encoding of simulation structures provides a simple processing pipeline paving the way for the integration into clinical workflows.
Acknowledgment. The research leading to these results has received funding from the European Community’s Seventh Framework Programme (FP7/2007-2013) under grant agreement number 224495 (euHeart project).
References
1. Burdumy, M., Luik, A., Neher, P., Hanna, R., Krueger, M.W., Schilling, C., Barschdorf, H., Lorenz, C., Seemann, G., Schmitt, C., D¨ossel, O., Weber, F.M.: Comparing measured and simulated wave directions in the left atrium - a workflow for model personalization and validation. Biomedical Engineering (2012)
2. Camara, O., Pashaei, A., Sebastian, R., Frangi, A.F.: Personalization of fast con-duction Purkinje system in eikonal-based electrophysiological models with optical mapping data. In: Statistical Atlases and Computational Models of the Heart, Lecture Notes in Computer Science, vol. 6364/2010, pp. 281–290. Springer (2010) 3. Christie, G.R., Nielsen, P.M., Blackett, S.A., Bradley, C.P., Hunter, P.J.: FieldML: concepts and implementation. Philosophical Transactions of the Royal Society A 367(1895), 1869–1884 (May 2009)
4. Dux-Santoy, L., Sebastian, R., Felix-Rodriguez, J., Ferrero, J.M., Saiz, J.: Interac-tion of specialized cardiac conducInterac-tion system with antiarrhythmic drugs: A simu-lation study. IEEE Transactions on Biomedical E 58(12), 3475–3478 (2011) 5. Ecabert, O., Peters, J., Schramm, H., Lorenz, C., von Berg, J., Walker, M.J.,
Vembar, M., Olszewski, M.E., Subramanyan, K., Lavi, G., Weese, J.: Automatic model-based segmentation of the heart in CT images. IEEE Transactions on Med-ical Imaging 27(9), 1189–1201 (2008)
6. Fernandez, J.W., Mithraratne, P., Thrupp, S.F., Tawhai, M.H., Hunter, P.J.: Anatomically based geometric modelling of the musculo-skeletal system and other organs. Biomechanics and Modeling in Mechanobiology 2, 139–155 (2004) 7. Hoogendoorn, C., Pashaei, A., Sebastian, R., Suknoa, F.M., C´amara, O., Frangi,
A.F.: Sensitivity analysis of mesh warping and subsampling strategies for gener-ating large scale electrophysiological simulation data. In: Functional Imaging and Modeling of the Heart (FIMH). LNCS, vol. 6666, pp. 418–426 (2011)
8. Kaus, M.R., Pekar, V., Lorenz, C., Truyen, R., Lobregt, S., Weese, J.: Automated 3-d PDM construction from segmented images using deformable models. IEEE Transactions on Medical Imaging 22(8), 1005–10013 (2003)
9. Krueger, M.W., Schmidt, V., Tob´on, C., Weber, F.M., Lorenz, C., Keller, D.U.J., Barschdorf, H., Burdumy, M., Neher, P., Plank, G., Rhode, K.S., Seemann, G., S´anchez-Quintana, D., Saiz, J., Razavi, R., D¨ossel, O.: Modeling atrial fiber ori-entation in patient-specific geometries: A semi-automatic rule-based approach. In: Functional Imaging and Modeling of the Heart (FIMH). LNCS, vol. 6666, pp. 223–232 (2011)
10. Lamata, P., Niederer, S., Nordsletten, D., Barber, D.C., Roy, I., Hose, D.R., Smith, N.: An accurate, fast and robust method to generate patient-specific cubic Hermite meshes. Medical Image Analysis 15(6), 801–813 (2011)
11. Neher, P., Barschdorf, H., Dries, S., Weber, F.M., Krueger, M.W., D¨ossel, O., Lorenz, C.: Automatic segmentation of cardiac CTs – personalized atrial models augmented with electrophysiological structures. In: Functional Imaging and Mod-eling of the Heart (FIMH). LNCS, vol. 6666, pp. 80–87 (2011)
12. Peyrat, J.M., Sermesant, M., Pennec, X., Delingette, H., Xu, C., McVeigh, E.R., Ayache, N.: A computational framework for the statistical analysis of cardiac diffu-sion tensors: Application to a small database of canine hearts. IEEE Transactions on Medical Imaging 26(10), 1–15 (October 2007)
13. Sakamoto, S., Nitta, T., Ishii, Y., Miyagi, Y., Ohmori, H., Shimizu, K.: Interatrial electrical connections: The precise location and preferential conduction. Journal of Cardiovascular Electrophysiology 16(10), 1077–1086 (2005)
14. Schulte, R.F., Sands, G.B., Sachse, F.B., D¨ossel, O., Pullan, A.J.: Creation of a human heart model and its customisation using ultrasound images. Biomedical Engineering 46, 26–28 (2001)
15. Sebastian, R., Zimmerman, V., Romero, D., Frangi, A.F.: Construction of a com-putational anatomical model of the peripheral cardiac conduction system. IEEE Transactions on Biomedical En 58, 3479–3482 (2011)
16. Sermesant, M., Delingette, H., Ayache, N.: An electromechanical model of the heart for image analysis and simulation. IEEE Transactions on Medical Imaging 25, 612–625 (2006)
17. Sermesant, M., Konuko˘glu, E., Delingette, H., Coudi`ere, Y., Chinchapatnam, P., Rhode, K.S., Razavi, R., Ayache, N.: An anisotropic multi-front fast marching method for real-time simulation of cardiac electrophysiology. In: Functional Imag-ing and ModelImag-ing of the Heart (FIMH). LNCS, vol. 4466, pp. 160–169 (2007) 18. Smith, N., de Vecchi, A., McCormick, M., Nordsletten, D., Camara, O., Frangi,
A.F., Delingette, H., Sermesant, M., Relan, J., Ayache, N., Krueger, M.W., Schulze, W.H.W., Hose, R., Valverde, I., Beerbaum, P., Staicu, C., Siebes, M., Spaan, J., Weese, P.H.J., Chapelle, H.L.D., Rezavi, R.: euHeart: personalized and integrated cardiac care using patient-specific cardiovascular modelling. Interface Focus 1(3), 349–364 (2011)
19. Streeter, D., Spontnitz, H., Patel, D., Ross, J., Sonnenblick, E.: Fiber orientation in the canine left ventricle during diastole and systole. Circulation Research 24, 339–347 (1969)
20. W¨achter, I., Kneser, R., Korosoglou, G., Peters, J., Bakker, N.H., v. d. Boomen, R., Weese, J.: Patient specific models for planning and guidance of minimally invasive aortic valve implantation. In: MICCAI, pp. 526–533. LNCS 6361, Springer (2010) 21. Zheng, Y., Barbu, A., Georgescu, B., Scheuering, M., Comaniciu, D.: Four-chamber heart modeling and automatic segmentation for 3d cardiac CT volumes using marginal space learning and steerable features. IEEE Transactions on Medical Imaging 27(11), 1668–1681 (2008)