Universidade de São Paulo
2012-09-15
Sperm head morphometry in ejaculates of
adult marmosets (Callithrix jacchus): a model
for studying sperm subpopulations and
among-donor variations
Theriogenology, New York, v. 78, n. 5, pp. 1152-1165, sep 15, 2012
http://www.producao.usp.br/handle/BDPI/35157
Downloaded from: Biblioteca Digital da Produção Intelectual - BDPI, Universidade de São Paulo
Biblioteca Digital da Produção Intelectual - BDPI
Sperm head morphometry in ejaculates of adult marmosets
(
Callithrix jacchus
): A model for studying sperm subpopulations
and among-donor variations
R.R. Valle
a,b, P.L. Nayudu
c, C.L.V. Leal
d, M. García-Herreros
d,*
aFMVZ, Universidade de São Paulo, São Paulo, São Paulo, BrazilbUniversidade Paulista, São Paulo, São Paulo, Brazil cDeutches Primatenzentrum, Göttingen, Germany dFZEA, Universidade de São Paulo, Pirassununga, São Paulo, Brazil
Received 31 January 2012; received in revised form 20 May 2012; accepted 20 May 2012
Abstract
In humans and other mammals, sperm morphology has been considered one of the most important predictive parameters of fertility. The objective was to determine the presence and distribution of sperm head morphometric subpopulations in a nonhuman
primate model (Callithrix jacchus), using an objective computer analysis system and principal component analysis (PCA) methods
to establish the relationship between the subpopulation distribution observed and among-donor variation. The PCA method revealed a stable number of principal components in all donors studied, that represented more than 85% of the cumulative variance in all cases. After cluster analysis, a variable number (from three to seven) sperm morphometric subpopulations were identified with defined sperm dimensions and shapes. There were differences in the distribution of the sperm morphometric subpopulations
(P⬍0.001) in all ejaculates among the four donors analyzed. In conclusion, in this study, computerized sperm analysis methods
combined with PCA cluster analyses were useful to identify, classify, and characterize various head sperm morphometric subpopulations in nonhuman primates, yielding considerable biological information. In addition, because all individuals were kept in the same conditions, differences in the distribution of these subpopulations were not attributed to external or management factors. Finally, the substantial information derived from subpopulation analyses provided new and relevant biological knowledge which may have a practical use for future studies in human and nonhuman primate ejaculates, including identifying individuals more suitable for assisted reproductive technologies.
© 2012 Elsevier Inc. All rights reserved.
Keywords: Sperm morphometry; Principal component analysis; Sperm subpopulations; Cluster distribution; Nonhuman primate;Callithrix jacchus
1. Introduction
The use of nonhuman primate individuals for repro-ductive research has been of crucial importance for
several decades. The new world primate known as the common marmoset (Callithrix jacchus), a member of theCallitrichidaefamily, has been successfully used as a human and nonhuman primate model for andrological research and many other fields in reproductive sciences
[1–3]. This species is a good model for andrology, because of various biological factors, such as a similar testicular epithelium, spermatogenic organization, and
* Corresponding author. Tel.:⫹55 19 3565 4067; Fax:⫹55 19 3565 4117.
E-mail address:[email protected](M. García-Herreros).
Available online atwww.sciencedirect.com
Theriogenology 78 (2012) 1152–1165
www.theriojournal.com
0093-691X/$ – see front matter © 2012 Elsevier Inc. All rights reserved.
spermatogenenic process, making this species a model for human reproduction[2,4]. All these physiological factors, together with the relative availability of previ-ous data, economical and easy maintenance, and fi-nally, good breeding performance in captivity, make it an important model for development of assisted repro-ductive technologies, which are potentially useful in supporting the management and breeding of other en-dangered primate species[5].
Because sperm abnormalities are regarded as indi-cators for reduced fertility in both human and nonhu-man primates [6], it is necessary to develop methods based on nonsubjective techniques for measuring sperm characteristics. The introduction of automated sperm morphometry analysis may solve the problem of sub-jective evaluations on sperm morphology, because with this technology, semen research has gained objectivity and sensitivity[7]. However, although it is possible to minimize inter- and intraobserver variability with this technique, the classical approach considering the whole ejaculate as a homogeneous population with a normal distribution to assess sperm quality or biophysiological factors is considered erroneous [8]. In that regard, the existence of well-defined sperm subpopulations within mammalian ejaculates is now widely accepted by the scientific community[9,10]. Thus, there is a substantial loss of information when traditional statistical proce-dures are applied to the results, because the real distri-bution of sperm morphometry is not uniform and nor-mal, but rather structured in separate subpopulations
[11]. An association between computerized and statis-tical techniques could allow classifying the overall sperm population of semen samples into homogeneous separated subpopulations, grouping spermatozoa with similar morphometric characteristics[8].
There are apparently no reports regarding the ex-amination of sperm morphometric subpopulations on primate spermatozoa as a tool to assess and classify individuals and sperm samples with different char-acteristics. Therefore, the objectives of this work were to: (1) study the main morphologic differences intermarmoset individuals for analyzing the variabil-ity regarding sperm morphometric dimension and shape parameters; (2) characterize marmoset sperma-tozoa by using sperm head morphometry analysis; and finally (3) conduct a general and individual study of sperm morphometric subpopulations in marmoset ejaculates as a validated method to classify specific sperm subpopulation groups with similar character-istics.
2. Materials and methods
2.1. Reagents and experiment location
All chemicals used in this study, unless otherwise stated, were of analytical grade and purchased from Sigma-Aldrich Chemical Company (Sigma-Aldrich Brasil, Ltda., São Paulo, SP, Brazil). The experiment was carried out at the Deutches Primatenzentrum, Göt-tingen, Germany, and at the University of São Paulo, Pirassununga, SP, Brazil. All procedures were per-formed in accordance with the German animal protec-tion law (Animal Experiment Permission # AZ 509.42502/08-01.03).
2.2. Donors and semen collection
The study was conducted using 20 ejaculates col-lected from four healthy reproductively mature com-mon marmosets (genetically heterogeneous). Semen samples were collected on a regular basis by penile vibrostimulation apparatus (FertiCare Personal; Multi-cept ApS, Rungsted, Denmark), with slight modifica-tions of a published protocol [12](one collection per week). The modification consisted of stimulation phases of 2 min followed by resting phases of 30 sec. The first intensity in each stimulation phase was the same as the last one before the resting phase. Initial stimulation intensity was 70 Hz and 1-mm amplitude for 1 min, then increased to 80 Hz and same amplitude for 1 min. After the resting phase, stimulation was repeated with 80 Hz and 1-mm amplitude for 2 min. Stimulation was continued with 80 Hz and 1-mm am-plitude for 1 min and 70 Hz and 1.5-mm amam-plitude for 1 min. If ejaculation had not occurred, stimulation in-tensity was increased to 80 Hz and 1.5 mm, 90 Hz and
1.0 mm, and 90 Hz and 1.5 mm [13], pooling two
successive ejaculates from the same animal per day to obtain homogeneous samples. All marmosets were maintained under uniform nutritional and environmen-tal conditions to minimize external factor differences and effects on semen quality.
2.3. Semen processing and sample staining
Immediately after semen collection (at Deutches Pri-matenzentrum) into a dry handmade glass tube, the
semen was diluted into 50 L of modified
TALP-HEPES medium (TALP-TALP-HEPES ⫹3 mg/mL BSA V,
0.25 mM Na pyruvate, pH 7.33) at 37 °C in a water bath and sperm quality of each ejaculate was assessed (volume, sperm concentration, and sperm motility) with a phase-contrast Nikon Eclipse E200 microscope (Nikon, Tokyo, Japan). Slides were prepared by placing
the stained sperm sample on the clear end of a frosted microscope slide and dragging the drop across the slide to create a thin feathered smear (two smears per ejac-ulate). Duplicated sperm smears from each ejaculate were stained as described by Pope et al.[14]adapted to the marmoset[13]. Briefly, 5 L of semen were incu-bated with 5L of stain solution in a 0.5 mL microtube in the dark for 90 to 120 sec at room temperature (25 °C). Finally, samples were air dried, mounted, and permanently sealed with Eukitt mounting medium (Fluka BioChemika, Buchs SG, Switzerland) (22⫻50 coverslips). Only ejaculates with at least 20L of total volume, 800⫻106spermatozoa/mL concentration, and
75% motility were used.
2.4. Computerized sperm morphometric analysis
The prepared slides were used for computerized morphometric analysis using a commercially available system (Motic Corporation, Ltd., Hong Kong, China) equipped with a Nikon Eclipse E200 (Nikon, Tokyo, Japan) microscope with a 100⫻ oil immersion bright-field objective magnification lens. The video signal was acquired by a MotiCam 2000 digital camera (CMOS ½ in; Motic Corporation, Ltd.) mounted over the micro-scope and connected to a Pentium P8400 4-gigabyte processor, as described [15]. The configuration of the computer system included the interface Motic Images Plus 2.0ML (Motic China Group, Ltd., Hong Kong) imaging analysis software. Digitized images were made up of 1 920 000 pixels (picture elements) and 256 gray levels. At least 500 spermatozoa per sample were ran-domly captured in two slides per ejaculate in the man-ual acquisition mode of the program. Data were com-piled and stored for further analysis. Sperm heads were displayed on the monitor at equivalent brightness, and all cells that did not overlap with debris or other cells were considered for analysis. The search, capture, and morphometric analysis in all slides was carried out by the same person. Each sperm head was measured for four primary dimensional parameters (area [A], perim-eter [P], length [L], and width [W]), and three head shape-derived parameters (ellipticity represented by L/W, elongation represented by [L⫺W]/[L⫹W], and rugosity represented by 4лA/P2). These morphometric
descriptors were chosen to provide maximal statistical information with a minimal number of parameters. Measurements of each individual sperm head from each ejaculate were saved in an Excel v. 2003 (Microsoft Corporation, Redmond, WA, USA)-compatible data-base by the software for further analysis.
2.5. Statistical analyses
All data derived from sperm morphometric charac-teristics were analyzed using the general lineal model (GLM) procedure for repeated measures, considering the effects of individual donor (within marmosets) and the variation among them (among marmosets). The effect of the individual donor on the overall percentage of spermatozoa was evaluated using a GLM for re-peated measures. In addition, data from all spermatozoa analyzed by the computer-assisted analysis were im-ported into a single data set or data matrix that repre-sented 19 450 observations, each defined by the seven morphometric descriptors. The main objective of the analysis was to extract sperm subpopulations, using data obtained from each donor by means of clustering procedures[15,16]. The level of significance was set at P⬍0.05. First, a principal component analysis (PCA) of the data (each variable was weighed with their eigen-vectors) was performed to derive a small number of linear combinations (principal components; PCs) that retained the information in the original variables as much as possible. This allowed one to summarize many variables in few, jointly uncorrelated PCs. A good result was considered if we obtained a few PCs accounting for a high proportion of the total variance. As a rotation method, the VARIMAX method with Kaiser normaliza-tion was used. The rotanormaliza-tion is a method to assist in inter-preting the importance of each principal factor in the factorial weight matrix. The next step was to perform a non-hierarchical analysis using the k-means model that uses euclidean distances from the quantitative variables after standardization of the data, so the cluster centers were the means of the observations assigned to each cluster. The multivariate k-means cluster analysis was done to classify spermatozoa into a reduced number of subpopulations according to their morphometric descrip-tors, as described by Peña et al. [8]. Spermatozoa that were very close to each other were assigned to the same cluster, whereas spermatozoa that were far apart were put into different clusters. Both ANOVA and2procedures were used to evaluate statistical differences in the distri-butions of observations (individual spermatozoa) within donors, ejaculates, and subpopulations (percentages of spermatozoa assigned), and then a GLM procedure was done to determine the effects of the donor, as well as their variation, on the relative distribution frequency of sper-matozoa within subpopulations. The GLM procedure was also used to evaluate the influence of the two independent variables on mean morphometric parameters defining the different sperm subpopulations (i.e., the cluster centers). Moreover, the coefficient of variation percentage was
cal-culated for all morphometric parameters; in that regard, the “within-animal” CV was intended as a means of mea-suring the “discrimination power” of each subpopulation within-animal. Differences between means were analyzed by Tukey’s test. Correlations between the PCs and various morphometric parameters were performed by Pearson’s correlation coefficients. All statistical analyses were per-formed using SPSS 15.0 software (SPSS Inc., Chicago, IL, USA).
3. Results
3.1. Objective evaluation and morphometric characterization of ejaculated marmoset sperm
Overall and individual results regarding the sperm morphometric parameters are summarized (Table 1). There were differences (P⬍0.01) among donors for all dimensional parameters explored (area, perimeter, length, and width) as well as for all shape parameters analyzed (ellipticity, elongation, and rugosity). Percentage of head abnormalities present in marmoset sperm varied among donors (range, 4.0% to 22.2%), the majority being mac-rocephalic and micmac-rocephalic spermatozoa. However, considering all kinds of sperm abnormalities (including midpiece and tail defects), the percentage ranged from 9.1% to 33.2% (depending on the marmoset analyzed). Finally, as expected, because of the minimal requirements for all ejaculates used for the study, there were no differ-ences among marmosets regarding motility or viability (P⬎0.05), with an overall percentage of 81.82⫾ 3.20 and 85.25⫾3.42 (mean⫾SEM), respectively.
3.2. Identification of marmoset sperm
subpopulations: sperm head dimension and shape classification
Values for all sperm head dimension and shape parameters of marmoset donors were determined to be
normally distributed by Kolmogorov–Smirnov normal-ity test[8]. The PC analysis (data matrix consisted of 19 450 observations) rendered seven, three, four, and six PCs, respectively, with eigenvalues above one (de-pending on the donor analyzed), which accounted for more than 85% of the cumulative variance from the seven initial morphometric parameters (93.5%, 85.0%, 96.3%, and 95.4%, respectively;Table 2). These prin-cipal components of morphometry (PCM1 and PCM2) were constant in all donors and were used to charac-terize each spermatozoon and classify them in the sub-sequent cluster analysis. The PCM1a was strongly and positively related to the dimensional parameters (area, perimeter, and length) and to shape parameters (ellip-ticity and elongation); however, it was negatively re-lated to width and rugosity. PCM2a was strongly and negatively related to the shape parameters (ellipticity and elongation) and positively related to the dimension parameters (area and width). In contrast, PCM1b was positively related to the area and perimeter and again to shape parameters of ellipticity and elongation, whereas PCM2b was positively related to area and perimeter and strongly related to length (which was negatively related to ellipticity and elongation). PCM1c was strongly and positively related to all dimension and shape parameters, but negatively related to rugosity. PCM2c was positively related to dimension parameters, but to a lesser degree than PCM1c. However, in con-trast with PCM1c, it was strongly and negatively re-lated to ellipticity and elongation shape parameters. Regarding shape parameters, PCM1d was strongly and positively related to ellipticity and elongation, but neg-atively related to rugosity parameter. However, it was strongly and positively related to sperm dimension pa-rameters (except width). PCM2d was strongly and neg-atively related to ellipticity and elongation, and strongly and positively related to width, and to a lesser
Table 1
Mean⫾SEM values for various morphometric dimensions and shapes of sperm heads in semen collected from four adult male marmosets. Morphometric variables Overall Donor
1 2 3 4 Area (m2) 15.24⫾0.02 15.37⫾0.04a 15.31⫾0.05a 16.00⫾0.03b 14.87⫾0.02c Perimeter (m) 14.58⫾0.01 14.73⫾0.02a 14.56⫾0.02b 14.95⫾0.05c 14.39⫾0.01d Length (m) 5.19⫾0.00 5.25⫾0.01a 5.12⫾0.01b 5.32⫾0.02c 5.15⫾0.00b Width (m) 3.46⫾0.00 3.44⫾0.00a 3.54⫾0.01b 3.55⫾0.01b 3.40⫾0.00c Ellipticity 1.51⫾0.00 1.55⫾0.00a 1.47⫾0.00b 1.51⫾0.00c 1.52⫾0.00c Elongation 0.19⫾0.00 0.20⫾0.00a 0.18⫾0.00b 0.19⫾0.00c 0.20⫾0.00a Rugosity 0.89⫾0.00 0.88⫾0.00a 0.90⫾0.00b 0.89⫾0.00c 0.90⫾0.00d
All marmosets (N⫽4) were clinically healthy and were used frequently for semen collection in the Deutches Primatenzentrum. Within a row, means without a common superscript letter differed among individuals (P⬍0.01).
degree positively related to area, perimeter, and length. Finally, although PCM1e was strongly and positively related to perimeter, length, ellipticity, and elongation, PCM2e was negatively related to perimeter, length, ellipticity, and elongation.
The next step was to carry out a hierarchical analysis and to apply the Ward’s method on the PCs score. After checking the agglomeration schedule to establish the number of clusters, the final step was the application of k-means clustering analysis on PCs and subsequent classification of the seven morphometric descriptors. Finally, sperm subpopulations or clusters of morphom-etry (CLM1a to CLM7a, CLM1b to CLM3b, CLM1c to CLM4c, CLM1d to CLM6d, and CLM1e to CLM5e) were distinguished. A summarized classification of the sperm morphometric PCs is shown (Table 2).
3.3. Structure and distribution of marmoset sperm morphometric subpopulations
Seven sperm subpopulations were identified in do-nor 1 in the data matrix (4568) after the PCA and cluster analysis, following the steps described above. The disclosed subpopulations were distributed and characterized by different values (P⬍0.001) of sperm head dimensions and shapes. Morphometric character-istics of those subpopulations are shown (Table 3). Following the same PCA and cluster analysis, three sperm subpopulations were established for donor 2 ejaculates (from a total data matrix of 4346 elements).
The identified subpopulations were structured by dif-ferent values (P⬍0.001) of sperm head dimension and shape parameters. Summary statistics of these subpopu-lations are shown (Table 4). After the same PCA and cluster analysis, four sperm subpopulations were estab-lished for donor 3 (from a total data matrix of 4052 elements). The identified subpopulations were struc-tured by different values (P ⬍ 0.001) of sperm head dimension and shape parameters. Summary statistics are shown (Table 5). Derived from the PCA and cluster analysis of the last donor (donor 4), six sperm subpopu-lations were identified in the data matrix (6484). The disclosed subpopulations were distributed and charac-terized by different values (P⬍ 0.001) of sperm head dimensions and shapes. Morphometric characteristics of those subpopulations are shown (Table 6). Finally, after the last PCA and cluster analysis, five sperm subpopulations were detected for all donors analyzed (from a total data matrix of 19 450 elements). The identified subpopulations were structured by different values (P⬍0.001) of sperm head dimension and shape parameters. Summary statistics are shown (Table 7).
3.4. Frequency distribution of spermatozoa in sperm morphometric subpopulations
The number and frequency of distribution of sper-matozoa falling into each subpopulation derived from the morphometric analysis are shown (Table 8). Statis-tical differences were observed in the percentage of
Table 2
Summary of the results of the principal component analysis performed on the computerized sperm head morphometric analysis data obtained from adult marmosets.
Initial eigenvalues Eigenvectors Principal components Eigen values Variance explained (%) Cumulative (%) Area (m2) Perimeter (m) Length (m) Width (m) Ellipticity (⫺) Elongation (⫺) Rugosity (⫺) Donor 1 PCM1a 4.085 58.362 58.362 0.692 0.884 0.937 ⫺0.024 0.732 0.789 ⫺0.888 PCM2a 2.457 35.107 93.469 0.704 0.452 0.269 0.983 ⫺0.565 ⫺0.563 0.289 Donor 2 PCM1b 3.875 55.357 55.357 0.732 0.883 0.577 0.118 0.804 0.815 ⫺0.855 PCM2b 2.078 29.683 85.041 0.481 0.251 0.928 ⫺0.468 ⫺0.456 ⫺0.139 0.403 Donor 3 PCM1c 4.740 67.717 67.717 0.858 0.947 0.973 0.347 0.779 0.808 ⫺0.883 PCM2c 2.000 28.571 96.289 0.496 0.305 0.170 0.928 ⫺0.603 ⫺0.547 0.329 Donor 4 PCM1d 4.460 63.714 63.714 0.774 0.903 0.962 0.083 0.801 0.796 ⫺0.915 PCM2d 2.219 31.705 95.419 0.613 0.411 0.169 0.984 ⫺0.558 ⫺0.568 0.208 All donors PCM1e 4.130 59.003 59.003 0.760 0.900 0.877 0.138 0.755 0.787 ⫺0.875 PCM2e 2.117 30.238 89.241 0.557 0.332 0.340 0.925 ⫺0.562 ⫺0.546 0.336 Initial eigenvalues of the two principal components of morphometry (PCM) are given for each donor (N⫽5 ejaculates) and for all donors (N⫽ 20 ejaculates), respectively. Percentage of variance is the proportion of the total variance explained by each principal component (PC). The eigenvectors are a measure of the association of the original parameters with the resulting PC.
spermatozoa included in each subpopulation. With re-gard to donor 1, there were no differences in the per-centage of distribution within CLM1a, CLM2a and CLM4a (first group), within CLM3a and CLM5a (sec-ond group), and finally within CLM6a and CLM7a (third group), where the frequency of distribution of
spermatozoa was homogeneous (P⬎ 0.05). However,
differences were detected among these groups of sub-populations within the same donor (P ⬍ 0.001). Re-garding donor 2, there were statistical differences among all subpopulations, with CLM1b, CLM2b, and
CLM3b (P⬍ 0.001) having a high degree of
hetero-geneity in the percentage of distribution of these sub-populations. Donor 3 had statistical differences among all percentages of spermatozoa falling in each
subpop-ulation (CLM1c, CLM2c, CLM3c, and CLM4c; P ⬍
0.001) that together with donor 2 represented a high degree of heterogeneity in the sperm distribution. Un-like the results obtained before for donors 2 and 3, donor 4 had a particular pattern of spermatozoa distri-bution in four different groups where the distridistri-bution was homogeneous in CLM1d, CLM2d, and CLM4d subpopulations (first group), CLM5d and CLM6d (sec-ond group), and finally CLM3d (third group) without differences in the distribution of spermatozoa falling within these groups (P ⬎ 0.05). However, there were statistical differences in the percentage of distribution among these groups of subpopulations within donor 4 (P⬍0.001). Finally, regarding all donors together, no statistical differences were detected comparing CLM1e, CLM3e, and CLM4e subpopulations, showing a high degree of homogeneity among them. However, there were differences among all these subpopulations and
CLM2e and CLM5e (P ⬍ 0.001). The number and
distribution (percentage) of spermatozoa falling into each subpopulation derived from the overall (all do-nors) morphometric analysis within each individual is shown (Table 9). Differences in the distribution of spermatozoa within subpopulations (CLM1, CLM2, CLM3, and CLM5) were detected comparing individ-uals, showing a high degree of heterogeneity among them (P⬍ 0.001).
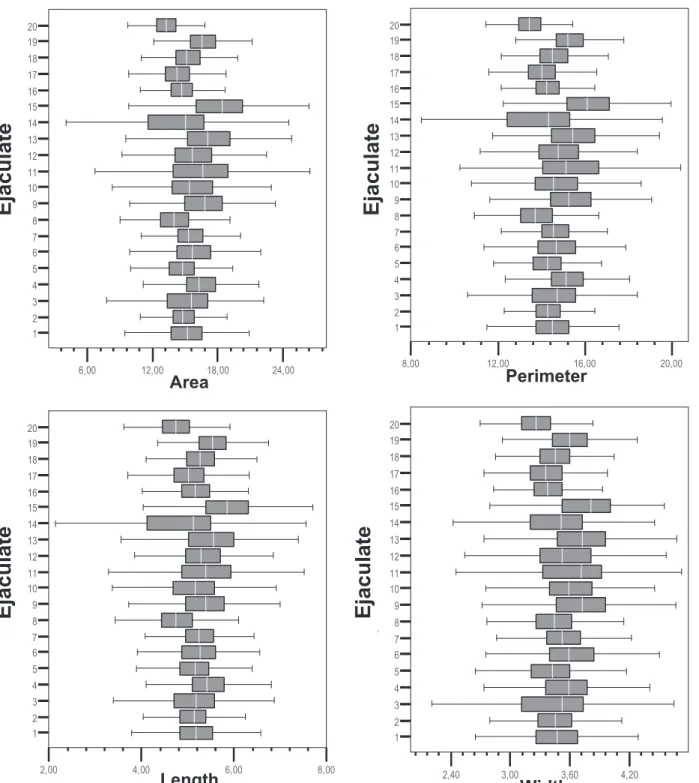
3.5. Ejaculate variation: head morphometric structure differences among ejaculates
Variations in sperm head morphometric dimension and shape parameters according to the ejaculate ana-lyzed (1 to 20) are shown (Fig. 1). Statistical analysis of morphometric parameters confirmed differences among ejaculates for all the dimension and shape parameters studied (P⬍ 0.001). There was a high degree of
vari-Table 3 Effect of donor on the distribution of sperm head morphometric subpopulations assessed in individual adult marmosets (donor 1). Subpopulation Mean ⫾ SD (CV %) CLM1a CLM2a CLM3a CLM4a CLM5a CLM6a CLM7a Area ( m 2) 13.98 ⫾ 0.9 (7.01) 15.17 ⫾ 1.1 (7.84) 9.13 ⫾ 1.47 (16.10) 16.75 ⫾ 0.9 (5.91) 20.69 ⫾ 1.9 (9.61) 20.37 ⫾ 3.99 (19.58) 11.09 ⫾ 2.2 (19.83) Perimeter ( m) 13.93 ⫾ 0.5 (3.87) 14.31 ⫾ 0.6 (4.26) 11.05 ⫾ 0.9 (8.59) 15.40 ⫾ 0.5 (3.50) 17.67 ⫾ 1.0 (5.88) 20.08 ⫾ 2.51 (12.50) 13.42 ⫾ 1.5 (11.54) Length ( m) 5.07 ⫾ 0.27 (5.32) 4.91 ⫾ 0.27 (5.49) 3.69 ⫾ 0.38 (10.29) 5.61 ⫾ 0.24 (4.27) 6.12 ⫾ 0.57 (9.31) 7.61 ⫾ 1.11 (14.58) 4.93 ⫾ 0.63 (12.77) Width ( m) 3.23 ⫾ 0.16 (4.95) 3.68 ⫾ 0.22 (5.97) 2.77 ⫾ 0.37 (13.35) 3.60 ⫾ 0.20 (5.55) 4.08 ⫾ 0.46 (11.27) 2.86 ⫾ 0.76 (26.57) 2.21 ⫾ 0.37 (16.74) Ellipticity 1.55 ⫾ 0.09 (5.80) 1.33 ⫾ 0.08 (6.01) 1.35 ⫾ 0.20 (14.81) 1.56 ⫾ 0.11 (7.05) 1.52 ⫾ 0.24 (15.78) 2.97 ⫾ 1.62 (54.54) 2.27 ⫾ 0.44 (19.38) Elongation 0.21 ⫾ 0.02 (9.52) 0.14 ⫾ 0.03 (21.42) 0.14 ⫾ 0.07 (50.00) 0.21 ⫾ 0.03 (14.28) 0.19 ⫾ 0.08 (42.10) 0.45 ⫾ 0.11 (24.44) 0.38 ⫾ 0.07 (18.42) Rugosity 0.90 ⫾ 0.02 (2.22) 0.92 ⫾ 0.01 (1.08) 0.93 ⫾ 0.03 (3.22) 0.88 ⫾ 0.02 (2.27) 0.83 ⫾ 0.05 (6.02) 0.63 ⫾ 0.09 (14.28) 0.77 ⫾ 0.06 (7.79) This table represents the means values for each subpopulation, N ⫽ 4568. Clusters of morphometry (CLM) are represented for each subpopulation (1 to 7). CV % represents the coefficient of variation expressed as a percentage.
ability among ejaculates, even within the same donor analyzed for area, perimeter, length, width, ellipticity, elongation, and rugosity values (Fig. 1). Each box en-closed the 25th and 75th percentiles, the vertical line within each box indicated the median value and the whiskers extended to the 5th and 95th percentiles of the mean values.
3.6. Correlation level of different principal
components and the sperm morphometric dimension and shape parameters
Relationships among PCs and the different morpho-metric variables were studied to determine the degree of correlation among them and morphometric parame-ters. Irrespective of the donor studied, there were strong correlations (P⬍0.01). In donor 1, there was a
nega-tive correlation between PCM1a and width (r ⫽
⫺0.709; P ⬍ 0.01) and positive with ellipticity (r ⫽
0.918; P⬍0.01) and elongation (r⫽0.957; P⬍0.01). However, there was a strong and positive correlation
between PCM2a and area and perimeter (r ⫽ 0.987,
r⫽0.943, respectively; P⬍0.01). In donor 2, PCM1b was positively and strongly correlated with ellipticity
(r⫽0.924; P⬍0.01) and elongation (r⫽0.925; P⬍ 0.01), whereas PCM2b was positively correlated with length (r⫽0.888; P⬍0.01) and width (r⫽0.813; P⬍ 0.01). In donor 3, PCM1c was positively and strongly correlated with ellipticity (r ⫽ 0.984; P ⬍ 0.01) and
elongation (r ⫽ 0.970; P ⬍ 0.01). However, PCM2c
was positively correlated with area and perimeter (r⫽
0.935,r⫽0.847, respectively; P⬍ 0.01). In donor 4, PCM1d was positively correlated with ellipticity (r⫽
0.969; P ⬍ 0.01), whereas PCM2d was highly and
positively correlated with area (r⫽0.974; P ⬍0.01). Finally, taking into account all donors analyzed, PCM1e was positively correlated with perimeter (r ⫽
0.952; P ⬍ 0.01) and length (r ⫽ 0.813; P ⬍ 0.01); however, PCM2e was positively correlated with width (r⫽0.905; P ⬍0.01).
4. Discussion
Little information is available in the literature con-cerning the sperm subpopulation characteristics in
non-human primates. The common marmoset (Callithrix
jacchus) is a well-established experimental model for
Table 4
Effect of donor on the distribution of sperm head morphometric subpopulations assessed in individual adult marmosets (donor 2). Subpopulation Mean⫾SD (CV %) CLM1b CLM2b CLM3b Area (m2) 19.71⫾5.22 (26.40) 17.82⫾2.47 (13.86) 13.77⫾2.04 (14.81) Perimeter (m) 19.34⫾3.14 (16.02) 15.95⫾1.23 (7.71) 13.58⫾1.11 (8.17) Length (m) 7.64⫾0.90 (11.78) 5.70⫾0.45 (7.89) 4.69⫾0.49 (10.44) Width (m) 3.21⫾0.83 (25.85) 3.76⫾0.44 (11.70) 3.44⫾0.35 (10.17) Ellipticity 2.73⫾0.80 (29.30) 1.53⫾0.19 (12.41) 1.37⫾0.14 (10.21) Elongation 0.44⫾0.10 (22.72) 0.20⫾0.05 (25.00) 0.15⫾0.05 (33.33) Rugosity 0.66⫾0.12 (18.18) 0.87⫾0.04 (4.59) 0.93⫾0.02 (2.15) This table represents the means values for each subpopulation, N⫽4346. Clusters of morphometry (CLM) are represented for each subpopulation (1 to 3). CV % represents the coefficient of variation expressed as a percentage.
Table 5
Effect of donor on the distribution of sperm head morphometric subpopulations assessed in individual adult marmosets (donor 3). Subpopulation Mean⫾SD (CV %) CLM1c CLM2c CLM3c CLM4c Area (m2) 19.52⫾7.40 (37.90) 20.54⫾2.67 (12.99) 15.47⫾1.72 (11.11) 9.21⫾1.77 (19.21) Perimeter (m) 18.99⫾4.32 (22.74) 17.39⫾1.41 (8.10) 14.59⫾0.83 (5.68) 10.92⫾1.10 (10.07) Length (m) 7.20⫾1.77 (24.58) 6.28⫾0.58 (9.23) 5.19⫾0.38 (7.32) 3.56⫾0.40 (11.23) Width (m) 2.79⫾0.71 (25.44) 4.02⫾0.38 (9.45) 3.57⫾0.32 (8.96) 2.94⫾0.40 (13.60) Ellipticity 2.63⫾0.58 (22.05) 1.57⫾0.18 (11.46) 1.46⫾0.13 (8.90) 1.22⫾0.17 (13.93) Elongation 0.43⫾0.07 (16.27) 0.21⫾0.05 (23.80) 0.18⫾0.04 (22.22) 0.09⫾0.06 (66.60) Rugosity 0.67⫾0.08 (11.94) 0.85⫾0.05 (5.88) 0.91⫾0.02 (2.19) 0.96⫾0.03 (3.12) This table represents the means values for each subpopulation, N⫽4052. Clusters of Morphometry (CLM) are represented for each subpopulation (1 to 4). CV % represents the coefficient of variation expressed as a percentage.
performing andrological studies and investigating re-productive biology in primates [17]. In the present work, a careful and accurate morphometrical research of marmoset spermatozoa was performed, including determination of sperm morphometric subpopulations and its differences in relation to the individuals studied. The underlying cause of the substantial variation among individual animals in sperm head distribution and organization remains to be determined. Based on these aspects and the phylogenetic proximity between humans and marmosets, the latter species might repre-sent an alternative and useful experimental model for performing comparative studies regarding sperm mor-phometric characteristics, particularly investigations re-lated to sperm subpopulations and the among-donor variations [16]. In the current study, analyzing more than 19 000 spermatozoa from fresh sperm samples with a computer analysis system together with PCA statistics provided enough information to characterize and study the distribution of various morphometric sperm subpopulations in the marmoset. As a conse-quence, the results obtained in the present study might be useful for biomedical research[18]or could be used as a tool to better understand the sperm variability to preserve the genetic stock from endangered primate species[19].
To date, we are aware of the relationship between the percentage of morphologically normal spermatozoa and fertility, both in human and in other mammals
[20 –25]. Considerable variations regarding the subjec-tive evaluation of semen characteristics have been re-ported. However, the association between computer-ized techniques and statistical analysis can reduce subjectivity in sperm morphology assessment, dimin-ishing the sources of variation and detecting subtle differences among individuals which cannot be de-tected with subjective traditional methods[26]. In this investigation, we aimed to characterize, apparently for the first time, sperm morphometric characteristics in a nonhuman primate species using a set of accurate, con-sistent, and objective techniques. Proper staining was crucial, both for accurate morphometric analysis and for minimizing errors in head digitization providing the highest cell/background contrast and the greatest stain-ing intensity [27]. The “simple stain” technique used was very useful in evaluating acrosome status of a sperm sample, which is an important advantage com-pared with traditional stains[28,29].
With regard to the effect of each animal on each sperm morphometric subpopulation structure, there were significant differences among animals for all
sub-Table 6 Effect of donor on the distribution of sperm head morphometric subpopulations assessed in individual adult marmosets (donor 4). Subpopulation Mean ⫾ SD (CV %) CLM1d CLM2d CLM3d CLM4d CLM5d CLM6d Area ( m 2) 15.81 ⫾ 0.97 (6.13) 12.60 ⫾ 1.36 (10.79) 14.01 ⫾ 1.04 (7.42) 17.15 ⫾ 1.40 (8.16) 19.08 ⫾ 5.33 (27.93) 20.71 ⫾ 2.62 (12.65) Perimeter ( m) 14.73 ⫾ 0.52 (3.53) 12.97 ⫾ 0.74 (5.70) 13.98 ⫾ 0.54 (3.86) 15.78 ⫾ 0.78 (4.94) 18.45 ⫾ 3.14 (17.00) 17.30 ⫾ 1.38 (7.97) Length ( m) 5.18 ⫾ 0.28 (5.40) 4.45 ⫾ 0.32 (7.19) 5.14 ⫾ 0.24 (4.66) 5.85 ⫾ 0.30 (5.12) 7.00 ⫾ 1.22 (17.42) 5.76 ⫾ 0.66 (11.45) Width ( m) 3.65 ⫾ 0.17 (4.65) 3.26 ⫾ 0.23 (7.05) 3.23 ⫾ 0.18 (5.57) 3.50 ⫾ 0.20 (5.71) 2.90 ⫾ 0.66 (22.75) 4.45 ⫾ 0.34 (7.64) Ellipticity 1.41 ⫾ 0.08 (5.67) 1.37 ⫾ 0.10 (7.29) 1.59 ⫾ 0.08 (5.03) 1.67 ⫾ 0.10 (6.00) 2.51 ⫾ 0.73 (29.08) 1.29 ⫾ 0.16 (12.40) Elongation 0.17 ⫾ 0.03 (17.64) 0.15 ⫾ 0.03 (20.00) 0.22 ⫾ 0.02 (9.09) 0.25 ⫾ 0.02 (8.00) 0.41 ⫾ 0.08 (19.51) 0.12 ⫾ 0.067 (50.00) Rugosity 0.91 ⫾ 0.01 (1.10) 0.93 ⫾ 0.01 (1.07) 0.90 ⫾ 0.01 (1.11) 0.86 ⫾ 0.03 (3.48) 0.80 ⫾ 0.07 (8.75) 0.86 ⫾ 0.05 (5.81) This table represents the means values for each subpopulation, N ⫽ 6484. Clusters of morphometry (CLM) are represented for each subpopulation (1 to 6). CV % represents the coefficient of variation expressed as a percentage.
populations studied. Despite CVs reported for other
primate species (Cynomolgus spp.) with regard to
sperm morphometric dimensions [30], after cluster analysis, marmoset ejaculates were less homogeneous than expected. Within-animal results for morphometric parameters were surprisingly variable; this was attrib-uted to the heterogeneity of sperm head populations, with strong evidence of the considerable polymorphism in this primate species. In the present study, it was difficult to determine if a specific dimension or shape parameter was the most suitable for using in the identification of individual marmosets, indicating the marked variability of sperm morphometric parameters for individual animals, in opposition with the results reported for cynomolgus monkey[30], where perimeter and shape may be the most important parameters. Un-fortunately, the study by Gago et al.[30] was carried out with traditional statistical methods, considering the whole ejaculate as a homogeneous sperm population, which may have caused substantial loss of information. Thus, the most useful parameters for marmoset sperm
characterization, according to their variability, remain undefined, and largely depend on the individual studied and its specific CV. Therefore, morphometric parame-ters could be important for studies of marmoset sperm, for example, for cryopreservation and its influence on the distribution of various subpopulations as described in other species [31]. Irrespective of the individual studied, these subpopulations coexist in marmoset ejac-ulates (large, average, and small spermatozoa). How-ever, depending on the donor, the number of subpopu-lations varied from three to seven, consistent with the high heterogeneity and variability of the ejaculates in this primate species. Thus, this finding appeared to be important as well in species with a supposedly high degree of homogeneity in sperm morphology, because computer analysis was more efficient than traditional methods to discriminate sperm morphometric subpopu-lations [32]. The accuracy of the computerized and statistical analysis system in enabling the detection of small, but significant differences among apparently normal spermatozoa in a given individual was
particu-Table 8
Number and frequency of distribution (percentage) of spermatozoa categorized into each subpopulation derived from the morphometric analysis.
Donor Subpopulation (clusters) CLM1, spz N (%) CLM2, spz N (%) CLM3, spz N (%) CLM4, spz N (%) CLM5, spz N (%) CLM6, spz N (%) CLM7, spz N (%) 1 1166 (25.50a) 1135 (24.80a) 319 (7.00b) 1288 (28.20a) 351 (7.70b) 161 (3.50c) 148 (3.20c) 2 144 (3.30a) 1492 (33.20b) 2760 (63.50c) — — — — 3 190 (4.70a) 1035 (25.60b) 2208 (54.50c) 638 (15.30d) — — — 4 1423 (19.90a) 1713 (24.40a) 1988 (34.70b) 948 (14.60a) 202 (3.10c) 210 (3.20c) — All donors 3615 (18.60a) 1014 (5.20b) 4045 (20.80a) 4412 (22.70a) 6364 (32.70c) — —
Results express the number and percentage of spermatozoa (spz) included in each subpopulation, depending on the marmoset studied (including the overall). Clusters of morphometry (CLM) are represented for each subpopulation (1 to 7). The results were obtained from 20 ejaculates (five ejaculates from each donor). The total number of spermatozoa analyzed from each donor was 4568, 4346, 4052, and 6484, respectively. The overall was 19 450 spermatozoa. Within a row, means without a common superscript letter differed (P⬍0.05).
Table 7
Distribution of sperm head morphometric subpopulations assessed in adult marmosets (all donors). Subpopulation Mean⫾SD (CV %)
CLM1e CLM2e CLM3e CLM4e CLM5e Area (m2) 15.07⫾2.90 (19.24) 20.66⫾4.71 (22.79) 14.95⫾2.65 (17.72) 14.59⫾2.08 (14.25) 11.09⫾1.47 (13.25) Perimeter (m) 14.40⫾1.60 (11.11) 18.85⫾2.55 (13.52) 14.26⫾1.44 (10.08) 14.17⫾1.15 (8.11) 12.17⫾1.30 (10.68) Length (m) 5.11⫾0.68 (13.30) 6.98⫾1.98 (28.36) 4.99⫾0.62 (12.42) 5.06⫾0.52 (10.27) 4.88⫾0.52 (10.65) Width (m) 3.48⫾0.43 (12.35) 3.43⫾1.88 (54.81) 3.53⫾0.39 (11.04) 3.40⫾0.31 (9.11) 2.15⫾0.32 (14.88) Ellipticity 1.47⫾0.18 (12.24) 2.24⫾0.95 (42.40) 1.41⫾0.17 (12.05) 1.49⫾0.15 (10.06) 2.26⫾0.46 (20.35) Elongation 0.18⫾0.06 (33.33) 0.34⫾0.13 (38.23) 0.16⫾0.05 (31.25) 0.19⫾0.05 (26.31) 0.38⫾0.09 (23.68) Rugosity 0.90⫾0.03 (3.34) 0.73⫾0.09 (12.32) 0.92⫾0.03 (3.26) 0.91⫾0.03 (3.29) 0.93⫾0.03 (3.22) This table represents the means values for each subpopulation, N ⫽ 19 450. Clusters of morphometry (CLM) are represented for each subpopulation (1 to 5). The results were obtained from 20 ejaculates (five ejaculates from each donor). CV % represents the coefficient of variation expressed as a percentage.
larly interesting for future studies regarding detection of different fertility profiles or predictors of sperm quality following cryopreservation procedures, even in other species as rhesus macaque (Macaca mulatta)
[33]. Semen analysis should, therefore, be performed to establish the presence of each of these subpopulations, and not only to provide average values for the semen population as a whole[8,15].
The distribution and structure of spermatozoa in each sperm subpopulation varied significantly, compar-ing various individuals studied. Thus, within the same donor, the proportions of spermatozoa within CLM5a and CLM6a (11% of the total matrix, characterized by the highest dimension values), differed from the pro-portions within CLM2a or CLM4a (53%, characterized by average dimension values) with differences exceed-ing 40%. However, these differences were present when we compared percentages from different individ-uals, even in populations with similar morphometric characteristics (e.g., CLM5a and CLM6a; 11%, com-pared with CLM1c and CLM2c; 31%), that had differ-ences of 20%. Therefore, we inferred that differdiffer-ences of subpopulations among donors were not limited to the distribution of the different subpopulations by them-selves (different characteristics in the same donor). However, they also represented percentages of different individuals, taking into account subpopulations with the same characteristics. These results confirmed that sperm morphometric subpopulations were strongly and clearly influenced by the donor studied, and the possi-bility to identify and determine specific morphometric characteristics in a single individual is a complicated process that requires an accurate analysis system [6]. Thus, a possible identification of a donor might be based on the proportion of spermatozoa within the subpopulation characterized by particular and concrete combination of sperm head dimension and shape char-acteristics. This differentiation process is interesting because of the description that subpopulations
contain-ing a higher percentage of bigger and round sperm heads might have compromised viability and motility of spermatozoa after various assisted reproductive tech-nologies (e.g., sperm cryopreservation) [34]. As re-ported previously in other mammalian species[8], in-dividuals with specific subpopulation structure matched up with the more sensitive ejaculates for cryopreserva-tion processes, because of possible slight differences in the sperm head volume.
The origin of these sperm morphometric subpopu-lations remains unclear. Some works in other primate species seem to indicate that it is plausible that varia-tion in sperm morphology arises during spermatogen-esis, when genotypic or biochemical effects influence sperm structure[35–37]. Although many other factors can also be related, the importance of sperm morpho-metric subpopulations is that they might be inherited traits[38], which points to the possibility of identifying the most suitable individuals to collect ejaculates for biotechnological procedures, such as sperm cryopreser-vation or sperm sex selection. There was considerable inter- and intramale variation in sperm morphometric parameters and subpopulations; there are several pos-sible explanations for this variability. First, it may re-flect animals from different genetic backgrounds. In contrast, we reported a moderately low degree of tera-tospermia in all samples, irrespective of the marmoset studied, that has been associated with an inbreeding causative factor[39]. However, the origin of this level of teratospermy is still unknown, because of the het-erogenetic origin of the animals used in this study. Second, it is recognized that collection of semen from primates can produce variable results because of incon-sistent stimulation conditions (e.g., related top robe position, which may have affected seminal collections
[40]). However, this factor can be associated with elec-troejaculation method, that has not been used in this study. Nevertheless, we used a vibrostimulation method, that can produce a sperm loss that may vary from one
Table 9
Number and distribution (%) of spermatozoa in each subpopulation derived from the overall morphometric analysis within each marmoset. Donor Subpopulation (clusters)
CLM1, spz N (%) CLM2, spz N (%) CLM3, spz N (%) CLM4, spz N (%) CLM5, spz N (%) M1 1127 (25.90a) 183 (4.00a) 998 (21.80a) 1158 (25.40a) 1102 (22.90a)
M2 432 (9.90b) 45 (1.00a) 773 (17.80a) 1024 (23.50a) 2072 (47.80b)
M3 968 (23.80a) 620 (15.30b) 1122 (27.70a) 1085 (26.70d) 257 (6.50c)
M4 1088 (16.70ab) 166 (2.60a) 1152 (17.80a) 1145 (17.70a) 2933 (45.20b)
Results express the number and percentage of spermatozoa included in each subpopulation depending upon the marmoset studied. Clusters of morphometry (CLM) are represented for each subpopulation (1 to 5). The results were obtained from 20 ejaculates (five ejaculates from each donor). The total number of spermatozoa assessed was 19 450 spermatozoa. Within a column, means without a common superscript letter differed (P⬍0.05).
6,00 12,00 18,00 24,00 1 2 3 4 5 6 7 8 9 10 11 12 13 14 15 16 17 18 19 20
E
J
ACUL
AT
E
8,00 12,00 16,00 20,00 1 2 3 4 5 6 7 8 9 10 11 12 13 14 15 16 17 18 19 20E
J
A
C
U
L
A
T
E
2,00 4,00 6,00 8,00 1 2 3 4 5 6 7 8 9 10 11 12 13 14 15 16 17 18 19 20E
J
ACUL
AT
E
2,40 3,00 3,60 4,20 1 2 3 4 5 6 7 8 9 10 11 12 13 14 15 16 17 18 19 20E
J
A
C
U
L
A
T
E
Ejaculate
E
jac
ula
te
E
jac
ulate
Ejaculate
Area
Perimeter
Length
Width
Fig. 1. Box-and-whisker plots of variations in sperm head morphometric parameters according to the ejaculate analyzed (donor 1: 1 to 5; donor 2: 6 to 10; donor 3: 11 to 15; donor 4: 16 –20). Each box enclosesd the 25th and 75th percentiles, the vertical line within each box indicated the median value and the whiskers extended to the 5th and 95th percentiles of the mean values. There were differences among ejaculates for all parameters analyzed (P⬍0.001).
1,20 1,50 1,80 2,10
ELLIPTICITY
1 2 3 4 5 6 7 8 9 10 11 12 13 14 15 16 17 18 19 20 0,00 0,10 0,20 0,30ELONGATION
1 2 3 4 5 6 7 8 9 10 11 12 13 14 15 16 17 18 19 20E
J
A
C
U
L
A
T
E
0,75 0,83 0,90 0,98RUGOSITY
1 2 3 4 5 6 7 8 9 10 11 12 13 14 15 16 17 18 19 20E
J
A
C
U
L
A
T
E
Ellipticity
Elongation
Rugosity
Ejaculate
Ejac
ula
te
Elongation
Ejaculate
Fig. 1.(Continued)attempt to the next, because of slight differences in stimulation. Although some of the defects may be in-duced by the collection procedure, several lines of evidence suggest that the collection procedure may not be directly responsible for the sperm abnormalities
[12,41]. Finally, the variability may related to housing conditions, social status, tolerance of the animals and stress, all of which can affect spermatogenic or epidid-ymal physiology[42,43].
In conclusion, in the the current study, computerized sperm analysis methods combined with PCA cluster analyses were useful to identify, classify, and charac-terize different sperm morphometric subpopulations in marmoset monkey spermatozoa. These successfully identified sperm subpopulations coexisted in fresh mar-moset semen; however, the distribution and structure varied significantly among individuals, presumably be-cause of various endogenous factors. In addition, this heterogeneity might be indicative of the different fer-tility potential as all individuals were maintained under similar conditions. Finally, the substantial information derived from subpopulation analyses provided new and relevant biological knowledge, which might have a practical use for future studies in human and nonhuman primate ejaculates, for example, for identifying individ-uals more suitable for assisted reproductive technolo-gies.
Acknowledgments
The authors thank Agustín Sánchez-Domínguez for excellent technical assistance. Dr. García-Herreros was funded by Spanish Government (MAE, 2010-IA).
References
[1] Liu DY, Lopata A, Pantke P, Baker HW. Horse and marmoset monkey sperm bind to the zona pellucida of salt-stored human oocytes. Fertil Steril 1991;56:764 –7.
[2] Millar MR, Sharpe RM, Weinbauer GF, Fraser HM, Saunders PT. Marmoset spermatogenesis: organizational similarities to the human. Int J Androl 2000;23:266 –77.
[3] Leal MC, França LR. The seminiferous epithelium cycle length in the black tufted-ear marmoset (Callithrix penicillata) is sim-ilar to humans. Biol Reprod 2006;74:616 –24.
[4] Wistuba J, Luetjens CM, Wesselmann R, Nieschlag E, Simoni M, Schlatt S. Meiosis in autologous ectopic transplants of im-mature testicular tissue grafted toCallithrix jacchus. Biol Re-prod 2006;74:706 –13.
[5] Morrell JM, Hodges JK. Cryopreservation of non-human pri-mate sperm: priorities for future research. Anim Reprod Sci 1998;53:43– 63.
[6] Lewis SE. Is sperm evaluation useful in predicting human fertility? Reproduction 2007;134:31– 40.
[7] Guidelines on the application of CASA technology in the anal-ysis of spermatozoa. ESHRE Andrology Special Interest Group. European Society for Human Reproduction and Embryology. Hum Reprod 1998;13:142–5.
[8] Peña FJ, Saravia F, García-Herreros M, Núñez-martínez I, Tapia JA, Johannisson A, et al. Identification of sperm morpho-metric subpopulations in two different portions of the boar ejaculate and its relation to postthaw quality. J Androl 2005;26: 716 –23.
[9] Spanò M, Evenson DP. Flow cytometric analysis for reproduc-tive biology. Biol Cell 1993;78:53– 62.
[10] Petrunkina AM, Waberski D, Günzel-Apel AR, Töpfer-Petersen E. Determinants of sperm quality and fertility in domestic spe-cies. Reproduction 2007;134:3–17.
[11] Martí JI, Aparicio IM, García-Herreros M. Head morphometric changes in cryopreserved ram spermatozoa are related to sexual maturity. Theriogenology 2011;75:473– 81.
[12] Kuederling I, Schneiders A, Sønksen J, Nayudu PL, Hodges JK. Non-invasive collection of ejaculates from the common mar-moset (Callithrix jacchus) using penile vibrostimulation. Am J Primatol 2000;52:149 –54.
[13] Valle RR, Valle CM, Nichi M, Muniz JA, Nayudu PL, Guimarães MA. Validation of non-fluorescent methods to reli-ably detect acrosomal and plasma membrane integrity of com-mon marmoset (Callithrix jacchus) sperm. Theriogenology 2008;70:115–20.
[14] Pope CE, Zhang YZ, Dresser BL. A simple staining method for evaluating acrosomal status of cat spermatozoa. J Zoo Wildl Med 1991;22:87–95.
[15] Martí JI, Aparicio IM, García-Herreros M. Sperm morphomet-ric subpopulations are differentially distributed in rams with different maturity age in cryopreserved ejaculates. Theriogenol-ogy 2011;76:97–109.
[16] Davis RO, Drobnis EZ, Overstreet JW. Application of multi-variate cluster, discriminate function, and stepwise regression analyses to variable selection and predictive modeling of sperm cryosurvival. Fertil Steril 1995;63:1051–7.
[17] Nanassy L, Griffin J, Emery BR, Carrell DT. The marmoset and cotton rat as animal models for the study of sperm chromatin packaging. Syst Biol Reprod Med 2010;56:207–12.
[18] Cordelli E, Eleuteri P, Leter G, Rescia M, Spanò M. Flow cytometry applications in the evaluation of sperm quality: se-men analysis, sperm function and DNA integrity. Contraception 2005;72:273–9.
[19] Corley-Smith GE, Brandhorst BP. Preservation of endangered species and populations: A role for genome banking, somatic cell cloning, and androgenesis? Mol Reprod Dev 1999;53: 363–7.
[20] Cameron DF, Murray FT, Drylie DD. Ultrastructural lesions in testes from hyperprolactinemic men. J Androl 1984;5:283–93. [21] Kruger TF, Swanson RJ, Hamilton M, Simmons KF, Acosta AA, Matta JF, et al. Abnormal sperm morphology and other semen parameters related to the outcome of the hamster oocyte human sperm penetration assay. Int J Androl 1988;11:107–13. [22] Colenbrander B, Kemp B. Factors influencing semen quality in
pigs. J Reprod Fertil Suppl 1990;40:105–15.
[23] Jasko DJ, Lein DH, Foote RH. Determination of the relationship between sperm morphologic classifications and fertility in stal-lions: 66 cases (1987–1988). J Am Vet Med Assoc 1990;197: 389 –94.
[24] Karabinus DS, Evenson DP, Jost LK, Baer RK, Kaproth MT. Comparison of semen quality in young and mature Holstein
bulls measured by light microscopy and flow cytometry. J Dairy Sci 1990;73:2364 –71.
[25] Leroy-Martin B, Tanguy B, Lorthioir M, Soulez B, Hermand E. Analysis of the results obtained in fertilization in vitro accord-ing to the degree and type of teratospermia. J Gynecol Obstet Biol Reprod 1994;23:373–7.
[26] Thurston LM, Watson PF, Holt WV. Sources of variation in the morphological characteristics of sperm subpopulations assessed objectively by a novel automated sperm morphology analysis system. J Reprod Fertil 1999;117:271– 80.
[27] Davis RO, Gravance CG. Standardization of specimen prepa-ration, staining, and sampling methods improves automated sperm-head morphometry analysis. Fertil Steril 1993;59:412–7. [28] García-Herreros M, Aparicio IM, Barón FJ, García-Marín LJ, Gil MC. Standardization of sample preparation, staining and sampling methods for automated sperm head morphometry analysis of boar spermatozoa. Int J Androl 2006;29:553– 63. [29] Maree L, du Plessis SS, Menkveld R, van der Horst G.
Mor-phometric dimensions of the human sperm head depend on the staining method used. Hum Reprod 2010;25:1369 – 82. [30] Gago C, Pérez-Sánchez F, Yeung CH, Tablado L, Cooper TG,
Soler C. Morphological characterization of ejaculated cynomol-gus monkey (Macaca fascicularis) sperm. Am J Primatol 1999; 47:105–15.
[31] Herreros M, Barón FJ, Aparicio IM, Santos AJ, García-Marín LJ, Gil MC. Morphometric changes in boar spermatozoa induced by cryopreservation. Int J Androl 2008;31:490 – 8. [32] Gil MC, García-Herreros M, Barón FJ, Aparicio IM, Santos AJ,
García-Marín LJ. Morphometry of porcine spermatozoa and its functional significance in relation with the motility parameters in fresh semen. Theriogenology 2009;71:254 – 63.
[33] Gagliardi C, Myers L, Kubisch HM. Postthaw survival of rhesus macaque sperm: variation in the response of individual males to different freezing protocols. Am J Primatol 2008;70:1093– 6.
[34] Macleod IC, Irvine DS. The predictive value of computer-assisted semen analysis in the context of a donor insemination programme. Hum Reprod 1995;10:580 – 6.
[35] Gergely A, Kovanci E, Senturk L, Cosmi E, Vigue L, Huszar G. Morphometric assessment of mature and diminished-maturity human spermatozoa: sperm regions that reflect differences in maturity. Hum Reprod 1999;14:2007–14.
[36] Mburu DN. Maturation-related changes in distribution of lectin receptors in baboon (Papio anubis) spermatozoa during epidid-ymal maturation. Arch Androl 1999;42:199 –203.
[37] Garrett C, Liu DY, McLachlan RI, Baker HW. Time course of changes in sperm morphometry and semen variables during testosterone-induced suppression of human spermatogenesis. Hum Reprod 2005;20:3091–100.
[38] Cantú JM, Rivas F, Hernández-Jáuregui P, Díaz M, Cortés-Gallegos V, Vaca G, et al. Meiotic arrest at first spermatocyte level: a new inherited infertility disorder. Hum Genet 1981;59: 380 –5.
[39] Fitzpatrick JL, Evans JP. Reduced heterozygosity impairs sperm quality in endangered mammals. Biol Lett 2009;5:320 –3. [40] Lanzendorf SE, Gliessman PM, Archibong AE, Alexander M, Wolf DP. Collection and quality of rhesus monkey semen. Mol Reprod Dev 1990;25:61– 6.
[41] Morrell JM, Küderling I, Hodges JK. Influence of semen col-lection method on ejaculate characteristics in the common mar-moset,Callithrix jacchus. J Androl 1996;17:164 –72. [42] Giblin PT, Poland ML, Moghissi KS, Ager JW, Olson JM.
Effects of stress and characteristic adaptability on semen quality in healthy men. Fertil Steril 1988;49:127–32.
[43] Shayu D, ChennaKesava CS, Soundarajan R, Rao AJ. Effects of ICI 182780 on estrogen receptor expression, fluid absorption and sperm motility in the epididymis of the bonnet monkey. Reprod Biol Endocrinol 2005;3:3–10.