Second line optional lorem ipsum B Subhead lorem ipsum, date quatueriure
Decisions at the crossroads
Capital market trends and
their implications on Asia
February 2015Foreword
In 2014, capital markets institutions finally inched toward steadier ground. Global investment banking fees reached a total of USD 69 billion during the first nine months of 2014, the strongest since 2007. Out of this number, the Asia Pacific region (excluding Japan) accounted for USD 9 billion (13%) of the pie, surpassing its previous record in 2011. Furthermore, the Asia Pacific debt capital markets reached record volumes of USD 894 billion, an increase of 22% from the first nine months of 2013.1
Yet this upbeat narrative was tempered by a perfect storm of macro events including lower than expected growth in emerging markets, declining commodity prices and the strengthening dollar with the spectre of rising rates. While the end of the US Federal Reserve’s quantitative easing programme brings worries of rate hikes, the unexpected injection of an additional stimulus by the Bank of Japan has caught many by surprise.
In this paper, we focus our attention on the current state of capital markets in Asia and assess how the region compares to the rest of the world. To better understand the developments in Asia, we have also identified five mega trends for discussion. In this constantly evolving market, it is imperative for capital markets players to keep abreast of not only industry-specific trends but also the mega consumer and institutional trends shaping the region. This paper concludes by positing a number of implications that capital markets firms should consider for their businesses, as well as the capabilities that they will need to develop going forward.
As the region changes with consumer and institutional demands becoming more sophisticated, the winners will be those who can position themselves ahead of these trends.
I would like to thank Arnub Ghosh, Joyce Mak and others in the Deloitte Southeast Asia who supported the development of this report.
Mohit Mehrotra Deloitte Consulting
The current state of capital
markets in Asia
22 18 5 United States Europe Asia ex-Japan United States Europeand others
USD 633
Trillion
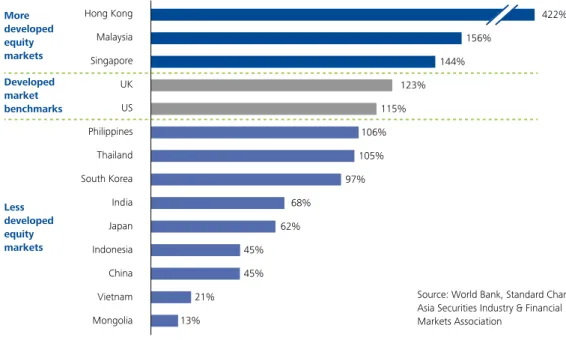
Asia ex-Japan Japan 8% 7% 35% 50% Hong Kong Malaysia Singapore UK US Philippines Thailand South Korea India Japan Indonesia China Vietnam Mongolia 13% 21% 45% 45% 62% 68% 97% 105% 106% 115% 123% 144% 156% 422% More developed equity markets Developed market benchmarks Less developed equity marketsFigure 1: Market capitalisation as a percentage of GDP (2012)
Figure 2: Outstanding corporate bonds (USD trillion, 2014) Figure 3: OTC derivatives notional outstanding (2012)
Source: World Bank, Standard Chartered, Asia Securities Industry & Financial Markets Association
Source: World Bank, Standard Chartered, Asia Securities Industry & Financial Markets Association
Source: World Bank, Standard Chartered, Asia Securities Industry & Financial Markets Association
Asia lags in capital market development with the Asian equity, debt and derivatives markets relatively smaller in size when compared to other markets such as the US or Europe. With the exception of Hong Kong, Malaysia and Singapore, most other countries in Asia have fewer listed companies and lower market capitalisation relative to GDP as compared to developed market benchmarks (Figure 1). Furthermore, the Asian corporate bond market is only a fraction of that in the US or Europe (Figure 2) as Asian corporates continue to rely heavily on bank funding, resulting in limited demand for corporate bonds. In the derivatives market, over-the-counter (OTC) trading accounts for the largest component in Asia, but its value is significantly smaller when compared to other global markets (Figure 3).
Figure 4 below illustrates the disproportionate distribution of banking fees across the regions. With a less developed capital market, Asia Pacific excluding Japan only captured 13% of the global investment banking fees.
Figure 4: Investment banking fees (Q1-Q3 2014)
Americas USD 37 billion 54% EMEA USD 20 billion 29%
Asia Pacific ex-Japan USD 9 billion 13%
Japan USD 3 billion 4%
Source: Thomson Reuters
Although Asia's share of the pie in capital markets is significantly smaller when compared to other regions, it is important to acknowledge the growth potential of the Asian market. While the US and UK dominates capital market investments, there seems to be increasing attention on the developments of capital markets in Asia as the region is home to many emerging economies that are growing at unprecedented rates. Consequently, many companies are attracted to invest in Asia with some businesses relocating their headquarters to this part of the world. The onus is on the governments to set up sustainable infrastructure to support the growth. When done right, enormous opportunities are available.
Many Asian governments have recognised the opportunities and introduced various initiatives to further capital markets developments. In the equity markets, stock exchanges were established in the growing economies while initiatives in the bond markets are focused on fostering regional integration.
Initiatives to develop equity markets2 • Cambodia: Stock exchange established in 2012 • China: Qualified foreign institutional investor
programme launched in 2003. Shanghai-Hong Kong stock connect scheme launched in late 2014 • Laos: Stock exchange established in 2010
• Thailand, Malaysia and Singapore: ASEAN Trading Link launched in 2014 to create a single access point for cross-border trading
• Vietnam: Stock exchange established in 2005
Initiatives to develop bond markets2
• Asian Bond Markets Initiative (2002): Encouraged local currency bond market development and increased diversity of bonds and issuers
• Asian Bond Funds 1 & 2 (2003-2005): Invested pooled savings in the bond markets to reduce market barriers for investors and improve liquidity in sovereign bond markets
• New Asian Bond Markets Initiative Roadmap (2008): Addressed specific issues in local bond market development
• Bond Market Forum (2010): Promoted harmonisation of market practices and regulations to facilitate cross-border bond issuance
• Credit Guarantee and Investment Facility (2010): Credit enhancement promoted larger and cross-border corporate bond issues
• ASEAN Economic Community (2015): Single market production base to promote regional integration of trade, services and capital markets
As a result of the initiatives, Asian capital markets across asset classes have been rapidly developing. Equity issuance in Asia has grown at an impressive pace since the financial crisis (Figure 5) and bond issuances repeatedly broke record highs over the past couple of years (Figure 6). In the derivatives market, the growth in Asia is evident with increased trading volumes (Figure 7).
2 World Federation of Exchanges; Deutsche Bank
0 200 400 600 800 1,000 1,200 0 20 40 60 80 100 120 140 160 180
Equity issue (USD billion) (left hand side)
Number of issues (right hand side) Figure 5: Asia quarterly equity issuance
Global Financial Crisis
2007 2008 2009 2010 2011 2012 2013 2014
Source: Thomson Financial, Futures Industry Association
0 200 400 600 800 1,000 0 50 100 150 200
Figure 6: Asia quarterly bond issuance
Bond issue (USD billion) (left hand side)
Number of issues (right hand side)
2007 2008 2009 2010 2011 2012 2013 2014
Source: Thomson Financial, Futures Industry Association
Figure 7: Volume of exchange-traded futures and options in Asia (billions of contracts)
2007 2008 2009 2010 2011 2012 2013 Volume declined in 2011 - 2013 due to Kospi’s deliberate campaign to curb retail speculation. Trading volume actually rose 13% from 2012 - 2013 if the Kospi contract is excluded
+9% 4.3 5.0 6.2 8.9 9.8 7.5 7.3
India 306 (22%) $3.3K Thailand 26 (39%) $6.9K Singapore 2 (36%) $54.3K Indonesia 71 (25%) $5.5K Vietnam 28 (28%) $3.1K Taiwan 10 (43%) $26.4K Hong Kong 4 (54%) $46.7K China 550 (40%) $9.9K S. Korea 22 (43%) $33.3K Japan 62 (50%) $32.2K Population aged 50+ in million (% of total population) Estimated spending per capita by 2025 in USD Malaysia 8 (23%) $15.3K Cambodia 4 (20%) NA
Mega trends and opportunities
While the global economic recovery lent some stability to the capital markets, they continue to be complex and dynamic in nature, making it essential to keep a constant watch on developments in order to gain insight into some of the most important trends shaping these markets. Asia in particular is set to witness a significant transition with changes in population demographics, the rise of digital natives, proliferation of a sharing economy, and localisation.
Ageing Asia
In Asia, the number of people aged 50 years old and above is expected to grow dramatically over the next 10 years. Across all 12 of its key markets, this group is expected to grow 42% between 2014 and 2025 to reach over 1 billion people, and with significant purchasing power. Figure 8 illustrates the estimated spending per capita across the different markets in Asia.
Figure 8: Ageing population statistics in Asia projected till 2025
Working women
As society progresses, it experiences greater gender equality and increased employment opportunities for women. With more women in Asia entering the workforce, there will be a narrowing of gender gaps in labour force participation between men and women.
Figure 9: Labour force participation gender gaps (%, 2006-2027)
Legend 2006 2017 2027 8 48 24 12 34 17 9 23 12 6 27 14 7 5 3 1 4 2
China India Indonesia Korea Philippines Vietnam
166 169 80 86 Europe % increase in working women +2% +7% North America Legend 2007 2017 700 791 +13% Asia
Notably, the number of working women in Asia is growing at a faster rate as compared to other regions such as Europe and North America. The gender gaps in labour force participation are expected to decrease by 75% by 2027. Figure 10: Female labour force (million, 2007-2017)
Source: ILO, Goldman Sachs, Deloitte Analysis
Digital natives
We are now living in an era of digitisation, inhabited by the digital natives of Generations Y and Z. Generation Y is the first cohort to grow up with the constant presence of computers at home and with access to over 250 cable television channels. On the other hand, Generation Z enjoys high access to technology from birth and is even more accustomed to the lifelong use of communication and media technologies such as the Internet, instant messaging and mobile. As they come of age, these two demographic cohorts are likely to demand ubiquitous access to digital products and services. With Generation X becoming increasingly digitally-savvy as well, the majority of the population is expected to be technologically-adept by 2025.
Figure 11: Population and consumer spending projections
1.4Bn
China
*Baby boomers: Before 1960s, Gen X: 1960s - 1980, Gen Y: 1980s - 2000, Gen Z: After 2000s
India Indonesia 1.3Bn 0.3Bn Baby boomers* (60+) Gen X* (40-59) Gen Z* (0-19) Projected population size and consumer spending, 2020
(% of population, consumer spending USD)
Total spending (USD) Gen Y* (20-39) $1.7Tn $4.7Tn $3.5Tn $1.4Tn 18% $0.8Tn 30% $2.6Tn 30% $2.2Tn 22% $1.1Tn 12% $0.2Tn 25% $0.5Tn 31% $0.4Tn 32% $0.1Tn 10% $0.7Tn 23% $1.6Tn 30% $0.9Tn 22% $0.2Tn
Generation Y has a projected population of 1.2 billion people by 2020, the largest segment in Asia. They are also estimated to account for USD 3.5 trillion of total spending. However, Generation Y is found to be sceptical of and lacking trust in the financial services sector, posing a unique set of challenges in serving them.
Sharing economy
The sharing economy refers to an ecosystem built around the sharing of resources. It includes the shared creation, production and consumption of goods and services by different people and organisations. Some examples of businesses in the sharing economy include crowdsourcing companies like Kickstarter and indiegogo; transportation applications such as Uber and Grabtaxi; and hospitality sites like Airbnb and PandaBed.
The sharing economy is disrupting traditional business models, with 78% of consumers in Asia willing to participate in it. With the help of technology and sharing platforms, consumers are increasingly looking to fulfill their needs by purchasing good and services from other consumers, cutting traditional businesses out of the equation in most instances.
Localisation
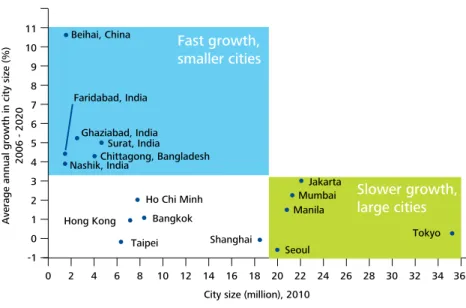
As smaller cities grow at a faster rate than big cities, there will be over 240 cities in Asia with more than 1 million people each by 2020, with China and India accounting for 83% them. The estimated number of cities excludes the 100 new ‘smart cities’ that India plans to build by 2022.3
Figure 12: Asia cities growth rate and size
0 2 4 6 8 10 12 14 16 18 20 22 24 26 28 30 32 34 36 11 10 9 8 7 6 5 4 3 2 1 0 -1 Beihai, China Faridabad, India Ghaziabad, India Nashik, India Hong Kong Ho Chi Minh Bangkok Taipei Shanghai Manila Mumbai Jakarta Tokyo Seoul Surat, India Chittagong, Bangladesh
City size (million), 2010
Average annual growth in city size (%)
2006 - 2020
Slower growth,
large cities
Fast growth,
smaller cities
Source: UN Data, City Mayors Foundation, Deloitte Analysis
Capturing opportunities
To prepare for the evolution, capital markets firms need to assess their abilities to respond to opportunities emerging from these mega trends. The following are some focus areas that firms should consider evaluating.
Technology dynamics
Technology will enable a new era and investments in it will support growth, customer experience and security. Firms will start to recognise the benefits of integrating fragmented platforms and leveraging on unstructured data for real-time insights. Specifically, a fully integrated mobile solution may be the key retail differentiator.
Competition and markets
Mergers and acquisitions could be spurred by the need for new capabilities and network with large firms requiring specialisation and new solutions, as well as small firms facing compliance pressure. Moreover, the change in geographical focus may also require network ramp up.
Clients and products
A shift in the consumer landscape provides opportunities for firms to differentiate. For instance, the emergence of new segments such as the elderly and working women will likely require firms to explore new ways to serve them. Firms can also leverage on analytics to improve segmentation and highlight cross selling opportunities. It is expected that fee-based products, especially in the wealth management sector, will remain a focus moving forward.
Policy, regulations and risks
The policy-driven market is now the new norm. We have seen several policies been introduced in recent years such as the Bank of Japan’s increase in asset purchase amidst the end of the US Federal Reserve’s quantitative easing programme, as well as the mega-pension to ramp up investments in stocks and foreign bonds. The highly correlated equities returns, driven by government support, have seen investors moving from active to passive investments. Firms are also increasing their efforts to push for higher regulatory ratings and enhance management and governance of cyber threats.
Financial management
Chief Financial Officers are seen taking on a more strategic role in improving capital efficiency as corporates are under pressure to “unstash” record levels of cash equivalent to 9% of GDP in Japan. One way to do so is to deploy capital management tools at the business and transaction levels.
Organisational effectiveness
In view of the uncertain and rapidly changing environment, it is important that organisations foster agility in order to respond. Firms can do so by focusing on strategies, ecosystem and minds. Furthermore, it may be worthwhile to explore the industrialisation of processes to unlock new sources of efficiency.
Potential implications for
consideration
Having identified the key trends impacting Asia, capital market firms should consider the implications that they pose and review their readiness to address these challenges. The following are some actionable takeaways for consideration:4
• Firms need to reassess their abilities to concurrently serve the four generations of end-consumers and develop capabilities if required. The focus should be on the development of “investor continuum” plays given that many markets are undergoing inter-generational wealth transfer;
• With the rise of women and the roles they play in the Asian workforce, firms must develop capabilities to serve a diversified investor base. This will help develop a segmented play to allow greater participation of women in the retail investor community;
• The small and medium enterprises (SMEs) group is a significant market in Asia with more than 50 million SMEs accounting for up to 60% of GDP in selected Asian countries. It is important that firms develop solutions for this specific sector, as well as greater capital market access in order for them to play a key role in Asia’s growth story; • Opportunities from intra-Asia trades of over USD 3 trillion have surpassed trade flows between Asia and the west.
This results in increased demand for local currency-based capital market solutions to facilitate and streamline intra-regional trade; and
• With the growth in population of digital natives, there is a need for firms to invest in solutions and new technology platforms to be ahead in the digital era.
Firms that are able to find a firm footing by positioning themselves ahead of these trends will enjoy a significant head start in this dynamic and fast evolving region. After all, success always comes to those who prepare for the opportunity.
Find out more
Ho Kok Yong SEA FSI Leader +65 6216 3260 kho@deloitte.com Yacin Mahieddine SEA FSI Consulting Leader +65 6535 0220
ymahieddine@deloitte.com Mohit Mehrotra
Executive Director, Consulting +65 6535 0220
momehrotra@deloitte.com
Contributors
Mohit Mehrotra
Executive Director, Consulting Arnub Ghosh
Manager, Consulting Joyce Mak
Consultant, Consulting
Deloitte refers to one or more of Deloitte Touche Tohmatsu Limited, a UK private company limited by guarantee (“DTTL”), its network of member firms, and their related entities. DTTL and each of its member firms are legally separate and independent entities. DTTL (also referred to as “Deloitte Global”) does not provide services to clients. Please see www.deloitte.com/sg/about for a more detailed description of DTTL and its member firms.
Deloitte provides audit, consulting, financial advisory, risk management, tax and related services to public and private clients spanning multiple industries. With a globally connected network of member firms in more than 150 countries and territories, Deloitte brings world-class capabilities and high-quality service to clients, delivering the insights they need to address their most complex business challenges. Deloitte’s more than 210,000 professionals are committed to becoming the standard of excellence.
About Deloitte Southeast Asia
Deloitte Southeast Asia Ltd – a member firm of Deloitte Touche Tohmatsu Limited comprising Deloitte practices operating in Brunei, Cambodia, Guam, Indonesia, Lao PDR, Malaysia, Myanmar, Philippines, Singapore, Thailand and Vietnam – was established to deliver measurable value to the particular demands of increasingly intra-regional and fast growing companies and enterprises.
Comprising over 270 partners and 6,300 professionals in 24 office locations, the subsidiaries and affiliates of Deloitte Southeast Asia Ltd combine their technical expertise and deep industry knowledge to deliver consistent high quality services to companies in the region. All services are provided through the individual country practices, their subsidiaries and affiliates which are separate and independent legal entities.
Disclaimer
This communication contains general information only, and none of Deloitte Touche Tohmatsu Limited, its member firms, or their related entities (collectively, the “Deloitte network”) is, by means of this communication, rendering professional advice or services. No entity in the Deloitte network shall be responsible for any loss whatsoever sustained by any person who relies on this communication.