HSIN JU LEE
________________________________
Abstract
This master dissertation use the evaluative purposes and e-metrics found in the literature review to examine the appropriateness of applying the web analysis tool, Google Analytics (GA), for the evaluation of digital libraries. The final aim of the study is to provide a useful guideline based on its insightful discussion over the possibilities and limitations of GA for digital libraries.
The dissertation is structured into five chapters. First chapter introduces the research background, research questions, research motivation, possible limitations and methodologies.
Chapter two is the review of the literature as well as the seven case studies. The purposes and metrics found through those reviews are presented as a table in the end of chapter two.
Chapter three presents the introduction of GA. The introduced aspects include the technology of GA, its metrics definitions, its report interface and a discussion over its business-oriented nature. Chapter four analyzes the possibilities and discusses the limitations of applying Google Analytics to a digital library environment. Such analysis is carried out by using the eleven evaluative purposes grouped in three evaluative themes.
In chapter five, using the comprehensive literature review as well as the analysis on Google Analytics as a digital library evaluative tool, the paper has concluded that the analytics tool has more possibilities than limitations to offer.
Acknowledgement
I am indebted to many people for their generous help throughout my course of finishing this dissertation. First and foremost, I would like to thank my supervisor, Ragnar Nordlie of Oslo
University College. It is his comforting words and insightful guidance that I can move accordingly to finish the work.
I would also want to express my grateful thanks to my internship mentor Marcin Werla in Poznan Supercomputing and Networking Center. It was him who first introduced me to the world of web analysis and it is with his generosity that I could have the access to another Google Analytics reports for the past six months.
My special thanks go to all my friends in Norway and around the world. Especially Asia Michalska, Katharina Osterholt, Jasper Ipskamp and his family, Miraj Haq, Rung Hsiah, Anne Ragnhild Oijord, Tone Kaasboll Andresen, all my classmates and professors from DILL. One sincere thanks to Brett Philips. Thank you for taking the precious Sunday afternoon to help me with my work.
I would also like to thank my family in Taiwan. Especially my sister May Lee who has always been so wittily critical and brutally honest, yet supportive to all my ideas and thoughts. My eternal love goes to my parents, I hope your little girl will make you even prouder one day.
Last but absolutely not the least, my biggest thanks to my best love and friend, Dawid Kowalski. Saying thank you is not enough for you, your family and friends. I believe I will have the time to return the favor to you.
Table of Content
Abstract ... 1 Acknowledgement ... 2 Table of Content ... 3 1. Introduction ... 5 1.1 Research Background ... 51.2 Motivations and Research Problem ... 6
1.3 Research Questions and Methodologies ... 6
1.4 Potential Limitations of the Research ... 7
1.5 Structure of the Dissertation ... 7
2. Literature Review ... 8
2.1 Digital Library Evaluation ... 8
2.1.1 Purposes of Digital Library Evaluation ... 8
2.1.2 Methods of Digital Library Evaluation ... 10
2.2 Digital Library Statistics ... 12
2.2.1 Methods of Collecting Online Usage Data ... 13
2.2.2 Web Analysis in Digital Libraries ... 14
2.2.3 Characteristics of Transaction Log Analysis ... 15
2.3 Review of Researches and Cases ... 20
2.3.1 ICOLC Guidelines ... 21
2.3.2 ISO Standards and EQUIONOX Project ... 22
2.3.3 ARL E-Metrics Project ... 25
2.3.4 NISO Z 39.7 ... 28
2.3.5 COUNTER ... 30
2.3.6 National Science Digital Library ... 32
2.3.7 CIBER Deep Log Analysis ... 44
2.4 Summary of Researches and Cases Studies ... 52
3. Introduction of Google Analytics ... 57
3.1 Characteristics of JavaScript Tagging ... 57
3.2 Implementation of GA ... 58
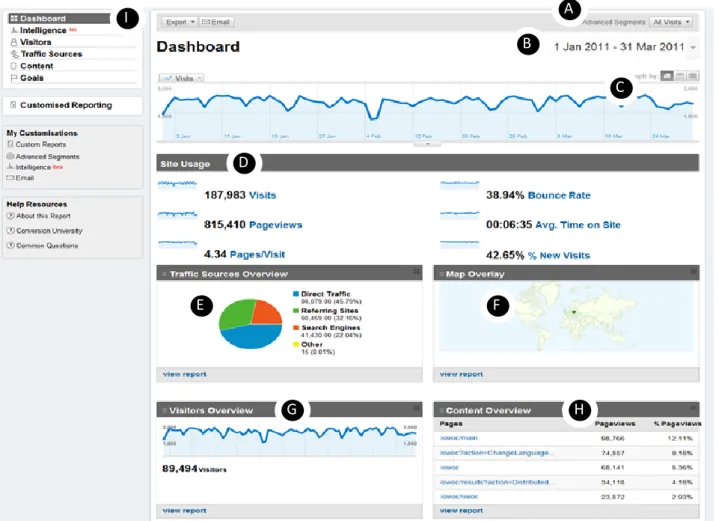
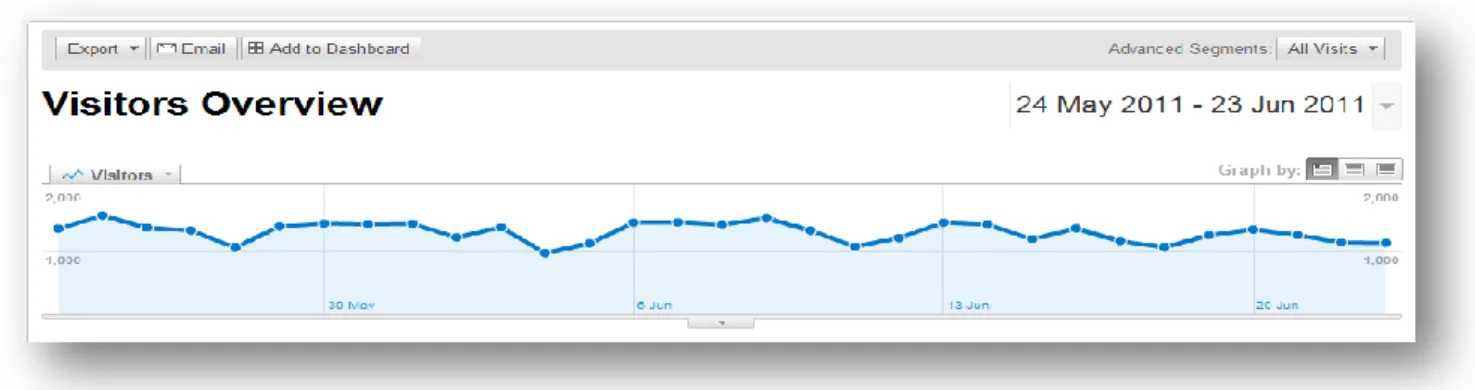
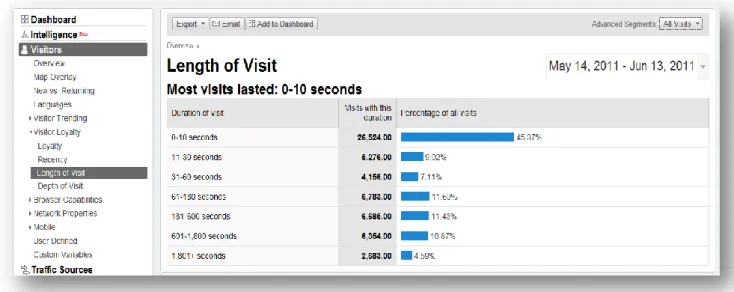
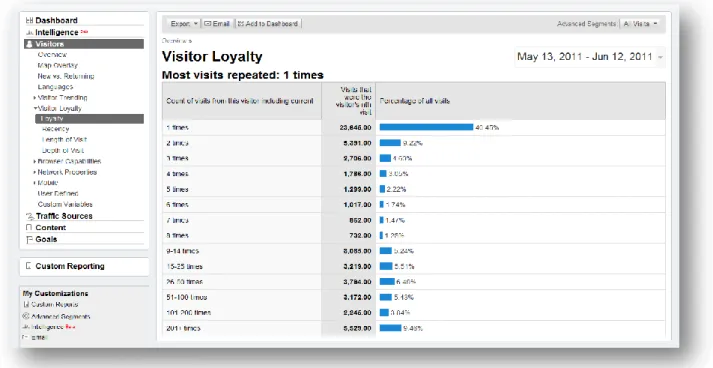
3.3 Reporting Interface of GA ... 60
3.4 Metircs Definitions of GA ... 63
3.5 Marketing and Business Oriented ... 67
4.1 Theme # 1 – Inferring User Satisfaction ... 70
4.1.1 Purpose #1 - Using Basic Metrics to Infer User Satisfaction ... 71
4.1.2 Purpose #2 – Tracking Actions to Infer User Satisfaction ... 76
4.1.3 Purpose #3 – Using Retention to Infer User Satisfaction ... 81
4.1.4 Purpose #4 – Using Triangulation to Further Investigate... 86
4.2 Theme # 2 – Assessing Impact and Performance ... 87
4.2.1 Purpose #5 – Assessing Impact on Usage Behaviors ... 88
4.2.2 Purpose #6 – Assessing Impact on User Groups ... 94
4.2.3 Purpose #7– Assessing Impact of “Brand Awareness” ... 100
4.2.4 Purpose #8 – Assessing Performance from Other Channels ... 106
4.3 Theme # 3 – Assisting Decision Making ... 114
4.3.1 Purpose #9 – Assisting Decision Making on User Interface ... 115
4.3.2 Purpose #10 – Assisting Decisions on Collection Content ... 124
4.3.3 Purpose #11 – Assisting Reporting of Different Levels ... 132
5. Research Conclusions and Future Development ... 139
5.1 Research Conclusions ... 139
5.2 Future Development ... 141
1.
Introduction
1.1
Research Background
By the official definition of Web Analytics Association (WAA, 2011), web analytics is the
measurement, collection, analysis and reporting of internet data for purposes of understanding and optimizing web usage. Web analytics, or web analysis, may seem far-fetched to digital libraries in terms of terminology, but in truth the industry has been conducting activities with similar, if not exactly the same evaluative purposes under different names with different vocabularies.
Libraries have been gathering offline statistics such as the number of visitors, circulation data, average age of books in the collection, quantity of volumes and the number of reference questions answered long before the creation of computers and internet (White & Kamel, 2006). Since the birth of digital libraries have brought a new need for data, transaction log records and users’ online activities information were brought into focus. And ever since then, a mixture of initiatives,
projects or even a creation of a specific analyzing method have been developed by the various digital library communities. Efforts have been put into standardizing the library e-metrics
measurements and researching the potential use of such data. Besides library science, information scientists, computer scientist, funded research granters, human-computer interaction (HCI)
scientists and especially business people are all equally interested in the subject (Franklin, Kryillidou & Plum, 2008).
Among those, the world of e-commerce has pick up its speed for the application of web analysis to generate more revenue and to learn more about its customer needs. More importantly, through years of application and testing, a model of how to apply such technique to create the maximum benefits for the commercial industry has been strongly formed and improved continuously. With regret, such evolution has not been made for digital libraries. As Khoo, Buchanan &
Cunningham (2009) reported, due to issues such as personnel and financial constraints, technical barriers or lack of necessary expertise to develop a robust instruction, web analysis in libraries is often limited with the goals to just ‘proof of concept’ test instead of prescribing user motivations, or other high-effort evaluation purposes.
1.2
Motivations and Research Problem
The introduction of a free web analysis tool, Google Analytics (GA), has revolutionized the online marketing and assessment industry. Prior to the use of GA, web analysis was the responsibilities for IT departments. At this time, most of the company resources were devoted into making the raw data readable, or paying a high annual fee to the web analysis provider. With the release of GA, marketing and business stakeholders are starting to manipulate the statistics and twist the data to draw insights themselves. In addition, most of the resources have been reallocated to dedicated business intelligence analysts.
Looking from the past, transaction log analysis indeed has its vital importance for digital libraries. The online usage of data has been proven useful to help digital libraries in demonstrating success, justifying expenditures, understanding user behaviors and assisting strategic planning. With the possible usage of a free tool that comes with ready-made tables and charts for the same purpose, many digital libraries were also eager to try GA for their digital library websites.
However, the application of GA in a digital library environment is still in its infancy. Without a robust debate on whether GA is indeed suitable for the industry, digital libraries are lacking an actionable guidelines on utilizing such tool. For this reason, it is the finding of this report that the investigation of possibilities and limitations of GA for digital library evaluation is essential in helping library communities to leverage the value of web analysis and maximize the potential of GA.
1.3
Research Questions and Methodologies
To examine the appropriateness of adapting GA as an evaluative tool for digital libraries evaluations in the real world, the following research questions would need to be answered,
What is the purpose of conducting web analysis evaluations in digital libraries? What are the e-metrics used to conduct such evaluations in digital libraries?
What are the advantages and disadvantages of using GA for digital library evaluation?
To make the examination realistic and constructive, the research will be first carried out through a comprehensive literature review on past research and cases of web analysis found in digital libraries. Using the most commonly seen evaluative purposes and metrics in the literature review,
the report will present a theoretical discussion on the abilities and restrictions for using GA as an evaluative tool within the digital library context.
1.4
Potential Limitations of the Research
The study on appropriateness of GA in this dissertation is based on the author’s understanding of the tool and an internship experience in Poznan Supercomputing and Networking Center (PSNC). Since it is a conceptual discussion and the author’s actual experience is also limited to one specific digital library system, there is a high likelihood that the scenario and solution provided is not applicable to all situations. For the purpose of this dissertation, it is also not the intention of the author to be comprehensive on the subject matter.
In addition, the possibilities and limitation mentioned in this paper are based on the current version of GA. With the advance of technology, as well as the possible adjustment of GA functions in the future, one should always reconfirm with current best practice before applying findings.
1.5
Structure of the Dissertation
This dissertation is structured into five chapters.
Chapter one briefly presents the research background, motivations, statement of research problem, research questions, research methodologies, limitations and structure of the paper. Chapter two is a comprehensive review of the available literatures and case studies related to digital library evaluations. The focal point is mostly connected to the evaluation conducted using web analysis.
For building the necessary background for analysis, chapter three is the introduction of the evaluative tool in discussion – Google Analytics.
This chapter is devoted to the examination of the abilities and limitations of GA for digital libraries, using eleven evaluative purposes grouped in three evaluative themes.
Last but not the least, chapter five summaries the research findings and suggests some of the possible direction for the digital libraries in the future.
2.
Literature Review
2.1
Digital Library Evaluation
According to Khoo and Giersch (2009), digital libraries are composed of a wide range of social, technological, organizational and other phenomena, embedded in a variety of external social, political, economic and organizational contexts. They can be modeled as sociotechnical systems, comprised of many components linked in complex and mutually constitutive ways (Bishop et al., 2003). For the nature of its complexity, Marchionini (2000) even stated that evaluating digital libraries is a bit like judging how successful is a marriage.
Based on reviews of literature, most researchers interested in the evaluation of digital libraries usually narrow down the scale of studies by focusing on one or two specific themes, as holistic approach is often too difficult and too overwhelming. For example, Marchinini (2000) concentrated on studying the impact of digital libraries, while others studied IR system performance or HCI (Saracevic & Covi, 2000) (Chowdhury & Chowdhury, 2003), outcomes assessment (Tsakonas & Papatheodorou, 2009), quality of services (Kyrillidou et al., 2009) or usability and users’ information-seeking behaviors (Xie, 2008) (Nicholas, 2009) (Jeng, 2009), etc.
Generally speaking, aspects of digital libraries evaluations could include the matter of internal processes, levels and quality of service, library impact on institutional goals, quality of collection, organization of resources, metadata, cost-benefit analysis, cost-effectiveness analysis,
performance evaluation, interactivity, functionality, accessibility and usability (Wright & White, 2007)(Jeng, 2009).
2.1.1
Purposes of Digital Library Evaluation
Stated by Saracevic (2009), evaluation can be done for the sake of gathering and learning the knowledge, insight, performance or value of digital libraries. But more pragmatically as he pointed out, evaluation could and should also be done to gather a rational and factual base for improving digital libraries, in terms of becoming better, more effective, more efficient, easier to use. Similarly, Garoufallou et al. (2009) also mentioned the necessity of digital library evaluations by stated that the need for evaluation is an inherent characteristics of human beings as they are engaged in a
continuous effort to make things around them better.
Another rationale for conducted evaluation was posted by Reeves et al. (2005). They believe the only defensible rationale for evaluation is to inform decision making as anyone involved with digital libraries must make decisions on a regular basis. And evaluation should be conducted to provide decision makers with the timely, accurate information they need to make the decisions. Though better information does not guarantee the best decisions will be made, they pointed out
evaluation is still crucial in providing decision makers with information needed to make the best possible decisions. This importance of supporting decision making was also mentioned by Wright and White (2007) in the ARL Spec Kits. They argued that in order to make decisions and to improve customer service, library staff need to assess operations by collecting, interpreting and using data. More specific and defined purposes for digital library evaluation were articulated by Covey (2002) in details in an article structured according to different types of assessment techniques (surveys, focus groups, user protocols, and transaction log analysis). Under each technique, Covey discussed the definition, application, strengths, weaknesses, purposes and functions in library evaluation for each method.
Following are the purposes listed in the literature (Covey, 2002), Assessment
Technique Purposes
Surveys
• to assess patterns, frequency, ease, and success of use
• to assess user needs, expectations, perspectives, priorities, and preferences for library collections, services, and systems
• to assess user satisfaction with vendor products, library collections, services, staff, and Web sites
• to assess service quality
• to assess shifts in user attitude and opinion
• to assess relevance of collections or services to the curriculum
Focus Groups
• to clarify or explain factors influencing survey responses, for example, to discover reasons for undergraduate students’ declining satisfaction with the library
• to determine questions to ask in survey questionnaires, tasks to be performed in protocols, and the vocabulary to use in these instruments • to identify user problems and preferences related to collection format and
system design and functionality
library Web site differ across discipline and user status • to confirm user needs for more and better library instruction
• to confirm that faculty are concerned that students cannot judge the quality of resources available on the Web and do not appreciate the role of librarians in selecting quality materials
• to target areas for fundraising
• to identify ways to address concerns in grant-funded projects
User Protocols
• to identify problems in the design, functionality, navigation, and vocabulary of the library website or user interfaces to different products or digital collections
• to assess whether efforts to improve service quality were successful
• to determine what information to include in a FAQ database and the design of access points for the database
Transaction Log Analysis (Local Server)
• to identify user communities & patterns of use • to project future needs for services and collections • to assess user satisfaction
• to inform digital collection development decisions
• to inform the redesign and development of the library Web site
• to assess whether redesign of the library Web site or digital collection has had any impact on use
• to assess whether providing additional content on the library website site or digital collection has any impact on use
• to target marketing or instruction efforts
• to assess whether marketing or instruction has any impact on use • to drive examinations of Web page maintenance requirements • to inform capacity planning and decisions about platform • to plan system maintenance
• to allocate human and financial resources
Transaction Log Analysis (Vendor- Supplied)
• to help secure funding for additional e-resources from university administrators
• to inform decisions about what subscriptions or licenses to renew or cancel • to inform decisions about which interface(s) to keep
• to determine how many ports or simultaneous users to license • to assess whether instruction has any impact on use of an e-resource • to determine cost per-use of licensed e-resources
Reviews from the digital library evaluation literature pointed out various kinds of evaluation methods and instruments for collecting evaluative information. For example the use of surveys, structured interviews, focus groups, questionnaires, experiments, exploratory observations, transaction log analysis, case studies, economic analysis or even HCI studies, and the employment of think-aloud protocol, user diaries and other instruments (Saracevic, 2004).
While conventional classification separates quantitative and qualitative evaluations, worth
mentioning is that the distinction between definitions of “quantitative” and “qualitative” lie within the data generated in the evaluation process, rather than judging from the adopted methodologies used. Garbarino and Holland (2009) clarified the terminology by stating that quantitative data often are presented in the form of numbers while qualitative tends to produce data that are presented in prose of textual forms.
By the definition from the same authors, Garbarino and Holland (2009), the former could be aggregated and analyzed to describe and predict relationship whereas the latter could help to probe and explain those relationships and to explain contextual differences in the quality of those relationships.
In practice, triangulation across data sets, which in general involves relating findings from more than one approach, is often used in evaluations for developing a richer and more holistic
understanding on not only the phenomena but also the explanations (Mackay and Fayard, 1997) (Blandford & Bainbridge, 2009).
Quantitative and qualitative data are therefore intertwined in a co-dependent sense. A clear cut of quantitative outcome measure is flawed by the failure to establish the importance or relevance of the outcome indicator (Reeves, Apedoe & Woo, 2005). On the other hand, a qualitative analysis sometimes needs quantitative testing with larger sample group later in order to examine the variables it first identified (Monopoli, 2009).
Studies conducted in 2007 by Wright and White surveyed seventy three of the one hundred twenty three ARL member libraries and found out that the top five assessment methodologies in used are: (1) statistics gathering – at least for the purpose of collecting ARL statistics, (2) a
suggestion box, (3) web usability testing, (4) user interface usability and (5) surveys.
Among these, user surveys are used by over half of the responding libraries when starting an evaluation (Wright & White, 2007). The phenomenon may possibly be explained by the point made by Witlatch in 2001. Witlatch reported surveying as the most frequent way of assessing traditional reference services and as the most efficient method of assessing a large group of representative users. Moreover, he pointed out that surveys appear easy to design, especially for the first-time
inexperienced researcher (Witlatch, 2001).
Despite its popularity, all data collecting methodologies have its strong sides and pitfalls. While surveys and questionnaires enable collection of individuals’ thoughts ,beliefs, attitudes, and opinions, with some objective data like education, gender, and even income. They may end up obtaining meaningless information due to poorly designed questions or lack of deep information from standardized responses. Other risks include the possible low response rates and the
probability of those who do not complete the survey may greatly differ from those who do (Whitlatch, 2001).
Other researchers such as Nicholas (2009) have argued and raised doubts on the validity of self-report data because the participants may not remember or may not want to say what they really do in cyberspace. Similarly, Alexander(2008) pointed out that people have poor recall of what they did even a few days ago and the occurrence is especially high and true of what user did in cyberspace when they seem to leave the memory behind them.
2.2
Digital Library Statistics
Besides user surveys, one of the common methodologies of collecting evaluative data is through statistics gathering (Wright & White, 2007). In regard of the scope of digital library usage data collection, Franklin, Kyrillidou and Plum (2008) categorized the process into (1) census counts and (2) sample counts.
Looking of these two categories together with other dimensions, they believed the approach of how librarians evaluate digital resources can be concluded as below,
Census counts:
External generated, vendor usage data Locally or internally generated usage data Sample counts:
Externally generated, web survey data Internally generated, web survey, usage data
Traditional library statistics such as number of visitor to the physical library or number of collection being borrowed are used most often as indicators or measurements for library performances. However, statistics derived and collected specifically within the digital framework seems to offer yet more potential for statistical analysis. According to White and Kamal (2006), census count from
online usage log files presents an infinite variety of dimensions that easily surpass the accuracy and value of any prior attempt at quantifying operations.
In the subsequent paragraphs, the author will focus the examination on those under the category of census counts as they provide a more associable and more comparable characteristics with the commonly defined web analysis.
And to provide a comprehensive picture of such methodology, general concepts, brief history and fundamental characteristics of web metrics analytics will be first illustrated within the digital library framework. Afterward, the author will review some of the past works and cases on both vendor-supplied usage data and locally developed usage data by the library communities as well as looking at individual case with specific scenario.
2.2.1
Methods of Collecting Online Usage Data
There are few different ways of capturing usage log metric data to enable further analysis. According to NSDL (2006), web-metrics tools differ widely in cost, functionality, and ease of operation; they can be free or proprietary, implemented on project servers or operated remotely from third party servers, and can require varying levels of expertise and server access for their operation.
As far as methodologies of collecting web metrics data are considered, Kaushik (2007) has pointed out four mechanisms: (1) locally-stored web logs, (2) separately-stored web beacons, (3)
externally-stored JavaScript tags and (4) externally-stored packet sniffing. Among them the two most talked about in the reviewed literature are the (1) web logs and the (3) JavaScript tags. Historically speaking, the analysis of locally-stored web logs or sometimes called the server-side log files are most known to libraries and librarians as the Transaction Log Analysis, also called TLA. Earlier literature reveal some tedious efforts of extracting robust information from the raw data stored within the library server. But soon libraries started discovering better solutions through the use of free or proprietary software such as Webalizer, AWStats and WebTrends (Mento & Rapple, 2003) (Khoo & Donahue, 2007) (NSDL, 2009). In recent years, as more and more tools and web analytics designs such as Google Analytics and Omniture are using JavaScript tags, many users have started resolving their website evaluative problems by having both web logs and JavaScript tags approaches (Kaushik, 2007).
2.2.2
Web Analysis in Digital Libraries
Defined by (Peters et al., 1993), transaction log analysis is the study of electronically recorded interactions between online information retrieval systems and the persons who search for the information found in those system.
The method was developed and used since 1960 for different purposes but regarding its
application in the field of library science, TLA was first introduced for analyzing performance of an online public access catalog (OPAC) (Peters, 1993). But as library shift its attention to digital
interface, TLA stated to become increasingly used for understanding usage data not only on online information systems but also for library websites with the intention of improving design and functionality to meet users’ needs and expectations (Reeves, Apedoe & Woo, 2005).
TLA works in a way that whenever a user’s browser requests a file of element from the web server of the website, the web server accepts the request and creates and entry and record of this request in the web log, which stored within the internal server of the website or in the external third-party server(White & Kamal, 2006)(Kaushik, 2007)(COI, 2010). This is done usually through transaction monitoring software that built into a digital library system or based on a web server that automatically tracks specific interactions (Reeves, Apedoe & Woo, 2005). Web logs are
normally taken from the server on a set schedule and a standard log-parsing tool can be pointed in their direction to analyze the web logs and produce standard reports (Kaushik, 2007).
Since its invention to date, log files have evolved from its original purpose of capturing errors generated by web servers to include more information about how visiting users interact with the websites and online systems (Kaushik, 2007). Typically, web log files record seven basic elements, including the requesting IP address (unique internet Protocol number attached to each internet computer), authentication information, a time stamp, the transfer success status, and the transfer volume. Using web log analysis software enables libraries to analyze the use of a website in various ways such as a virtual visit (session to the website), page access (web page accessed by the user), and content unit (document, image, or other form of unit)(ISO, 2006).
In addition, the presentation of the basic raw metrics data (Figure 1.1) has also endeavored to become more organized and understandable, such as using automatic log-parsing (Figure 1.2) and adding graphical improvement (Figure 1.3).
Figure 1.1 example of basic transaction logs file (Mazur, 1997)
Figure 1.2 Sample Report from Analog, version 0.9 beta (Kaushik, 2007)
Figure 1.3 Sample Report from WebTrends (Kaushik, 2007)
2.2.3
Characteristics of Transaction Log Analysis
Having several potential advantages and disadvantages, transaction log analysis and particularly the mechanism of locally-stored data collection process has led to researchers adopting
contradictory views about the methodology (Jamali, 2005). According to Covey (2002), TLA has the advantage of being an unobtrusive way to study user behavior, to test hypotheses and an efficient
j-henderso.uncg.edu - - [Ol/Feb/1997:14:29:13 -05001 "GET /Local/mazur/burgh/pghRule.gif HTTP/1.0" 200 359
pit-08.ix.netcom.com - - [Ol/Feb/1997:14:29:16 -05001 "GET /Local/mazur/burgh/cyber.html HTTP/1.0" 200 6044
way to detect discrepancies between what users say they do, for example in a focus group study, and what they actually do when they use and online system or website.
In the following section, the author listed seven characteristics of TLA articulated in other literatures with no particular meaning in the ordering,
Automatically collected with unfiltered census details.
Defined by Trochim (2001), sampling is to determine the actual units you select to participate in the study and in reality, the size of sampling in reality is usually a tradeoff between small cheaper sample and generalizability.
As Log data are unfiltered and automatically collected (Nicholas et al., 2001), there is no need to take a sample, and thus questions concerning the representativeness or validity of the findings never arise as nothing matches logs for the size of the population studied (Nicholas, 2009). Considered a non-intrusive way to collect direct and immediately available record of what people have done, web logs does not rely on human memory but also rely on the users to provide ‘honest’ data (Nicholas 2009). As data are collected routinely, automatically and quite anonymously with no problems of low response rates or resource restraints (Nicholas and Huntington, 2003)(Nicholas 2009), web logs have become a suitable tool for longitudinal study and digital library assessment (Marchionini, 2000)(Xie & Wolfram, 2008).
However, it is due to the same nature that extracting data from TLA can be time-consuming as transaction logs can quickly grow to an enormous size (Covey, 2002). For instance, internal traffic sometimes make up large portion of traffic when in fact it is one of the potential unwanted counts. One may need filtering or at least account for such data before using the data (Burby & Sterne, 2007) (COI, 2010).
Kaushik (2007) also talked about ‘lots of data and metrics but not the most important one’ and suggested applying the right filters to remove image requests, page errors, robot traffic, requests for CCS (Cascading Style Sheets) files to better accurate traffic trends and behaviors.
Non-user activities inflate the counts of traffic.
Log files contain a great deal of non-human traffic such as search engine spiders, crawlers and robots which frequently crawl sites and leave non-user entries in web logs that would be counted in the metrics reporting (Kaushik, 2007)(COI, 2010). As stated above, if the data is considered as noises then it needs to be filtered and removed before further analyzing.
However, some studies pointed out that it is also because this nature of monitoring on non-human traffic, locally-stored basic web logs is the only data capture mechanism that will record and store the visits and behavior of search engine robots (Kaushik, 2007). In this light, Kaushik also claimed that TLA is somehow an ideal approach to measure the success of website’s search engine optimization efforts.
Caching reduces the counts of traffic.
Caching is the storing of previously viewed pages on the client’s computer for speed of retrieval; repeat in-session accesses to these pages are made from the cache and are not requested from the website’s server and hence not creating entries in the logs, especially that of tables of contents and other frequently consulted pages (Kaushik, 2007) (Nicholas, 2009). On the other hand,
dynamically generated web pages such as page via CGI script are not cached.
There are several levels of caching: browser cache, local cache and large regional caching. Local cache like proxy servers, firewalls with network address translation, VPNs (Virtual Private Network) and large regional caching provided by ISP (Internet Service Providers) or mirror sites are all
possible in biasing the logs when multi-user activities are seen from one IP. Therefore, only be counted as one unique user, when in fact there were many (COI, 2010)(Franklin, Kyrillidou & Plum, 2009). Kaushik (2007) reported that 10 percent or more of the usage traffic is actually invisible due to page cached by ISPs and proxy servers.
Uncertain about user identification.
According to COI (2010), generally user identification are recognized through the use of IP address or cookies. Overall speaking, each unique and valid identifier would be calculate as one unique user or unique visitor. In the case of using cookies for detection, unique visitor should be better framed as the “unique browser” as different browsers or different user log-in within the same computer store cookies separately. Therefore, by the definition of WAA (2008), unique visitors count is the number of inferred individual people (filtered for spiders and robots), within a designated reporting timeframe, with activity consisting of one or more visits to a site and each individual is counted only once in the unique visitor measure for the reporting period.
As cookies set up requires further expertise, most literature reviewed show that digital library web analytics evaluation was mostly just using the IP addresses to identify unique users. However, as users nowadays may be assigned with dynamic IP addresses by ISPs during a session (Sen, Dacin & Pattichis, 2006) or connected to internet via a proxy server(Kaushik, 2007), this would be
same user, and the latter results in a number of computers appearing together under one single IP (Nicholas, 2009).
Alternatively, Kaushik (2007) reported that some vendors are using IP address plus user agent ID (other identification such as the user operating system and browser) to distinguish better. But as the option was yet not quite optimal, cookies should be set up to help identifying visitors with a higher degree of accuracy .
Lacking exit time stamp.
Defined by WAA (2008), to calculate the time a user spent on the website, typically the timestamp of the last activity in the session is used to minus the timestamp of the first activity of the session. But the accurate calculation becomes challenging and difficult as in fact users don’t log off on the web but rather depart anonymously (Nicholas, 2009). Whether the user exits through closing the browser window, click on an external link or simply type in another URL, no estimate can be generated for the last page viewed in a session as the logoff motion would not leave mark to be track by the server (Kaushik’s Blog, 2008) (Nicholas, 2009). In addition, the calculation complicates further when browser tabs become increasingly common and popular. In which case, users are opening several different web pages of one single website simultaneously in the same browser using many browser tabs (Viermitz, Stolz & Skubacz, 2006).
Most studies indicate the suitable inactivity interval of 30 minutes to be the standard for the assumption of user log-off and session ending stamp. This means when the users are no longer interacting with the website for more than 30 minutes, the system would automatically log-off users or started a new session calculation. But some experts argued the possibility of and
adjustments of varying the standards for the number of minutes, according to the types of pages and the number of words contains within the page being viewed (Nicholas, 2009) (Khoo et al., 2008).
Needs of triangulation with other methods.
Log analysis, as it is clear from its name, just records the interaction between an information system and a user whose identify usually is not clear (Jamali et al. 2005). It indeed provides a level of detail not obtainable by other method as it records the users’ viewing, searching, browsing and navigating over the period studied (Nicholas, 2009).
However, unlike interviews, observations and focus groups which capture users’ perceptions, opinions, attitudes and feelings for experience analysis, log files is meant to only helps in behavior
analysis (Kaushik, 2007) (Monopoli, 2009).
The importance of data interpretation was the ability to consider different aspects holistically because log files can only help as best as it does to infer the intent of the users (Burby & Atchison, 2007) (Kaushik, 2007). For instance, the number of sessions on a website does not necessarily represent number of users, and decrease in number of searches conducted may actually be reflecting increased efficiency and higher user satisfaction rather than less use and lower value of the website (NISO, 2001).
Kurth (1993) reported the inability to find user satisfaction for the interacting systems through looking at log files; Magarity (1998) found logs lack of the explanation for reasons behind requests, motivation of why user use and react the way they are or any other qualitative aspects of use. Projects of Library of Congress (LoC) and National Science Digital Library (NSDL) also show the needs of reading log data with triangulate with other methods (Khoo et al., 2008), and as Reeves, Apedoe and Woo (2005) concluded, transaction log analysis alone usually and simply requires too much inference.
On the other hand, log files evidence indeed provides important information which could be explained with additional data obtained from other methods. (Jamali et al., 2005) reported that when combining with other studies, log analysis is an effective way to raise evidence-led questions to be asked in questionnaire surveys or interview studies. Studies from the previous researches and projects also demonstrate the usage and value of web log data when read in conjunctions with information derived from other methodologies (NSDL, 2010).
In sum, as pointed out by NSDL (2010), though metrics provide useful data, reporting values is not enough for assessing impacts. The evaluation strategies and methods must be employed beyond those that focus on individuals; namely, data from metrics must be triangulated with interviews, focus groups, ethnography and other approaches in order to reach a rich program evaluation.
Double counting may cause skewed data
Finally, one of the other concerns were pointed out by Nicholas (2009). When a user wants to see the PDF full-text version from a gateway or third-party site that only indexes the HTML version, the user has to come out of the HTML full-text version and load up the PDF. And this would tend to be counted as two views by most of the proprietary software, which for most librarians would
consider as one user request in reality. One of the solutions was to use the mechanism of allowing only one count when such events happen within a few seconds of each other (Nicholas, 2009). All in all, different mechanisms inherit different traits. Though locally-stored web server logs
analysis comes with concerns, still has its incomparable values. It is a feasible method to study visits of search engine robots and to ensure the original log file data would not be captured, processed and stored unless permitted (Kaushik, 2007).
As mentioned above, there is another widely talked about method to collect usage log metrics data, besides web server logs analysis. It is the method of using embedded JavaScript code in HTML source code. This method would be introduced later in Chapter three with the introduction of Google Analytics.
2.3
Review of Researches and Cases
Reviews on the literature have found several national and local libraries using various way to generate more insights from the enormous usage log data. In addition, some of the major national and international library organizations, standards bodies, and digital publishers have also
addressed the recognized needs for new measurement standards by developing and funding a number of e-metrics projects (White & Kamal, 2006).
Out of all the past works and cases, this dissertation will look at some of the representative projects and exemplified cases, including (1) ICOLC Guidelines, (2) ISO Standards and EQUINOX Project, (3) ARL E-Metrics Project, (4) NIZO Z39.7, (5) COUNTER for standards originated from library community, and (6) CIBER Deep Log Analysis as well as (7) NSDL Digital Libraries as individual case reviews.
The intention of these reviews are aiming to result in a sets of (1) web related evaluative metrics and (2) evaluative purposes for analytics practices from the digital library perspective. And as the main function of the following cases is to exhibit the past efforts endeavored by the digital library community, the author will not separate the discussion by its data collection method of whether it is collected using the locally-stored web server logs or third-party server stored JavaScript tags. so to apply the same metrics and purposes on the later examination of Google Analytics in the chapter three.
And as the main function of the following 7 cases is to exhibit past efforts endeavored by the library community bodies and individual library, methodologies of how each case collect its web metrics are not in particular concerns and hence would be seen and discuss under the general definition of web analytics, regardless the data collecting process being using the locally-stored web server logs or third-party server stored JavaScript tags.
2.3.1
ICOLC Guidelines
In the mid- and late 1990s, libraries and online content publishing industry attempted to measure the use of periodical indexing, abstracting and full content utilities and this had resulted in a series of initiatives emerged in parallel in 1998 (Davis, 2004).
White and Kamal (2006) claimed that perhaps most influential set of results from those earliest e-metrics projects was the document of ‘Guidelines for Statistical Measures of Usage of
Web-Based Indexed, Abstracted, and Full Text Resources’ generated from the ICOLC (International Coalition of Library Consortia) representatives. At the time of its reporting (1998), the coalition comprised over 90 library consortia in North America, Europe, Australia, Israel, China, and South Africa.
Based on the JSTOR Web Statistics Task Force, the Guidelines had expanded to reflect the diversity of resources licensed by its members. First version of the document in 1998 was designed to achieve several goals listed as below (ICOLC Press Release, 1998),
to provide an international perspective on preferred practices in the licensing and purchasing of electronic information
to describe the types of use data and measurement that the ICOLC members expect from vendors of web-based indexed, abstracted and full-text resources
to ensure the value of licensed electronic resources is fully understood in the consortium setting
to enable consortia and vendors to analyze use and frequency of use without violating the individual’s privacy
In the ICOLC Guidelines, the following online usage metrics were documented as use element that must be provided to measure a digital library (ICOLC, 1998)(White & Kamal, 2006),
ICOIC Guidelines Metrics Explanations
Number of Queries /Searches Categorized as appropriate for the vendor’s information. A search is intended to represent a unique intellectual inquiry. Typically a search is recorded each time a search form is sent/submitted to the server.
Number of Menu Selections Categorized as appropriate to the vendor’s system. If display of data is accomplished by browsing (use of menus), this measure must be provided (e.g. an electronic journal site provides alphabetic and subject-based menu options in
addition to a search form. The number of searches and the number of alphabetic and subject menu selections should be tracked.)
Number of Sessions (Logins) If relevant, must be provided as a measure of simultaneous use. It is not a substitute for either query or menu selection counts.
Number of Turnaways If relevant, as a contract limit (e.g. requests exceed simultaneous user limit).
Number of Items Examined Viewed, marked or selected, downloaded, emailed, printed to the extent these can be recorded and controlled by the server rather than the browser. Items include,
1. Citations displayed (for A&I databases)
2. Full text displayed broken down by (a) table of contents displayed, (b) abstracts displayed, (c) articles or essays, poems, chapters, etc. viewed (ASCII/HTML) or
downloaded (PDF/Email)
Later in 2001, ICOIC revised the original version of the Guidelines with improvements of simplifying the data elements to be reported, strengthening administrative aspects of confidentiality, access, delivery, and report format (Shearer, 2002).
2.3.2
ISO Standards and EQUIONOX Project
In a 2002 report of Backgrounder Series #3, the Canadian Association of Research Libraries (CARL/ABRC) documented that the standards at the time around 2002 for the collection of aggregate statistics in academic libraries are outlined by the International Standards Organization (ISO 11620 and ISO 2789) in Europe and the National Information Standards Organization
(ANSI/NISO Z39.7) in the United States (Shearer, 2002).
Among these standards, ISO 2789 – International Standard on Library Statistics, having its first released version dated back in 1974, has gone through 4 revisions and is currently most updated by its 2006 edition. The original work started from 1960s’ under the request of UNESCO. Experts from IFLA and ISO had came together for UNESCO to create a set of general guidelines for library statistics aggregation at an international level (Rnard, 2007).
For the purpose of keeping the standards valid at different levels through time, the 2006 revision categorized more than 100 definitions of data into 6 groups: libraries, collections, use and users,
access and facilities, expenditure, and library staff (Renard, 2007). In addition, there was an annex of “Measuring the use of electronic library services” besides the report (ISO, 2006). Apart from its clear classification of various forms of electronic library services and resources, the following measurement were identified and defined clearly to be relevant and should be collected when possible and appropriate (ISO, 2006) (White & Kamal, 2006),
ISO 2789 Metrics Explanation
Number of Sessions A session is defined as a successful request of a database or the online catalogue. It is one cycle of user activities that typically starts when a user connects to a database or the online catalogue and ends by terminating activity that is either explicit (by leaving the database through log-out or exit) or implicit (timeout due to user inactivity).
For services which are the aggregation of a number of individual databases, further information should be provided as to the separate databases hosted. For example,
1. Online catalogue: Data are usually available from the library's system. Many online catalogues offer immediate order and/or availability check functions for chosen titles. The number of searches and records downloaded should be counted in addition to the number of sessions.
2. Electronic collection: Data are available either from the library’s own servers or from vendors/suppliers. The delivery of statistical data should be included in license agreements. Use of free internet resources which have been catalogued by the library in its online catalogue or a database should be counted separately, if data are available.
In some cases, e.g. online catalogue use inside the library, several users might make use of the same workstation one after the other, and sessions could not be separated. In most systems, a session is cut off after a specified time of non-use, thus avoiding part of the problem. The average timeout setting would be 30 min. If another timeout period is used, this needs to be reported.
Number of Content Downloaded
A content downloaded is defined as a content unit being successfully requested from a database, electronic serial or digital document. Downloading content units from the library collection indicates that the users have found items that they consider relevant.
Number of Record Downloaded
A record downloaded is defined as a descriptive record being successfully requested from a database or the online catalogue.
Downloading records from a database or the online catalogue indicates that the users have found bibliographical or other information that they consider relevant.
Number of Virtual Visits
A virtual visit is defined as a user’s request on the website from outside the library promises, regardless of the number of pages or elements viewed.
Virtual visits can be compared to traditional library visits.
Session Time Session time is defined as the period of time between a log-in to and an implicit or explicit log-off from a databases or the online
catalogue.
The search time depends on many variables. E.g. ease of handling, users’ experience and automatic lo-off settings. A long connect time, therefore, does not always reflect the users’ interest in the service. This count gives additional information on the intensity of use of a certain service.
Number of Rejected Sessions (Turnaways)
A rejected session (turnaway) is defined as an unsuccessful request of a database or the online catalogue by exceeding the simultaneous user limit. Request failure because of wrong passwords is excluded, though it can’t always be differentiated. This dataset shows how far the simultaneous user limit is sufficient for users’ demand.
Number of Searches A search is defined as a specific intellectual query. Typically, a search is recorded each time a search request is submitted to the server. Immediately repeated duplicated searches, double clicks, or other evidence indicating unintended user behavior needs to be excluded. Mistyped search strings do not represent unique intellectual
inquiries. In practices, however, libraries will have difficulties to differentiate these unintended searches from intended, but unsuccessful searches.
Number of Internet Sessions
An internet session is defined as internet access by a user from a workstation owned by the library or from a user’s private computer inside the library via the library’s network.
This dataset shows to what extent the library provides access to the internet for its users via its workstations or a network connection. The number of internet sessions can only be counted if users have registered or authenticated themselves when accessing the internet. If these data are not available, the number might be estimated by surveying users.
The other ISO standard, ISO 11620 – Library Performance Indicator was released at 1998 and focuses its initial dimensions on (a) user satisfaction (b) public services and (c) technical services (Shearer, 2002). Some researcher argue that ISO 11620 is merely an extension of ISO 2789 (Renard, 2007), but both standards in evidently contributed greatly to the later relative projects which would try to integrate and expand the already existing standards.
For example, the two-year EQUINOX Project (1998-2000) had benefited from the ISO Standards. Supported by European Commission, the project aimed to further develop aforementioned international agreement on performance measures of ISO by including performance measures for the electronic library environment (Shearer, 2002).
In its 14 performance indicators, EQUINOX covered many aspects. Besides the part on library staffing and expenditures, there are four measuring metrics specifically extractable from the raw data of a log file (EQUINOX, 2000),
EQUINOX Project Metrics Explanations
Number of sessions on each electronic library service per member of the targeted population
Number of remote sessions on electronic library services per member of the population to be served
Number of documents and entries (records) viewed
per session for each electronic library service
Rejected sessions as a percentage of total attempted sessions
2.3.3
ARL E-Metrics Project
On the other hand in the United States, Martha pointed out in 2000 that the ARL (Association of Research Libraries) libraries had been collecting statistics related to budgets, collections, services, and personnel (Martha, 2000) but statistics regarding the use of electronic resources had been underdeveloped and underused.
Though this type of information is essential to libraries in financial support, infrastructure,
comparisons and during vendor negotiation (Blixrud, 2010), lack of clear and consistent definition of data elements still resulted in vendors counting things in different manners. Moreover, the fact that libraries do not control access to and use of important data about vendor-supplied resources made it even more complicated to justify or evaluate the increasing total expenditures on
Realizing its importance, the Statistics and Measurement Committee of ARL created the ‘E-Metrics Project: Developing Statistics and Performance Measures to Describe Electronic Information Service and Resources for ARL Libraries’ in 2000 May as part of the ‘New Measure Initiative’ developed since the January of 1999. Contracted with the Information Use Management and Policy Institute in Florida State University (FSU), the E-Metrics Project lasted 18 months till December, 2001 (Shim et al., 2000).
Under its main goal of acting upon users’ opinions for service quality, the project was motivated to develop standard definitions for digital library measurements as such information could help libraries or digital libraries in describing the following (Blixrud & Kyrillidou, 2003) (Heath, 2010),
the e-resources they make accessible the use made of the resources the level of library expenditures
The ARL E-metric Project eventually resulted in recommending five aspects of statistics and measures for libraries (Blixrud, 2010),
Patron Accessible Electronic Resources Use of Networked Resources & Services
Expenditures for Networked Resources & Related Infrastructure Library Digitization Activities
Performance Measures
Under the second aspect of “Use of Networked Resources & Services”, the project advised libraries to collect the following online usage metrics for evaluation purposes,
ARL E-Metric Project’s Metrics Explanations Number of electronic reference
transactions
An electronic reference transaction must include a question either received or responded to electronically (e.g. email, website or other network communications mechanisms designed to support electronic reference), such as Ask-A-Librarian, RefeXpress, DigiRef,
QuestionPoint. Count the number of requests, not the number of questions.
Number of logins (sessions) to electronic databases
Number of user initiated sessions in licensed electronic resources.
electronic databases electronic resources.
Items requested in electronic databases
Number of items requested in all of the library’s licensed electronic resources, including viewing, downloading, emailing and printing to the extent the activity can be recorded and controlled by the server rather than browser.
Virtual visits to library’s website and catalog
User visits to the library’s website or catalog from outside the physical library premises regardless of the number of pages or elements viewed. All visits to the website should be counted regardless of repetition by one user.
(determined by a user’s IP address, which can be misleading due to ISPs and Firewalls or Proxy Servers; thus, this measure is actually an estimate of the visits). Procedures include,
(a) identify all sources of virtual visits that take place on more than one web server which may be owned by the library or maintained by another department in the university, ISP or vendors.
(b) exclude internal use within the premises of the library from the counts for this measure when possible.
(c) develop strategies for collecting data from each of these sources using one or more log analysis software packages. (d) determine log analysis software definition that corresponds to the virtual visit definition.
(e) where virtual visit counts include the aggregate of internal and external visits, indicate this in your report.
In sum, the new measuring metrics developed in the ARL E-metric Project are more extensive than those put forward by ICOLC, as it accompanied with collection methodologies and precise
definitions for each dataset (Shearer, 2002). And after its three-phase work and the approval of its investigators’ final reports in October 2001, the contributions of the ARL E-metrics project has been continually reviewed and revised based on further testing and suggestions.
Most importantly, the project’s investigation on vendor statistics was continuously made into an effort and support to other initiatives. And in accordance to its documented objectives,
multi-agency organizations aimed to develop an achievable and widely supported common code of practice for vendor-based online usage statistics such as COUNTER did gain the benefit from the ARL Project (ARL, 2002) (COUNTER, 2011).
2.3.4
NISO Z 39.7
Founded in 1939, NISO (National Information Standards Organization) is an nonprofit association accredited by the American National Standards Institute (ANSI). NISO seeks to continuously establish and maintain information industry standards that allow content publishers, libraries, and software developers to work together. The ANSI/NISO standards are being revised every 5 years (Shearer, 2002) (NISO, 2011).
One of its standards, ‘ANSI/NISO Z39.7 – Information Services and Use: Metrics & Statistics for Libraries and Information Providers Data Dictionary’ started as early as 1968. The first edition of Z39.7 was created on the base of ‘Library Statistics: A Handbook of Concepts, Definitions, and Terminology’ by American Library Association (ALA). The handbook was an attempt to clarify definitions, reduce duplication, and close gaps in library data collection (Devis, 2004).
In its 1995 revision, the committee acknowledged that “new data elements need to be created for measuring the new services now available in and through libraries because of developments in computer and telecommunications technology. For example, the gate count measure needs to be expanded to include offsite access to electronic resources. Measurement of interlibrary loan activity needs to be reviewed in light of developments in the area of electronic access and delivery information. But these new data elements must be developed based on experience over the next several years. That experience will result in a very different statistics standard in the next revision.” (NISO, 1995).
Efforts for such activities were eventually established in 2001, when an invitational NISO Forum on Performance Measures and Statistics for Libraries took place in Washington, DC. Sixty-five
participants from various library communities and key vendors were gathered together to discuss the best approach to evaluate the NISO standard on library statistics. The recommendations was taken into closely account for the later 2002 and 2004 revisions (Devis, 2004).
The latest 2004 version inherits some of the characteristics of version 2002 such as the assimilation of ISO 2789, using the data dictionary format, and the attribution to its originating documents under each element (Welch, 2007). And it also shares the same aim that was first used in the 1983 revision:
to assist librarians and researchers [now defined as the information community] by indicating and defining useful quantifiable information to measure the resources and performance of libraries and to provide a body of valid and comparable data on American libraries (NISO,
2004).
Four essential and core e-metrics datasets were identified, if possible, should be collected for all services. Figures can be reported under separation or summed up as a total (NISO, 2004),
NISO Z39.7 Metrics (a) Explanations
Number of sessions Definition borrowed from ISO 2789
Number of searches (queries) Definition borrowed from ISO 2789
Number of units or descriptive records examined (including downloads)
Definition borrowed from ISO 2789
Total annual virtual visits to networked library resources
A visit occurs when an external user connects to a networked library resource from any length of time or purpose (regardless of the number of pages or elements viewed).
In addition, with its comprehensive approach on defining elements of libraries’ Human Resources, Collections, Infrastructure, Finances and Services, the data dictionary also offers detailed definition and calculation methods on the following elements analogous to web analytics metrics,
NISO Z39.7 Metrics (b) Explanations Number of rejected sessions (turnaways) Definition borrowed from ISO 2789
Number of menu selections Definition borrowed from ICOLC Guidelines
Number of virtual reference transactions Definition borrowed from ARL E-Metrics Project
One thing worth mentioning is that the scope of each dataset element should be considered flexibly according to the need of each individual library. To give one example, the metric of examining units or records could be broken down into details as shown below,
Units/Records Examined
Commercial services descriptive records examined Commercial services full-content units examined Library collection descriptive records examined Library collection full-content units examined OPAC descriptive records examined
In general, there are already many discussions on digital statistics focusing on the vendor-supplied data report standards by the time around 2002. However, it was not until the formation of
acceptance and application within the library community.
2.3.5
COUNTER
Began in 2002, COUNTER(Counting Online Usage of Networked Electronic Resources) provides a set of international, extendible Codes of Practice that allow the usage of online information products and services to be measured in a credible, consistent and compatible way using vendor-generated data (COUNTER, 2008).
White and Kamal (2006) pointed out many of the recommendations and findings from the ARL e-metrics project have since become incorporated into Project COUNTER. The work of NISO Z39.7 has also been incorporated in many ways, such as providing many of the terms’ definitions. COUNTER is now endorsed by a number of significant publisher and information sciences organizations, including the JISC (Joint Information Systems Committee , UK), NCLIS (National Commission on Libraries and Information Science, USA), NISO and ARL. After its first release, the latest Release 3 of the COUNTER Code of Practice Journals and Databases was made obligatory to all COUNTER-compliant vendor since the end of August, 2009 (COUNTER, 2008). Starting from 2011, the COUNTER-compliant report has stretched from Journals and Databases to include also Books and Reference Works (COUNTER, 2010), and the Code of Practice for Books and Reference has its latest release in 2006 (COUNTER, 2006).
The Code of Practice emphasized flexible levels of reporting as the information is important to both the consortium as well as the individual library. Better reporting system has also been considered. For example, when a consortia has more than one member institute sharing an IP address or range of IP addresses, the total usage statistics reported in the consolidated Consortium Reports must be de-duplicated (COUNTER, 2008).
Mentioned by White and Kamal (2006), both COUNTER-compliant and other vendor-supplied e-metrics offer libraries a baseline measurement of subscription journal and article access; therefore, providing libraries with such data would give a broad comparison of title and database usage patterns such as what the most and least popular journal titles from a single service.
Besides libraries, librarians and users, vendors are also in essential need of reliable, consistent, and compatible online usage statistics (Shearer, 2002). Publishers and distributors of online information resources could utilize e-metrics to determine user volume and title interest in order to better plan for marketing and production of new titles, subjects, and services (White & Kamal, 2006). For reliability purposes, an independent annual audit is required of each vendor’s reports and
processes to certify the they are COUNTER compliant (COUNTER, 2008).
The Release 3 COUNTER endeavors to mitigate the potentially inflationary effects on usage statistics of federated and automatic search engines, internet robots, crawlers, etc. and its incorporation with the XML-based SUSHI (Standardized Usage Statistics Harvesting Initiative) protocol developed by NISO better the automated retrieval for various systems. furthermore, some of the optional additional usage report in Release 2 has became required to better report journal archives usage (COUNTER, 2008).
All terms referred and mentioned in the COUNTER reports were clearly defined. The following list demonstrates some of the most relevant and needed terms when conducting analysis over raw data from log files (COUNTER, 2008),
Terminology Definition
ITEM can be a full text article, abstract, chapter, image or video.
REQUEST happens when user is viewing, downloading, emailing and printing.
SERVICE is defined as a branded group of online information products from one or more vendors that can be subscribed to/licensed and searches as a complete collection or at a lower level such as ScienceDirect.
SESSION was defined as a successful request of an online service and ends when the user terminate activity implicitly by time out due to inactivity or explicitly by leaving the service through exit or logout.
TURNAWAY is the same as a rejected session as an unsuccessful log-in to an electronic service by exceeding the simultaneous user limit allowed by the license.
USER is an individual with the right to access a platform and interact with items.
YEAR is indicate by which an article, item, issue or volume is first published in any medium.
The COUNTER-compliant vendors look at the following aspects for generating various reports, such as Journal Reports, Database Reports, Consortium Reports, Book Reports and some other optional reports.
Type of Report Reporting Metrics
Journal Reports Number of successful full-text article requests by month and journal
by month and journal
Turnaways by month and journal
Number of successful full-text article requests by year and journal
Database Reports Total searches and sessions by month and database Turnaways by month and database
Total searches and sessions by month and service
Consortium Reports Number of successful full-text journal article or book chapter requests by month
Total searches by month and database
Book Reports Number of successful title requests by month and title Number of successful section requests by month and title Turnaways by month and title
Turnaways by month and service
Total searches and sessions by month and title Total searches and sessions by month and service
Optional Reports Number of successful full-text item (journal/book) requests by month and title
Number of full-text article requests by month and journal; usage broken down by html, PDF and other formats
Number of successful item requests and turnaways by month, journal and page-type
Total searches run by month and service
2.3.6
National Science Digital Library
The complexity of digital library evaluation work is illustrated by an example from the National Science Digital Library (NSDL). Funded by National Science Foundation’s (NSF’s) Division of Undergraduate Education, NSDL is a national network of digital environments for the National STEM Distributed Learning Program that dedicated to advancing science, technology, engineering, and mathematics (STEM) teaching and learning for all learners, in both formal and informal settings (NSDL, 2011). According to the website of NSF, NSDL follows four tracks: (1) pathways projects, (2)pathways II projects, (3) services projects and (4) targeted research.
Among them, the NSDL Pathways Projects are the result of the integration of specific individual digital library components (tools, services, collections, etc.) grouped by grade level, discipline,