i
Spatial patterns in excess winter morbidity
among the elderly in New Zealand
by
Nicholas David Brunsdon
Masters of Science in Geography
Department of Geography, University of Canterbury
ii
Table of Contents
Acknowledgements ... iv
Abstract ...v
Abbreviations... vi
List of Tables ... vii
List of Figures ... ix
1 Introduction ... 1
1.1 General overview ... 1
1.2 Aims and Objectives ... 2
1.3 Thesis outline ... 2
2 Background ... 5
2.1 Excess winter mortality and morbidity ... 5
2.1.1 Theoretical foundation ... 6
2.1.2 Methodologies ... 8
2.1.2.1 Mortality, morbidity or hospitalisation ... 8
2.1.2.2 Length of admission ... 8 2.1.2.3 Defining winter ... 9 2.1.2.4 Temperature ... 10 2.1.2.5 Cold spell... 11 2.1.2.6 Confounders ... 11 2.1.2.7 Spatiality ... 13 2.2 Ageing population ... 13 2.2.1 Demographic changes ... 14 2.2.2 Health demand ... 15 2.2.3 Fiscal impact ... 16 3 Methodology ... 18 3.1 Data sources ... 18 3.1.1 Climate ... 18 3.1.2 Hospitalisations ... 19 3.1.3 Population ... 21 3.1.4 Deprivation ... 21 3.2 Analysis ... 22 3.2.1 Tools ... 22 3.2.2 Temperature ... 22 3.2.3 Processing ... 23
iii
3.2.3.1 Hospitalisations ... 23
3.2.3.2 Adding geography ... 24
3.2.4 Admission rates ... 27
3.2.4.1 Age standardisation ... 27
3.2.4.2 Seasonal admission rates ... 27
3.2.4.3 Monthly admission rates ... 27
3.2.4.4 Daily admission rates ... 28
3.2.5 Admission duration ... 28
3.2.5.1 Mean length of admission ... 28
3.2.5.2 Length of admission modelling ... 28
4 Results ... 30 4.1 Summary Statistics ... 30 4.2 Hospital admissions ... 36 4.2.1 Overview ... 36 4.2.2 Monthly patterns ... 42 4.2.3 Daily patterns ... 48 4.2.4 Spatial patterns ... 53 4.2.5 Socioeconomic deprivation ... 54 4.3 Length of admission ... 56 4.3.1 Overview ... 56
4.3.2 Seasonality and temperature ... 60
4.3.3 Spatiality ... 69
4.3.4 Socioeconomic Deprivation ... 70
5 Discussion ... 73
5.1 Demography ... 73
5.2 Long term changes ... 77
5.3 Seasonality and temperature ... 78
5.4 Spatial patterns ... 82
5.5 Directions for future research ... 83
5.6 Research implications ... 84
6 Conclusion ... 85
iv
Acknowledgements
I owe great thanks to my supervisors Malcom Campbell and Simon Kingham for inspiring me to study health geography and their support and sage advice throughout my honours dissertation and masters thesis.
Full credit to the staff and students in the GeoHealth Lab and Geography Department for their support and commitment to the cake roster.
Mum, Dad and my partner Christine, I can’t thank you enough for your unwavering support throughout the highs and lows of research.
I thank my employer, Canterbury Development Corporation, for their understanding and flexibility as I have juggled my time between work and study.
The support of the Ministry of Health has been essential to this research, with Health & Disability Intelligence helping me to develop this topic, and Analytical Services for promptly providing me with an immense customised dataset.
v
Abstract
It has been established in New Zealand and internationally that morbidity and mortality tends to rise during colder winter months, with a typical 10-20% excess compared to the rest of the year. This study sought to investigate the spatial, temporal, climatic and demographic patterns and interactions of excess winter morbidity (EWMb) among the elderly in New Zealand. This was achieved through analysis of acute hospital admissions in New Zealand between 1996 and 2013 for all patients over the age of 60 with an element of circulatory or respiratory disease (N=1,704,317) including a primary diagnosis of circulatory (N=166,938) or respiratory (N=62,495) disease. A quantitative approach included ordinary least squares and negative binomial regression, graphical analysis and age standardisation processes. Admission rates and durations were regressed against a set of 16 cold spell indicators at a national and regional scale, finding significant spatial variation in the magnitude of EWMb. EWMb was ubiquitous across New Zealand despite climatic variation between regions, with an average winter excess of 15%, and an excess of 51% for chronic obstructive pulmonary disease (COPD). Statistically significant relationships were found between hospital admission durations and cold spells up to 28 days prior; however the magnitude would not be expected to have a significant impact on hospital resources. Nonetheless, there is potential for preventative public health strategies to mitigate less severe morbidity associated with cold spells. Patients over the age of 80 were particularly vulnerable to EWMb; however socioeconomic deprivation and ethnicity did not affect vulnerability. Patients residing in areas of high socioeconomic deprivation or identifying with Maori or Pacific Island ethnicity
experienced significantly shorter admissions than other groups, and this warrants further investigation. Further investigation into winter COPD exacerbations and non-climatic factors associated with the EWMb are recommended. A comprehensive understanding of EWMb will enable preventative measures that can improve quality of life, particularly for the elderly population.
vi
Abbreviations
ASR – Age Standardised Rate CAU - Census Area Unit
COPD – Chronic Obstructive Pulmonary Disease
CSVH – Coefficient of Seasonal Variation in Hospitalisations ERP – Estimated Resident Population
EWH – Excess Winter Hospitalisations EWM – Excess Winter Mortality EWMb – Excess Winter Morbidity
ICD – International Statistical Classification of Diseases and Health Related Problems MOH – Ministry of Health
NMDS – National Minimum Dataset NZDep – New Zealand Deprivation Index SNZ – Statistics New Zealand
vii
List of Tables
Table 1:- International comparison of excess winter mortality rates, comparing winter mortality rates to non-winter. Emphasis added to New Zealand to highlight the context of this research. ... 6 Table 2:- Description of key datasets ... 18 Table 3:- List of sub categories within ICD circulatory and respiratory disease categories (World Health Organization, 1979) ... 20 Table 4: -Variables obtained on hospital admission records from the National Minimum Dataset
(Ministry of Health, 2013) ... 20 Table 5:- Dimensions of deprivation from Census used in NZDep Index 2013 (Atkinson et al., 2014, p.8). *Equivalised households are adjusted to control for household composition ... 22 Table 6:- Protocol for interpolating NZDep socioeconomic deprivation scores to hospital admissions ... 24 Table 7:- List of main urban areas used for analysis, listed in descending order of their populations as recorded by the 2013 national census ... 25 Table 8:- Summary statistics for binary variables ... 31 Table 9:- Summary statistics for continuous and interval variables ... 32 Table 10:- Correlation matrix showing correlation coefficients between each of the temperature
variables ... 35 Table 11:- Summary of linear regression models relating temperature variables to daily admission rates per 10,000 of population, for all respiratory and circulatory related admissions ... 50 Table 12:- Summary of linear regression models relating temperature variables to daily admission rates per 10,000 of population, for admissions with a primary diagnosis of circulatory disease... 51 Table 13:- Summary of linear regression models relating temperature variables to daily admission rates per 10,000 of population, for admissions with a primary diagnosis of respiratory disease ... 52 Table 14: - Summary of linear regression models relating temperature variables to daily admission rates per 10,000 of population, for each of the eight main centres and three diagnosis groups ... 53 Table 15:- Summary of negative binomial regression models relating temperature variables to length of hospital admission, for all respiratory and circulatory related admissions. Patient characteristics
including age, NZDep score and ethnicity are controlled for. ... 64 Table 16:- Detailed analysis of negative binomial regression of admission duration, for all circulatory and respiratory disease related admissions ... 65 Table 17:- Summary of negative binomial regression models relating temperature variables to length of hospital admission, for all circulatory admissions. Patient characteristics including age, NZDep score and ethnicity are controlled for. ... 66 Table 18:- Detailed analysis of negative binomial regression model of admission duration, for primary diagnosis of circulatory disease. ... 67 Table 19:- Summary of negative binomial regression models relating temperature variables to length of hospital admission, for all respiratory admissions. Patient characteristics including age, NZDep score and ethnicity are controlled for. ... 68
viii
Table 20:- Detailed analysis of negative binomial regression of admission duration, for primary diagnosis of respiratory disease ... 69 Table 21:- Summary of negative binomial regression models relating temperature variables to length of hospital admission, for all three admission groups and all eight main centres. Patient characteristics including age, NZDep score and ethnicity are controlled. ... 70
ix
List of Figures
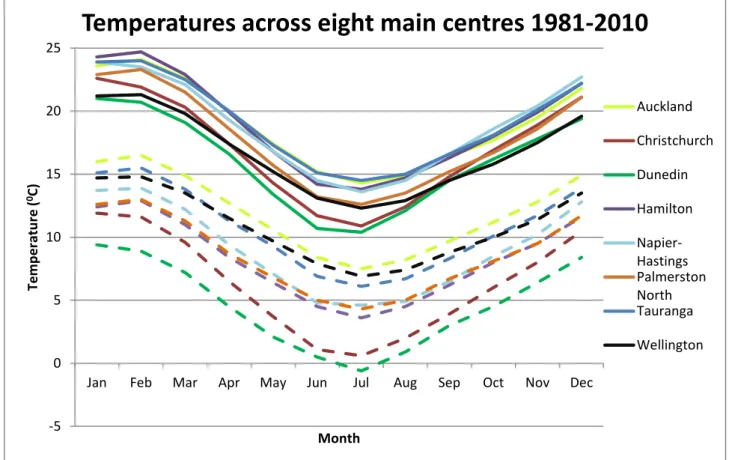
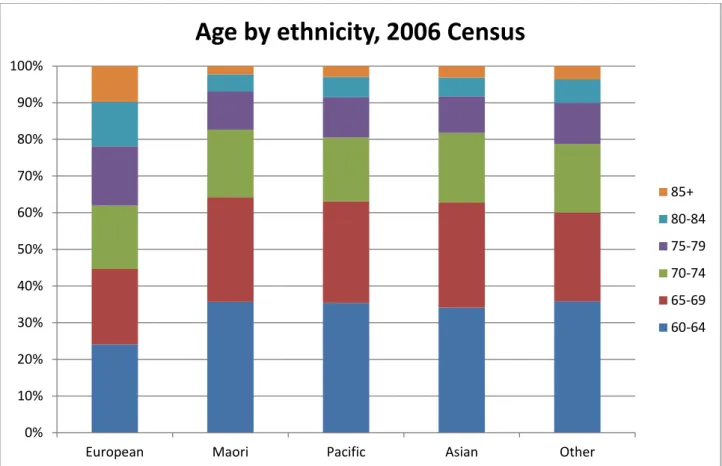
Figure 1:- Map of New Zealand, with the eight main centres illustrated in orange ... 26 Figure 2:- Graph of minimum and maximum temperatures across New Zealand's eight main centres for the period 1980 to 2010. Solid line indicates mean monthly maximum temperature, and dashed line indicates mean monthly minimum temperature. ... 33 Figure 3:- Distribution of primary diagnosis for the admissions dataset (drawn from admissions with a primary and/or secondary diagnosis of respiratory or circulatory disease ... 34 Figure 4:- Age Standardised Rates (ASR) of hospital admissions by year of admission and age group, for all circulatory and respiratory related admissions ... 37 Figure 5:- Age Standardised Rates (ASR) of hospital admissions by year of admission and age group, for admissions with a primary diagnosis of circulatory disease ... 37 Figure 6:- Age Standardised Rates (ASR) of hospital admissions by year of admission and age group, for admissions with a primary diagnosis of respiratory disease ... 38 Figure 7:- Age Standardised Rates (ASR) of hospital admissions for each of the eight main centres by year of admission, for circulatory or respiratory disease related admissions ... 38 Figure 8:- Age Standardised Rates (ASR) of hospital admissions for each of the eight main centres by year of admission, for admissions with a primary diagnosis of circulatory disease ... 39 Figure 9:- Age Standardised Rates (ASR) of hospital admissions for each of the eight main centres by year of admission, for admissions with a primary diagnosis of respiratory disease ... 39 Figure 10:- Graph of the age distribution of patients admitted for each ethnic group, expressed as a percentage of the total hospital admissions for each group in the dataset ... 40 Figure 11:- Graph of the age distribution of the population aged 60 and over for each ethnic group, as measured by the 2006 Census of population and dwellings ... 41 Figure 12:- Graph of the age distribution of patients aged 60 and over for each NZDep socioeconomic deprivation decile, expressed as a percentage of the total hospital admissions in the dataset for each decile. ... 41 Figure 13:- Monthly hospital admissions as a percentage of annual admissions, by age group, for all circulatory and respiratory related admissions... 42 Figure 14:- Monthly hospital admissions as a percentage of annual admissions, by age group, for
admissions with a primary diagnosis for circulatory disease ... 43 Figure 15:- Monthly hospital admissions as a percentage of annual admissions, by age group, for
admissions with a primary diagnosis for respiratory disease ... 43 Figure 16: - Monthly hospital admissions as a percentage of annual admissions, by main centres, for all circulatory and respiratory related admissions... 44 Figure 17:- Monthly hospital admissions as a percentage of annual admissions, by main centres, for admissions with a primary diagnosis for circulatory disease ... 45 Figure 18:- Monthly hospital admissions as a percentage of annual admissions, by main centres, for admissions with a primary diagnosis for respiratory disease ... 45 Figure 19:- Coefficient of seasonal variation in hospitalisations (CSVH) for each of eight main centres by year. For all circulatory and respiratory related admissions ... 46
x
Figure 20:- Coefficient of seasonal variation in hospitalisations (CSVH) for each of eight main centres by year. For admissions with a primary diagnosis of circulatory disease ... 47 Figure 21:- Coefficient of seasonal variation in hospitalisations (CSVH) for each of eight main centres by year. For admissions with a primary diagnosis of respiratory disease ... 47 Figure 22:- Histogram of daily admission rates for all respiratory and circulatory related admissions .... 48 Figure 23:- Monthly admissions as a percentage of annual admissions, by NZDep socioeconomic
deprivation deciles. For all circulatory and respiratory related admissions ... 54 Figure 24:- Monthly admissions as a percentage of annual admissions, by NZDep socioeconomic
deprivation deciles. For admissions with a primary diagnosis of circulatory disease ... 55 Figure 25:- Monthly admissions as a percentage of annual admissions, by NZDep socioeconomic
deprivation deciles. For admissions with a primary diagnosis of respiratory disease ... 55 Figure 26:- Mean length of admission by each of eight main centres and year, for all circulatory and respiratory related admissions ... 56 Figure 27:- Mean length of admission by each of eight main centres and year, for admissions with a primary diagnosis for circulatory disease ... 57 Figure 28:- Mean length of admission by each of eight main centres and year, for admissions with a primary diagnosis for respiratory disease ... 57 Figure 29:- Mean length of admission by age group and year, for all circulatory and respiratory related admissions ... 58 Figure 30:- Mean length of admission by age group and year, for admissions with a primary diagnosis of circulatory disease ... 59 Figure 31:- Mean length of admission by age group and year, for admissions with a primary diagnosis of respiratory disease ... 59 Figure 32:- Mean length of stay for each of 16 ICD primary diagnosis groups, for the all circulatory and respiratory related diagnosis group. ... 60 Figure 33:- Mean length of admission by month and diagnosis ... 61 Figure 34:- Length of admission in days, shown in a probability density histogram. Note that the length of admission axis is truncated at 30 days; this variable extends to a maximum of 120 days ... 62 Figure 35:- Graph of mean length of hospital admission for three admission groups, by NZDep
socioeconomic deprivation deciles ... 71 Figure 36:- Graph of mean length of hospital admission by NZDep socioeconomic deprivation deciles and month of admission ... 72 Figure 37:- Proportion of each deprivation decile that is Maori, Pacific or European/Other ethnicity, 1996 (Howden-Chapman, 2000, p. 15) ... 74 Figure 38:- Life expectancy at four ages, by deprivation decile, for the total New Zealand population, 1995-97 (Howden-Chapman, 2000, p. 22) ... 75
1
1
Introduction
1.1
General overview
An annual winter surge of hospital admissions stretches healthcare resources, both in New Zealand and in temperate climates internationally (Davie, Baker, Hales, & Carlin, 2007; Healy, 2003). Excess winter morbidity (EWMb) and mortality (EWM) is a well-documented phenomenon under which illness or death occurs at a greater rate during winter months, associated with lower outdoor temperatures. Winter mortality rates have been found to be 18% higher than non-winter rates in New Zealand, with evidence that the elderly are particularly vulnerable (Davie et al., 2007). The causal process for EWM and EWMb has not been established, although has been posited as a complex interaction of temporal, climatic and demographic factors.
There is a wealth of literature investigating EWM and EWMb, with the majority taking a disease-driven approach, reflecting an origin in medicine; however fewer studies focus on the cross-disease
phenomena (Telfar-Barnard, 2010). This thesis takes a broad approach to EWMb, looking at not only the temporal and climatic conditions driving the phenomenon in New Zealand, but also demographic and spatial covariates and confounders. Respiratory and cardiovascular illnesses are particularly sensitive to temperature and make up a significant proportion of winter excess mortality and morbidity (Wilkinson, 2001). EWM has been well studied across Europe, finding that populations residing in temperate climates such as the United Kingdom are more vulnerable to this phenomenon than those in more extreme winter environments such as Scandinavian countries (Healy, 2003; Keatinge et al., 1984; Laake & Sverre, 1996). It has been postulated that this is due to a physiological adaption by individuals residing in cold climates (Analitis et al., 2008; Keatinge, Donaldson, Bucher, Jendritsky, & al, 1997). New Zealand has a temperate climate with distinct regional differences, which lend well to a study of the spatial variation of EWM and morbidity. One prior study has analysed the spatiality of EWM in New Zealand, but looked at all causes of mortality and age groups together, and only divided the country into four regions (Davie et al., 2007).
2
The elderly are expected to comprise an increasing proportion of the total population in the near future, and this is expected to have adverse impact on the provision of social services, particularly health care (Cornwall & Davey, 2004; Stephenson & Scobie, 2002). It is worthwhile to understand where this population will interact with the healthcare system and how environmental conditions such as weather may impact their demand for health services (Ministry of Health, 2002; Nissen, New Zealand, & Statistics New Zealand, 2009).
1.2
Aims and Objectives
The primary aim was to categorise elderly populations that are vulnerable to excess winter morbidity and make policy recommendations to reduce burden on the healthcare system, by means of:
1. Understanding variation of excess winter morbidity amongst the elderly across New Zealand 2. Understanding how climate and socioeconomic deprivation are related to the variation in excess
winter morbidity amongst the elderly across New Zealand
3. Identifying factors affecting the length of stay for circulatory and respiratory disease related hospitalisations of the elderly in New Zealand
These objectives were achieved through the application of geospatial and statistical analysis to records of hospital admissions of the elderly in New Zealand for circulatory and respiratory disease. This thesis investigates the magnitude of EWMb and its relationship with demographic, temporal and climatic factors. Spatial variation in EWMb is explored by comparing hospital admissions across eight main centres throughout New Zealand.
1.3
Thesis outline
This thesis is arranged into six chapters – introduction, background, methodology, results, discussion and conclusion.
The introduction provides the broader context to the study, motivations behind the research, and outlines aims and objectives.
3
The background chapter will outline firstly the global context of EWM and EWMb by summarising individual and population level studies that measure and explain the phenomenon. There is a detailed summary and critique of methodologies previously employed in this field, along with a discussion of confounding factors that modify the relationship between winter, cold spells and mortality or morbidity. Finally, the New Zealand context is detailed with a description of the demographic changes anticipated with an ageing population, the subsequent impacts on demand for healthcare, and fiscal impact on the government.
The methodology chapter outlines the datasets and methods of analysis employed to investigate the objectives of the thesis. For each of the four major sources of data, there is a detailed description including an overview of how they have been collected, which variables they measure, and the steps taken to clean and process the data into a suitable form for analysis. A series of cold spell indicators was developed from a national climate database, and the rationale and process of developing of this process is explained. Eight main urban centres are the focus of analysis for spatial variation of hospitalisations, with a map and summary of these areas. Regression models were developed to relate hospital
admission rates and durations to the characteristics of patients, patient’s neighbourhoods, and climate. The process of developing these models is discussed with reference to the characteristics of the datasets and statistical literature.
The results chapter outlines findings of the analysis, arranged in three sections based upon the variables being analysed. The first section proffers summary statistics that describe the characteristics of patients in the hospital admissions dataset and the cold spell indicators. The second section analyses hospital admission rates, initially through summary statistics and graphical analysis, and then with the results of regression models for hospital admissions applied at a national and regional scale. The third section analyses hospital admission duration, with summary statistics initially, and then through regression analysis at a national and regional scale.
The discussion chapter takes results from the results chapter and places them in context with relevant literature and background statistics about the population. Findings are discussed in four main sections –
4
demography, long term changes, seasonality and temperature, and spatial patterns. The demography section looks at the covariance of age, ethnicity and socioeconomic deprivation, and how they affect patterns of hospitalisation. Changes in the characteristics of hospital admissions over the 18 years of data studies are discussed in the long term changes section. The seasonality and temperature section discusses how variation in hospital admissions and duration is associated with the winter season and cold spell indicators. Spatial patterns in hospital admissions are discussed with reference to spatial variation of demographic composition, and how spatial variation modifies the seasonality and
temperature relationships. The discussion is concluded with several suggestions for future research and a summary of the research implications.
The conclusion summarises the context of this research, the methodologies employed, and reiterates the results and implications.
5
2
Background
This chapter assesses background literature relevant to this thesis and provides context to the subsequent methodology chapter. The phenomenon of EWM and EWMb is first described with
reference to predominantly international literature. The issue of the ageing population is then described with particular reference to New Zealand statistics and literature.
2.1
Excess winter mortality and morbidity
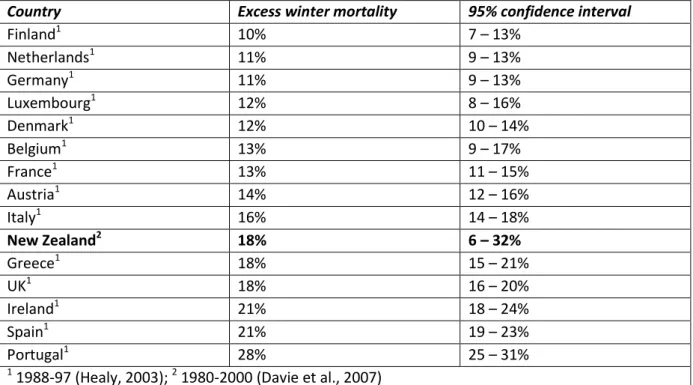
EWM or EWMb is a well-documented phenomenon under which deaths or illnesses respectively occur at a greater rate during the winter season. This is associated with, but not necessarily caused by, lower ambient temperatures. This results in higher demand for health services, however the causality beneath the relationship and options for mitigation have not been widely researched (Mercer, 2003). Extended stays in hospital by the elderly are commonly associated with this phenomenon and have a significant adverse effect on overall health service delivery (Dewar, 1999; Donaldson & Wedzicha, 2014). EWM and EWMb have been extensively studied at a population level, particularly in Europe, and have been demonstrated to vary significantly between countries. Table 1 summarises the magnitude of EWM across New Zealand and Europe, showing that with 18% higher mortality during the winter season, New Zealand is above the average level of EWM internationally. During cold spells, mortality was found to increase up to 12.8% in The Netherlands (Huynen, Martens, Schram, Weijenberg, & Kunst, 2001). Even small decreases in temperature are associated with increases in mortality, with a 10C fall in temperature below the annual mean associated with a 1.35% increase in natural deaths across Europe, and 1.5% increase in the United Kingdom alone (Analitis et al., 2008; Aylin et al., 2001). Extremely high temperatures during summer in some climates also have an adverse impact on health, resulting in a parabolic relationship whereby both extremely high and low temperature increase mortality and morbidity, with elderly more vulnerable to both than other age groups (Gouveia, 2003).
6
Table 1:- International comparison of excess winter mortality rates, comparing winter mortality rates to non-winter. Emphasis added to New Zealand to highlight the context of this research.
2.1.1
Theoretical foundation
Winter seasons are associated with lower temperatures and altered behaviours, which lead to a number of adverse health impacts. Respiratory and cardiovascular illnesses are particularly sensitive to falls in temperature, as well as viral and bacterial infections (Bull & Morton, 1978; Davie et al., 2007; World Health Organization, 1985). Part of the winter excess is hypothesised to result from physiological changes associated with temperature, including the higher level of energy expended to maintain body temperature (West & Lowe, 1976).
Circulatory and respiratory diseases exhibit strong seasonality, so even countries with low levels of these diseases can exhibit high levels of EWM and EWMb (Curwen, 1991; Fares, 2013). Cardiovascular disease, a subset of circulatory disease, is responsible for approximately 50% of deaths due to natural causes in developed countries, and are most prevalent in the elderly (Mercer, 2003). Chronic obstructive
pulmonary disease (COPD), which encompasses a group of respiratory diseases such as bronchitis and emphysema, is the fourth leading cause of death in New Zealand with acute exacerbations increasing during winter (Broad & Jackson, 2003; Donaldson & Wedzicha, 2014). Lower temperatures cause increases in the pressure and viscosity of blood, and increased concentration of fibrinogen, a blood
Country Excess winter mortality 95% confidence interval
Finland1 10% 7 – 13% Netherlands1 11% 9 – 13% Germany1 11% 9 – 13% Luxembourg1 12% 8 – 16% Denmark1 12% 10 – 14% Belgium1 13% 9 – 17% France1 13% 11 – 15% Austria1 14% 12 – 16% Italy1 16% 14 – 18% New Zealand2 18% 6 – 32% Greece1 18% 15 – 21% UK1 18% 16 – 20% Ireland1 21% 18 – 24% Spain1 21% 19 – 23% Portugal1 28% 25 – 31% 1
7
clotting agent. This induces an inflammatory reaction within the cardiovascular system which increases risk of acute cardiovascular diseases such as stroke and heart failure (Fares, 2013; Keatinge et al., 1984; Mercer, 2003; Vallance, Collier, & Bhagat, 1997).
Thermoregulatory behaviours of populations will vary significantly between locations, largely in response to climate, with residents of extremely cold climates taking a more rigorous approach to wearing appropriate clothing, and insulating and heating buildings (Donaldson, Ermakov, Komarov, McDonald, & Keatinge, 1998; Eng & Mercer, 1998). The winter season is also associated with changes in lifestyle behaviours which will also impact health. The winter season is associated with changes in physical activity and diet (Donaldson & Keatinge, 2002); decreased time spent outdoors, reducing absorption of Vitamin D and potentially weakening the immune system (Cannell et al., 2006); and an increased time spent in close proximity with others, increasing opportunities for the transmission of airborne viral and bacterial infections (Fares, 2013).
It has been suggested that elderly are more vulnerable to EWM not just because of generally poorer health, but specifically due to a reduced capability to regulate body temperature (Hong et al., 2003; Mercer, 2003; Wagner & Horvath, 1985). Elderly are more vulnerable to mortality from acute illness, with a study of influenza-like illness in Denmark finding that the elderly made up 88% of deaths (Nielsen, Mazick, Glismann, & Mølbak, 2011). Looking specifically at British elderly over the age of 65, Wilkinson et al. (2004) noted 31% higher mortality during the winter season.
In many cases, variation in EWM and EWMb between locations is not explained by variation in
temperature; this may be due to physiological adaption, whereby residents acclimatise to the extreme climates after sustained exposure. This hypothesis is supported by population level studies comparing EWM rates between different climates across Europe (Analitis et al., 2008; Bull & Morton, 1978;
Gordon, 2003; Keatinge et al., 1997; Kendrovski, 2006; Mercer, 2003; Monteiro, Carvalho, Góis, & Sousa, 2013). As an extreme example, one study of Yakutsk, Eastern Sibera, found no evidence of EWM despite extremely cold temperatures (Donaldson et al., 1998).
8
2.1.2
Methodologies
2.1.2.1
Mortality, morbidity or hospitalisation
Studies of excess winter mortality and morbidity investigate largely the same phenomenon, albeit at different stages, with mortality representing a more severe, uncommon outcome than morbidity.
Mortality studies tend to be more common, potentially due to mortality data being universally reported. Morbidity as a concept is well defined, however it cannot be measured directly (Thacker et al., 2006); instead excess winter hospitalisation (EWH), a subset of EWMb, is commonly used as proxy based on hospital admission records (Telfar-Barnard, 2010). Some studies have gained access to data on the rate of GP visits to gain an understanding of less severe instances of morbidity than hospitalisations,
although such data contains the noise of routine, minor GP visits in addition to acute weather related complaints (Hajat & Haines, 2002; Rudge & Gilchrist, 2005). EWM studies with a seasonal approach have used mortality or hospitalisation records to compare age standardised rates (ASR) of mortality or
morbidity between winter months and the remainder of the year (Bull & Morton, 1978; Crighton, Moineddin, Upshur, & Mamdani, 2003; Mann et al., 2009).
2.1.2.2
Length of admission
The length of hospital admission is a significant determinant of hospital costs and can vary significantly between diagnoses and societal groups. The level of socioeconomic deprivation in a patient’s residence can be a significant determinant; however the effect differs between diagnoses. Overall in New Zealand, patients from the least deprived areas spend longer in hospital on average than those from more deprived areas; however there is evidence that for patients admitted for treatment of severe mental illness or COPD, those from more deprived areas tend to spend longer in hospital (Abas, Vanderpyl, Robinson, Prou, & Crampton, 2006; Agboado, Peters, & Donkin, 2012; Ministry of Health, 2011). Maori patients tend to experience shorter hospital admissions than non-Maori; and men tend to experience longer admissions than woman in New Zealand (Ministry of Health, 2011). While the effect of
9
analysed the effect of environmental conditions on the average length of stay, despite the significant potential for impact on hospital operation. One UK study of hospital admissions for stroke in a predominantly elderly sample found no difference in length of admission between seasons despite finding higher admission rates in winter periods (Myint, Vowler, Woodhouse, Redmayne, & Fulcher, 2007).
2.1.2.3
Defining winter
Winter can be considered as purely a weather phenomenon associated with lower temperatures, or a broader set of behaviours associated with weather patterns. The most common approach in prior studies has been to define a winter period, typically of four months, and derive a ratio of mortality or morbidity rates during the winter period to the summer period or the remainder of the year. While this simple approach avoids the need for meteorological data, it simplifies adverse weather into a discrete time period, and does not take into account of the health impact of low temperatures at other times of the year. Furthermore, this method will understate the excess of winter morbidity in regions with heat-related morbidity during summer. Looking specifically at the impact of low temperatures rather than seasonality on EWM/Mb, some studies have taken a time series approach, developing cold spell indices that take into account the duration and severity of cold weather, and use temperatures as an
explanatory variable for daily or weekly mortality or morbidity rates to derive the relationship.
With the majority of studies conducted in the Northern Hemisphere, winter was commonly defined as December, January, February and March. This approach is used in deriving the Excess Winter Mortality Ratio (EWMR) or Index (EWMI) from Curwen (1991), which has been adopted by a number of
subsequent studies. Similar indices are referred to as Coefficient of Seasonal Variation in Mortality (CSVM) (Healy, 2003) and Excess Winter Death Index (EWDI) (Davie et al., 2007). Other studies refined this further in response to specific local climates, such as restricting the winter period as December and January (Maheswaran, Chan, Fryers, McManus, & McCabe, 2004). Alternatively, Rau (2006) in a
10
September. A New Zealand study compared a winter period of June to September to the remainder of the year, October to May (Davie et al., 2007).
2.1.2.4
Temperature
Studies following a time series approach of relating outside temperature to hospital admissions or mortality face the additional problem of accommodating for the time lag between falls in temperature and health events. Modelling this lag will account for the time taken for an individual to fall ill following a fall in temperature, as well as the time spent ill before they manifest in official statistics as a hospital admission or death. The lag effects of cold spells varies between conditions, with an increase in respiratory illnesses typically presenting after cold spells (Keatinge et al., 1997). An increase in stroke and heart attacks is typically observed 1-4 days following a fall in temperature (Bull & Morton, 1978; Hong et al., 2003), and pneumonia after a week (Bull & Morton, 1978). An increase in general
cardiovascular and respiratory complaints has been observed 6-15 days following a cold spell (Hajat & Haines, 2002). Analitis et al. (2008) noted increased mortality up to 23 days following a fall in
temperature. Studies of the impact of temperature on mortality have used regressions to standardise mortality to an average temperature and quantify the relative risk of death associated when
temperature deviates from the average (Gouveia, 2003; Keatinge et al., 1997). One study of Scotland found a 10C fall in temperature was associated with a 1% increase in mortality after a week (Gemmell, 2000). The relationship between health and temperature is not necessarily linear, so some studies have defined temperature thresholds in order to isolate insignificant falls in temperature. Hajat & Haines (2002) found that temperatures below 5 degrees Celsius were associated with strong increase in GP consultations. Threshold effects are more commonly accounted for in the more sophisticated approach of defining cold spells. The way in which temperature varies between locations (climate) is discussed subsequently in relation to the spatiality of EWM.
11
2.1.2.5
Cold spell
Falls in temperature of a mild nature or brief duration do not have the same adverse impact on health as sustained or severe cold spells, so a number of cold spell indices have been developed to consistently define and quantify cold spells. These indices vary in their thresholds for severity and duration; for instance the Australian index defines cold spells as at least four consecutive nights with a minimum temperature within the lowest 10th percentile (Monteiro et al., 2013). Bull & Morton (1978) found that falls in temperature sustained for 1-3 weeks were associated with increased rates for heart attacks, strokes and pneumonia in the United Kingdom. Monteiro et al., (2013) found that a number of cold spell indices were correlated with excess hospital admissions for COPD during winter in Porto, Portugal. Excess hospital admissions were discernible up to 15 days following the end of the cold spell, but not during the cold spell. Laake & Sverre (1996) found that variation in EWM between years in the UK was correlated with variation in average temperature. Monteiro et al., (2013) noted that the persistence of cold spells was a more important determinant of morbidity in the general population than the severity of the cold spell; however low absolute temperatures were a risk factor for vulnerable populations, such as the elderly.
2.1.2.6
Confounders
Given the broad range of social, environmental and housing factors related to EWM, the presence of confounders has been widely researched. Air pollution has been hypothesised as contributing towards EWM, however the complex relationship between air pollution and illness in general makes accurate quantification of confounders complicated, especially with wide variation in pollution and exposure found between seasons and even within small areas (Fares, 2013; Fukuda, Hider, Epton, Jennings, & Kingham, 2011). A study of 15 European cities found no evidence of air pollution impacting EWM (Analitis et al., 2008). The relationship between EWM and socioeconomic deprivation has been studied extensively in the UK, often testing the hypothesis that less wealthy households cannot afford sufficient home heating and are therefore more vulnerable to low temperatures. A number of both regional and
12
small area studies in the UK have found no correlation between socioeconomic deprivation and EWM (Aylin et al., 2001; Lawlor, Maxwell, & Wheeler, 2002; Maheswaran et al., 2004; Shah & Peacock, 1999; Wilkinson, 2001). This is despite a strong correlation between socioeconomic deprivation and
cardiovascular disease and respiratory illness which make up a significant portion of EWM (Crombie, Kenicer, Smith, & Tunstall-Pedoe, 1989; Feinstein, 1993). More generally, all-cause mortality exhibits a strong socioeconomic gradient in New Zealand, associated with differences between ethnic groups (Tobias & Yeh, 2006).
The circulation of influenza has a significant influence on winter morbidity (Nicholson, 2003), and studies have utilised data on influenza circulation as a control variable for morbidity (Donaldson & Keatinge, 2002; Gemmell, 2000; Wilkinson et al., 2004), however influenza supervision data in New Zealand is more suited to clinical rather than research purposes (Fukuda et al., 2011). Despite strong seasonality in mortality due to circulatory and respiratory illness, there was no evidence of seasonality in drug prescriptions for these illnesses in Ireland, possibly due to acute onset of these conditions leading to mortality (Moran, Johnson, & Johnson, 2000).
The relationship between outdoor temperatures and health can be mediated by indoor temperatures, which have been associated with higher EWM in New Zealand (Moller, 2011), although similar studies in the United Kingdom have found strongly mixed results (Aylin et al., 2001; Keatinge et al., 1997;
Wilkinson, 2001). The relationship between outdoor and indoor temperatures can be confounded by the thermal properties of homes and behaviours in heating, and thus the lower thermal quality of housing in temperate climates is often provided as an explanation of higher EWM in temperate climates. Few studies have attempted to control for housing quality, as few datasets exist with sufficient depth, breadth and accuracy (Rau, 2006; Telfar-Barnard, 2010; Wilkinson et al., 2004). One such study conducted in New Zealand found that although EWH in New Zealand was significantly associated with housing types, it was not associated with the age of construction, which itself is associated with the level of thermal insulation. New Zealand houses are typically large and poorly insulated and heated, although with increasing adoption of heating technology such as insulation and heatpumps, households have
13
tended towards warming their houses to warmer temperatures than previously (Howden-Chapman et al., 2009). The national census of dwellings indicates a distinct North-South gradient in heating, with dwellings in the colder Southern regions the least likely to not have a source of heating (Statistics New Zealand, 2013c).
2.1.2.7
Spatiality
Spatial variation in EWM has been well-studied in Europe, finding mixed results within the United Kingdom (Curwen, 1991; Laake & Sverre, 1996; Wilkinson et al., 2004), strong variation across Europe (Analitis et al., 2008), and a strong regional association within Sweden (Gyllerup, Lanke, Lindholm, & Scherstén, 1991). The only study of spatiality in New Zealand found no evidence, however this analysis divided the country into only four regions, with substantial heterogeneity within each; for instance one region encompassed the entire South Island (Davie et al., 2007). Distinct regional differences in
mortality in New Zealand have been documented, with higher life expectancy in predominantly urban regions compared to rural regions, possibly exacerbated by economic reform in 1980s which had a particularly adverse impact on rural areas (Pearce, Dorling, Wheeler, Barnett, & Rigby, 2006). Spatial differences will be confounded by compositional factors such as population health and housing quality, and contextual factors, particularly climate. Climate was associated with the most significant differences in winter excess; however absolute temperature did not explain variation between countries as often hypothesised. Instead, populations in more temperate climates appear to be more vulnerable to EWM or EWMb than those in particularly cold locations (Healy, 2003; Laake & Sverre, 1996). Differences in mortality and morbidity reporting exist between countries due to different legal regimes and diagnostic protocols (Crombie et al., 1989). Notwithstanding, valid comparisons can be made between diverse jurisdictions in terms of the relative magnitude differences between seasons (Healy, 2003).
2.2
Ageing population
The demographic profile of a nation is fundamental to the governmental planning, both in terms of demand for services and the supply of labour. The median age of the usually resident population in New
14
Zealand has increased from 32 in 1996 to 38 in 2013, and is projected to continue increasing (Statistics New Zealand, 2013c). This rapidly ageing population is expected to significantly increase demand for healthcare and social services whilst simultaneously decreasing the relative size of the labour market, and by association, reducing the proportion of taxpayers. With far higher utilisation of healthcare and social services by the elderly, patterns in the spatial distribution of elderly, driven by internal migration, may bear a significant impact on the provision of these services. As the elderly population increases in size, it is increasingly unsuitable to characterise and service the group homogenously; instead a more in depth understanding of elderly with higher needs is necessary. Ageing of the population is expected to continue until 2100, so permanent, long-term solutions are required to manage this change (Kowal, Towers, & Byles, 2014).
2.2.1
Demographic changes
Alongside other developed nations, New Zealand is experiencing strong population ageing, driven by decreasing fertility and rising life expectancy, and a significant cohort approaching older age en masse. A significant increase in births followed World War II, with the cohort born between 1946 and 1965 termed ‘baby-boomers’, who are beginning to enter older age (Commission for Financial Literacy and Retirement Income, 2013). With the absolute number of elderly people increasing whilst births and mortality is low, elderly are increasingly significantly as a proportion of the population. The population over the age of 60 is expected to increase from 19.2% to 28.8% by 2050, and those over the age of 80 are projected to increase 220% over this period (Kowal et al., 2014). Fertility rates have fallen since the baby-boomers were born, from 4.3 children per woman in 1961 to 2.1 in 2011; this is the minimum required to replace the population in the long term, discounting the impact of migration (Statistics New Zealand, 2013b). This has been driven by trends of woman having fewer children, having children at older ages, and in many cases forgoing childbirth altogether. Life expectancy has continued to increase in New Zealand, with the median life expectancy for a female born in 1940 of 78.3 years, rising to 86.4 for a female born in 1970 (Statistics New Zealand, 2014b). Migration drives population growth in New Zealand to a much higher degree than many other countries, and will become increasingly important to
15
growing the population in future. This are however a multitude of economic and social factors driving migration, both domestically and internationally, so it can be difficult to forecast and it can induce uncertainty in overall population forecasts (Department of Labour, 2007).
The baby boomer cohort in general is far healthier than previous cohorts, as demonstrated by sustained increases in life expectancy. However, as the elderly increase in size relative to the population, the absolute number of elderly with multiple significant health issues will increase and induce complexity and demand for health services (Bryant, Teasdale, Tobias, Chenung, & McHugh, 2004; Kowal et al., 2014).
2.2.2
Health demand
Individuals with poor health tend to demand more health services, and as poor health rises with age, so does health service demand (Bryant et al., 2004). Although the elderly population is expected to grow significantly, rates of morbidity among the elderly be mitigated as life expectancy and medicine advances. A number of distinct health trends are changing the types of health services demanded; for instance a growing awareness of healthy lifestyles has increased regular exercise and decreased smoking in some groups. However, this may be outweighed by an increase in diseases associated with obesity in other groups (Organisation for Economic Co-operation and Development, 2011).
As many comparable countries are undergoing this change simultaneously, it remains unclear exactly how increase in life expectancy will affect morbidity in New Zealand. The period of morbidity preceding death is of most interest in forecasting the impact of an ageing population on demand for health services.
The majority of health expenditure incurred on an individual across their lifetime is determined by the length and severity of morbidity preceding death, with health expenditure increasing exponentially after the age of 50, and a quarter of lifetime health expenditure incurred in the final year (Bryant et al., 2004; Wanless, 2002). Several theories with mixed empirical support have been put forward to predict how the onset of serious disability and illness will change as medical advances extend life expectancy, each hinging on assumptions around the age of morbidity onset, relative to the age of death (Cornwall &
16
Davey, 2004; Fries, 1980; Graham, Blakely, Davis, Sporle, & Pearce, 2004; New Zealand Treasury, 2012). The three broad scenarios are:
- The crisis, or expansion of morbidity scenario considers that the age of onset will remain constant even as life expectancy increases, resulting in an extended period of morbidity
- The receding horizon, or dynamic equilibrium scenario considers that the age of onset will be postponed by the same extent as life expectancy increases, such that the period of morbidity remains constant
- The compressed morbidity scenario considers that the onset of morbidity will be postponed substantially more than life expectancy increases, thus the period of morbidity preceding death will become shorter.
2.2.3
Fiscal impact
The makeup of society is changing as a result of population ageing; as elderly increase as a proportion of the population, the working population will decrease as a proportion of the population. This will affect government finances significantly, as the taxpaying population decreases at the same time as demand for health and social services increases. This is exemplified well by the median age, with which 50% of the population are older and younger; this is expected to increase from 37.4 in 2013 to 42.3 in 2050 (Kowal et al., 2014).
The dependency ratio of a society provides a simplified measure of the number of elderly relative to the working-age population, referred to in terms of the ratio of people aged 65+ to those aged 15-64. This measure belies many factors such as the age at which people choose to retire and rates of participation in the labour force, but provides some utility in understanding how society might provide for its elderly, both directly in terms of social and health service workers, and indirectly in terms of taxpayers. The dependency ratio is expected to fall from 5.0 in 2011 to 2.6 in 2036 (Commission for Financial Literacy and Retirement Income, 2013). Social norms and behaviours around retirement age will evolve over time; many individuals over the age of 65 will continue in paid employment; however it can be generally expected a significant proportion of the elderly age group will retire. The healthcare sector is particularly
17
concerned about the impact of this change on the ability to recruit staff in light of increased demand (Cornwall & Davey, 2004).
Healthcare costs are forecast to increase as the elderly comprise an increasing proportion of the population, and as advances in medicine extend the lives of those in poor health (Cornwall & Davey, 2004). Concurrently, developments in technology and treatment, spurring on ever-increasing patient expectations, will further stretch health funding as patients expect higher levels of service (Blank & Burau, 2010). In New Zealand, the government bear the majority of this burden, with 80% of total health expenditure incurred by the government (Bryant et al., 2004). The share of GDP consumed by publicly-funded health spending is projected to increase from 6.9% to 11.1% by 2060 (New Zealand Treasury, 2012). In future, a proportionately larger health budget will be supported by a proportionately smaller taxpaying population.
Hospitals represent a significant cost centre for public healthcare in New Zealand (New Zealand
Treasury, 2014), with acute admissions through the emergency department being particularly expensive (Adam, Evans, & Murray, 2003). The cost of a day spent in one of New Zealand’s five highest-tiered hospitals was estimated to cost $440 in 2005, excluding specific medical expenses such as diagnostics and medication (World Health Organization, n.d.). Accordingly, a considerable focus has been placed by successive governments on achieving cost efficiencies in this area, with a concerted focus to reduce the average length of hospital stay in the 1990s and 2000s (Malcolm, 2007). Following this has been a focus on avoiding unnecessary use of hospital emergency departments, largely in response to overcrowding and delays in treatment in emergency departments (Ardagh & Richardson, 2004).
18
3
Methodology
This chapter introduces the methods used throughout this research to meet the objectives identified in the introduction.
1. Understanding variation of excess winter morbidity amongst the elderly across New Zealand 2. Understanding how climate and socioeconomic deprivation contribute towards the variation in
excess winter morbidity amongst the elderly across New Zealand
3. Identifying factors affecting the length of stay for circulatory and respiratory disease related hospitalisations of the elderly in New Zealand
EWMb is analysed using an administrative datasets of hospital admissions across New Zealand in relation to historical climate data. Administrative records of deaths were of insufficient quality and detail for statistical analysis of EWM.
3.1
Data sources
Data was obtained from four major sources, outlined in Table 2 below.
Table 2:- Description of key datasets
Dataset Publisher Source
National Climate Database (‘CliFlo’)
National Institute of Water and Atmospheric Research (NIWA)
http://cliflo.niwa.co.nz/
Hospitalisations - National Minimum Dataset (NMDS)
Ministry of Health (MoH) Compact Disc Census of Population and
Dwellings
Statistics New Zealand (SNZ) http://www.stats.govt.nz/Census.aspx Index of Socioeconomic
Deprivation (NZDep)
Department of Public Health, University of Otago
http://www.otago.ac.nz/wellington/ departments/publichealth/
research/hirp/otago020194.html
3.1.1
Climate
The National Climate Database is administered by the National Institute of Water and Atmospheric Research (NIWA) and collates observations form 6500 climate stations across New Zealand since 1850, including 600 current stations (National Institute of Water and Atmospheric Research, 2014). For the
19
purposes of this study, analysis was restricted to the 78 stations with complete daily measurements of daily maximum and minimum temperatures for the period of 1996-2013, concordant with the period of hospitalisation incidents obtained from the Ministry of Health.
3.1.2
Hospitalisations
Data for hospitalisation incidents was obtained from the Ministry of Health (MOH) National Minimum Dataset (NMDS) which electronically records all public hospital admissions in New Zealand since 1993 (Ministry of Health, 2013). This study obtained anonymised records for all 1,733,343 hospital admissions meeting the following criteria:
- Admitted between 1996 and 2013 inclusive
- Acute admission
- Patient over the age of 60 at the time of admission
- Primary and/or secondary diagnosis coded as either o Diseases of the circulatory system
o Diseases of the respiratory system
The primary diagnosis associated with each admission is coded under the International Statistical Classification of Diseases and Related Health Problems (ICD) ninth revision (Ministry of Health, 2013). Given the prominence of respiratory and circulatory disease in EWMb, analysis was restricted to hospital events attributable to these diseases. Under the ICD ninth revision classification, these are classified as “Diseases of the circulatory system” and “Diseases of the respiratory system”, with a list of diseases comprised in each category described in Table 3 (World Health Organization, 1979). These two chapters contain both acute and chronic diseases, and it was anticipated that both will exhibit a relationship with temperature when analysis reflects the time for onset of chronic disease. This has been reflected in prior studies, where chronic diseases such as pneumonia have been associated with falls in temperature (Bull & Morton, 1978). The variables obtained for each hospitalisation event are described in Table 4.
20
Table 3:- List of sub categories within ICD circulatory and respiratory disease categories (World Health Organization, 1979)
Category Sub-category
Diseases of the circulatory system (ICD-9-CM-1 390-459)
Acute Rheumatic Fever
Chronic rheumatic heart disease Hypertensive disease
Ischemic heart disease
Diseases of pulmonary circulation Other forms of heart disease Cerebrovascular disease
Diseases of arteries, arterioles, and capillaries Diseases of veins and lymphatics, and other diseases of circulatory system
Diseases of the respiratory system (ICD-9-CM-1 460-519)
Acute respiratory infections
Other diseases of the upper respiratory tract Pneumonia and influenza
Chronic obstructive pulmonary disease and allied conditions
Pneumoconioses and other lung diseases due to external agents
Other diseases of respiratory system
Table 4: -Variables obtained on hospital admission records from the National Minimum Dataset (Ministry of Health, 2013)
Variable Description
Event end type code Describes the hospitalisation event, for instance discharge or death
Event start date Date of admission
Event end date Date of discharge or event end
Event end code Type of end to the admission, such as discharge
or death
Gender Patient gender when admitted
Age at admission Patient age when admitted
Domicile code (patient) Domicile of patient’s residence
Area unit code Census area unit of the patient’s residence
Census year Census year associated with area unit
Priority Ethnic code Ethnicity of patient, prioritised in the case of multiple ethnicities (SNZ prioritisation algorithm ranks minorities ahead of European ethnicities) Domicile code (facility) Domicile of health facility
Principal diagnosis code ICD code of principal diagnosis
21
3.1.3
Population
Population estimates were obtained from Statistics New Zealand (SNZ), which publishes the estimated resident population (ERP) at a sub-national level from the five-yearly Census of Population and
Dwellings. The interval between the 2006 and 2013 censes was extended due to the 2011 Christchurch earthquake in 2011 (Statistics New Zealand, 2013a). SNZ also produces yearly ERP counts to account for population change in the years between censes through a modelling process that adjusts census ERP counts with more frequent administrative data on births, deaths and migration (Statistics New Zealand, 2014c).
3.1.4
Deprivation
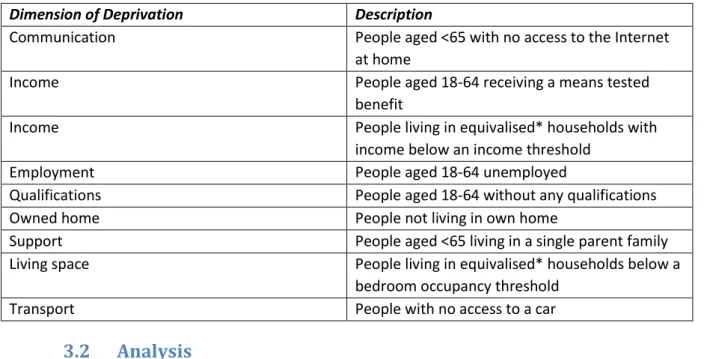
Socioeconomic deprivation at a small-area level is indicated by the series of NZDep indices developed following each national census. The NZDep index is derived at meshblock level, which is the smallest geographic areas defined by SNZ for the purpose of census collection, containing a median of 110 individuals in urban areas and 60 in rural areas (Statistics New Zealand, 2014a)). An aggregated form of NZDep was used to match the resolution of the NMDS data, using census area units (CAU), which contain a median of 2000 individuals (Statistics New Zealand, 2012). The NZDep index comprises an ordinal scale with a uniform distribution ranging from 1 to 10, where higher scores represent higher levels of deprivation relative to society as a whole, as measured by an accumulation of deficits (Atkinson, Salmond, & Crampton, 2014). The index is derived through a weighting process which combines nine census variables, as shown in Table 5. These variables have been changed over time to reflect changes in society, for instance communication was measured in terms of access to a telephone prior to 2013, but in 2013 was measured in terms of access to the internet (Atkinson et al., 2014).
22
Table 5:- Dimensions of deprivation from Census used in NZDep Index 2013 (Atkinson et al., 2014, p.8). *Equivalised households are adjusted to control for household composition
Dimension of Deprivation Description
Communication People aged <65 with no access to the Internet
at home
Income People aged 18-64 receiving a means tested
benefit
Income People living in equivalised* households with
income below an income threshold
Employment People aged 18-64 unemployed
Qualifications People aged 18-64 without any qualifications
Owned home People not living in own home
Support People aged <65 living in a single parent family
Living space People living in equivalised* households below a
bedroom occupancy threshold
Transport People with no access to a car
3.2
Analysis
3.2.1
Tools
RStudio 0.98.994 formed the core of analysis, with Microsoft Excel 2010 and ESRI ArcMap 10.2
processing some inputs and generating outputs. Cleaning, processing and analysis of the NMDS dataset was undertaken in RStudio, with summary datasets transferred into Excel for graphing. All other datasets were cleaned and processed in Excel prior to joining with the NMDS dataset in RStudio. Spatial analysis was undertaken in ArcMap before transfer into RStudio, and ArcMap was also used in mapping.
3.2.2
Temperature
The minimum temperature on each day at each of the 78 weather stations was compared with the 10th and 1st percentile for temperatures in the 28 days prior at that location. From this a dichotomous true or false variable indicated if the minimum for each day was within the coldest 10% or 1% for the preceding 28 days. The separate 10th and 1st percentile variables serve as an indicator of the severity of cold spells preceding an individual’s admission to hospital, with 1st percentile representing severe cold spells and 10th percentile representing moderate cold spells. This percentile approach was developed based on the indices identified in Monteiro et al. (2013), with the advantage that these indices are relative to each climate and therefore do not require specification of an arbitrary temperature threshold. Such an
23
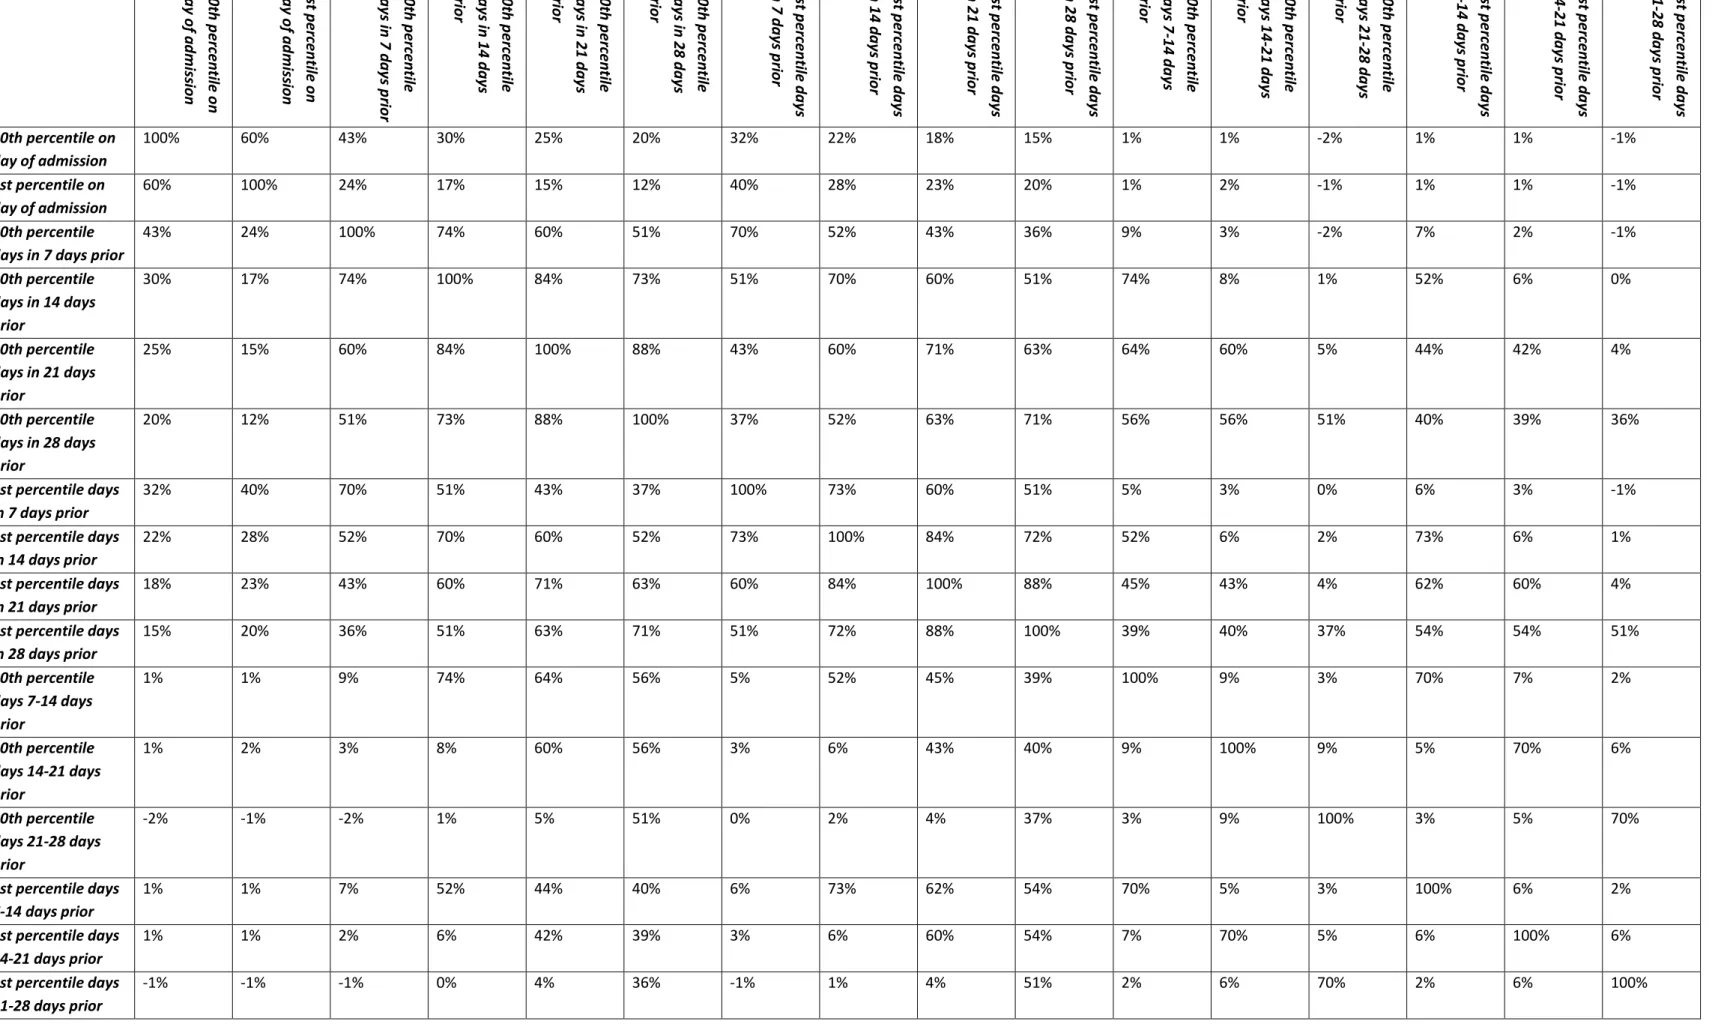
approach would have been inappropriate in comparing such diverse climates as those present across New Zealand. These Boolean counts of temperature in the 1st and 10th percentile were aggregated up to periods 1-7, 1-14, 1-21 and 1-28 days prior, to produce a count of the number of 1st and 10th percentile days in the preceding days to assess the cumulative impact of cold spells on hospital admissions. To assess the specific lagged impact of cold spells on hospital admissions, the number of 1st and 10th percentile days was aggregated for periods 7-14, 14-21 and 21-28 days prior. By definition, the 1st percentile indicators are effectively a subset of the 10th percentile indicators, so significant correlations were expected between the temperature indicators. In order to maintain the assumptions of regression, multicollinearity was investigated to avoid regression of sets of variables with significant levels of correlation. A correlation matrix with Pearson correlation coefficients was employed as the variables are linearly related. These coefficients were carefully considered in the process of regression model design.
3.2.3
Processing
3.2.3.1
Hospitalisations
Hospitalisation records from the NMDS dataset were cleaned, recoded and derived into new variables more appropriate to the topics of interest and suitable for regression analysis. After incomplete records were removed, admissions were grouped into one of three groups – all (1,704,317 admissions),
circulatory (166,938) and respiratory (62,495) diagnoses. The all diagnoses group included cases where the primary or secondary diagnosis was due to diseases of the circulatory or respiratory system. The circulatory and respiratory groups are subsets of the all diagnoses group, where the primary diagnoses was circulatory or respiratory respectively.
Records without a valid CAU code were removed, thus all incidents could be joined to the temperature records of their nearest weather station. The start and end date of each admission record were
subtracted to derive the length of admission in integer days, with admissions in excess of 120 days considered outliers and removed from the dataset. Patient ethnicity was aggregated to one of five broad ethnic groups – European, Maori, Pacific Islander, Asian or other. Dummy variables were
24
produced for Maori and Pacific Islander ethnicity groups as these were found to be significant factor in admissions. A dummy variable for winter admissions was derived in the manner described by (Davie et al., 2007), for admissions beginning during the four-month winter period of June-September.
3.2.3.2
Adding geography
Hospitalisations in the NMDS dataset were represented spatially through the CAU code of each patient’s residential address. The CAU was used to join hospitalisation records with other variables associated with specific geographic locations – temperature variables, socioeconomic deprivation, and population counts. All populated CAU were spatially joined the nearest weather station measured in terms of shortest Euclidean distance. From this, each admission record was attached to the cold spell indicators derived from the weather station nearest to the patient’s residence. Socioeconomic deprivation, as estimated by NZDep, is derived from five-yearly census data with each index an estimate of deprivation at the time of the census. Each hospital admission record was joined to the NZDep score of the patient’s CAU, as derived from the census administered closest to their date of admission. The five-yearly NZDep scores were interpolated as specified in Table 6.
Table 6:- Protocol for interpolating NZDep socioeconomic deprivation scores to hospital admissions Year (Census, NZDep index) Attributed to admissions beginning in
1996 1996 – 1998
2001 1999 – 2003
2006 2004 – 2009
2013 2010 – 2013
Analysis of admission rates requires a defined area with a known population and consistent admission count data. Daily admission counts for towns and small cities were too inconsistent for robust statistical analysis; hence admission rates were only derived for patients residing in one of the largest eight urban centres in New Zealand. Over half of the national population resides in one of these eight urban centres, summarised in Table 7 and illustrated in Figure 1. These eight main centres represented 1,011,351 admissions of patients in the all diagnosis group, 100,761 for the circulatory diagnosis group, and 39,679 for the respiratory diagnosis group. These main centres were defined following SNZ urban area
25
better reflect climatic relationship between CAU than the social boundaries of territorial authorities (Statistics New Zealand, 2003). Admissions were aggregated to one of the eight cities according to the CAU of the patient’s residence. Several of these main centres included more than one weather station; in these cases the average reading from each weather station was applied to all admissions originating from the urban area.
Table 7:- List of main urban areas used for analysis, listed in descending order of their populations as recorded by the 2013 national census
Main centre Population (2013 Census)
Auckland 1,418,000 Wellington 397,900 Christchurch 379,100 Hamilton 212,000 Napier-Hastings 125,300 Tauranga 123,500 Dunedin 119,100 Palmerston North 83,800
26
27
3.2.4
Admission rates
3.2.4.1
Age standardisation
ASR were derived from incident counts, the relevant area population from SNZ yearly ERP, and the World Health Organisation standard population age distribution (Ahmad et al., 2001). This was derived using 5-year age groups, to concord with SNZ ERP, with hospitalisations grouped according to the patient’s age on the date of admission. The SNZ annual ERP was used instead of the five year census ERP as using an out-of-date population can distort age-standardised rates where there are rapid changes in population. This was found in Auckland as the rapidly growing population lead to an overestimation of hospitalisation rates due to the underestimation of population from out-of-date census estimates.
3.2.4.2
Seasonal admission rates
In order to estimate the magnitude of EWH, ASR for hospitalisations were compared between the winter season of June to September and the remainder of the year through a morbidity rate ratio. This followed the Coefficient of Seasonal Variation in Mortality (CVSM) method outlined in Davie et al (2007) which adapts the method of Healy (2003) to a southern hemisphere climate such as that of New
Zealand. The adapted formula for the Coefficient of Seasonal Variation in Hospitalisation (CSVH) expresses the percentage that winter hospitalisations are higher than non-winter hospitalisations.
3.2.4.3
Monthly admission rates
Although age standardisation is preferable as it enables valid comparison of incidence between diverse populations, age standardisation is not possible where the age distribution of the underlying population is unknown (Ahmad et al., 2001). In the case of the NZDep index, which groups the population into deciles, the age distribution of the population in each decile is unknown. In these cases, hospital
admissions in each dimension were expressed as a proportion of all hospital admissions for the relevant decile. For example, hospital admissions for each month and NZDep decile were expressed as a
proportion of total hospital admissions for each decile, in order to demonstrate different seasonal patterns between deciles.