Broadband Infrastructure and Economic Growth
Nina Czernich
Oliver Falck
Tobias Kretschmer
Ludger Woessmann
CES
IFO
W
ORKING
P
APER
N
O
.
2861
C
ATEGORY6:
F
ISCALP
OLICY,
M
ACROECONOMICS ANDG
ROWTHD
ECEMBER2009
An electronic version of the paper may be downloaded
• from the SSRN website: www.SSRN.com
• from the RePEc website: www.RePEc.org
CESifo Working Paper No. 2861
Broadband Infrastructure and Economic Growth
Abstract
We estimate the effect of broadband infrastructure, which enables high-speed internet, on economic growth in the panel of OECD countries in 1996-2007. Our instrumental-variable model derives its non-linear first stage from a logistic diffusion model where pre-existing voice-telephony and cable-TV networks predict maximum broadband penetration. We find that a 10 percentage-point increase in broadband penetration raises annual per-capita growth by 0.9-1.5 percentage points. Results are robust to country and year fixed effects and controlling for linear second-stage effects of our instruments. We verify that our instruments predict broadband penetration but not diffusion of contemporaneous technologies like mobile telephony and computers.
JEL Code: O47, L96, K23.
Keywords: broadband, high-speed internet, technology diffusion, economic growth.
Nina Czernich
Ifo Institute for Economic Research at the University of Munich
Poschingerstrasse 5 Germany - 81679 Munich
czernich@ifo.de
Oliver Falck
Ifo Institute for Economic Research at the University of Munich
Poschingerstrasse 5 Germany - 81679 Munich
falck@ifo.de Tobias Kretschmer
Institute for Communication Economics University of Munich
Schackstrasse 4 Germany - 80539 Munich
t.kretschmer@lmu.de
Ludger Woessmann
Ifo Institute for Economic Research at the University of Munich
Poschingerstrasse 5 Germany - 81679 Munich
woessmann@ifo.de
1 December 2009
The research underlying this paper has been partially supported by Deutsche Telekom AG. The views expressed are those of the authors and do not necessarily reflect the views of Deutsche Telekom AG. Comments by Matthias Doepke, Mario Larch, Monika Piazzesi, Martin Schneider, and Michèle Tertilt are gratefully acknowledged.
1
1. Introduction
High-speed internet access via broadband infrastructure has developed rapidly worldwide since the late 1990s. Broadband infrastructure allows the generation and distribution of decentralized information and ideas in markets increasingly relying on information as an input. In light of modern theories of endogenous growth (e.g., Romer 1990), this should accelerate economic growth by facilitating the development and adoption of innovation processes. In this way, broadband infrastructure may differ not only from other types of public infrastructure such as roads and bridges, but also from more traditional telecommunications infrastructure. While the latter’s impact on economic growth has been analyzed before (Röller and Waverman 2001), the new growth theories suggest that the growth effects of modern communication networks that have emerged since may have a different quality. Voice-telephony infrastructure has a coordination function and reduces transaction costs for existing businesses. On top of that, high-speed internet via broadband infrastructure may accelerate the distribution of ideas and information and foster competition for and development of new products, processes, and business models, thereby further facilitating macroeconomic growth.
In this paper, we test the effect of broadband infrastructure on economic growth using an annual panel of 25 OECD countries in 1996-2007 (broadband introduction started in 1997 in the first country). Considering that broadband penetration may be endogenous to the growth process, our empirical identification builds on the idea that broadband roll-out tends to rely on traditional voice-telephony and cable-TV networks. Therefore, we specify a technology diffusion model in which variations in the ceiling of the broadband diffusion curve across countries are determined by the extent of the pre-existing traditional networks. Using only the part of the variation in broadband penetration that can be predicted by this diffusion model, we find a significant positive effect of broadband introduction and penetration on economic growth. Our instrumental-variable results suggest that a 10 percentage-point increase in the broadband penetration rate results in a 0.9-1.5 percentage-point increase in annual per-capita growth.
Broadband internet and the underlying infrastructure fulfill many characteristics of a general purpose technology (GPT) that fundamentally changes how and where economic activity is organized (Harris 1998; Helpman and Trajtenberg 1998). With its potential to facilitate decentralized information processing and to support new working modes (Bloom and Van
2
Reenen 2007; Bloom, Kretschmer, and Van Reenen 2009), broadband may constitute a special technology with an impact on growth distinct from other technologies emerging around the same time. High-speed internet via broadband infrastructure facilitates the spatial distribution of large batches of information that previously had to be collocated, which in turn allows for new business models and collaboration of firms producing specialized inputs. This can lead to lower entry barriers and higher market transparency, thereby increasing both labor productivity and market competition and ultimately economic growth. Thus, some casual observers have linked the fact that OECD countries have grown substantially in the late 1990s and early 2000s to the contemporaneous emergence of broadband (OECD 2000).
Indeed, we show that there is a significant positive association between broadband deployment and economic growth in the panel of OECD countries since the mid-1990s. However, this simple association may be driven by reverse causality and omitted variables. First, individuals in high-income countries may also have a high ability to pay for broadband services, resulting in more rapid broadband penetration. Second, state intervention in telecommunications might depend on the level of economic development in a country, thus confounding the effect of regulation and sectoral policies with the effect of broadband diffusion. Third, given the rapid technological change in the last decades, broadband diffusion took place at the same time as the diffusion of other technologies like mobile telephony and computers (Comin, Hobijn, and Rovito 2008), making it difficult to isolate the specific effect of broadband.
To address these problems, we develop an instrumental-variable (IV) approach based on the fact that broadband deployment takes place alongside existing infrastructure elements, which creates path dependencies given the pre-existing heterogeneity in infrastructure across countries. Thus, our first-stage model is based on a diffusion model of broadband technology in which the extent of pre-existing fixed-line telephony and cable-TV networks determines the maximum reach of the broadband network in each country. These existing networks only affect the supply side of broadband diffusion and therefore rule out demand-side effects due to differences in wealth and growth and policy-induced effects. Drawing on the large literature on technology diffusion models (e.g., Geroski 2000), we specify a logistic diffusion curve where maximum broadband penetration is limited by the extent of the traditional networks. Combining these pre-existing instruments with the logistic shape of the diffusion curve allows us to predict broadband penetration in a country over time. The predicted values
3
of the broadband penetration rate from this non-linear first stage help us identify the effect of broadband on economic growth in the second stage.
We specify two types of second-stage models. In the first, GDP per capita is modeled as a function of a dummy for broadband introduction in a difference-in-differences specification. Our IV results show that GDP per capita is about 2.7 to 3.9 percent higher on average after than before broadband introduction, controlling for country and year fixed effects. The second type of the second-stage model specifies a classical cross-country growth model where the broadband penetration rate is added as a determinant of the growth rate of GDP per capita. We find that an increase in the broadband penetration rate by 10 percentage points increases annual per-capita GDP growth by 0.9 to 1.5 percentage points over our sample period.
Our results are robust to the inclusion of country and time fixed effects as well as a number of control variables and to the specific set of countries in our sample. Given that our first-stage model is non-linear, we can include our instruments linearly in the second-stage model, which again does not affect our results. Further, we show that our instruments indeed determine the ceiling for broadband but not the diffusion of other potentially growth-enhancing technologies like mobile telephony and computers diffusing at about the same time. These results confirm the validity of our instruments and underline the causal character of the growth effect of broadband infrastructure.
The remainder of the paper is organized as follows. Section 2 briefly summarizes prior work on broadband and economic growth. Section 3 introduces a simple growth regression framework and our database and presents results on the association between broadband penetration and economic growth. Section 4 develops our IV approach, presents results on the causal effect of broadband penetration on economic growth, and tests for instrument validity and robustness. Section 5 concludes.
2. Literature on Broadband and Economic Growth
Theories of endogenous growth model the generation and distribution of ideas and information as the key driver of economic growth (Lucas 1988; Romer 1990; Aghion and Howitt 1998). Against this background, high-speed internet via broadband infrastructure may affect the innovative capacities of the economy through development of new products, processes, and business models to promote growth. Moreover, cheaper information dissemination can facilitate the adoption of new technologies devised by others, which again
4
promotes economic growth (Nelson and Phelps 1966; Benhabib and Spiegel 2005). This also suggests that spillovers of codified knowledge across firms and regions may constitute another channel by which information technology in general and broadband deployment in particular affect economic growth.1
Broadband internet enables the exchange of data across multiple locations and aids decentralized information processing (see Hayek 1945 for a conceptualization of the importance of decentralized information processing). Every actor in an economic system uses existing information as an input to generate new informational output. During information processing, the actor can enrich and evaluate the initial information due to experience and a different perspective and understanding, which eventually leads to a multiplication of information for the benefit of all actors. Beyond the reduction of costs of existing business processes arising from the emergence of telecommunications infrastructure for voice telephony, high-speed internet enables the emergence of new business and firm-cooperation models that rely on the spatial exchange of large batches of information, which fosters competition and innovation processes. On the demand side, broadband internet may increase market transparency and thus additionally intensify competition.
Broadband infrastructure, when combined with information technologies, can also affect firm productivity and economic growth in additional ways. The development of information technologies fundamentally changed and improved the processing of information, resulting in significant productivity growth of IT-using firms (Stiroh 2002; Jorgensen, Ho, and Stiroh 2008). The recent literature on productivity effects of information technologies (IT) also recognizes that these effects depend on how information technologies are used and on the presence of complementary inputs such as skilled labor (Autor, Levy, and Murnane 2003) or organizational structure and practices (Bresnahan, Brynjolfsson, and Hitt 2002; Bloom and Van Reenen 2007; Bloom, Kretschmer, and Van Reenen 2009). The isolated analysis of a firm’s IT investment on productivity might also neglect positive interactive effects of a firm’s IT investments with broadband internet connecting actors across locations. For example, e-procurement, e-billing, online recruitment, and customer services are activities that are only possible through both firm-level IT investment and economy-level broadband infrastructure.
1 By contrast, Audretsch and Feldman (1996) show that spillovers of tacit knowledge are regionally bound as
5
Although broadband infrastructure as a general purpose technology may have a more far-reaching effect on economic growth than other, possibly similar technologies,2 previous studies on earlier infrastructure technologies serve as a useful reference point both in methodological terms as well as in assessing the impact of broadband on economic growth. The effects of public infrastructure on growth found in the pioneering work by Aschauer (1989) have been criticized to be upward biased due to common time trends, reverse causality, omitted variables, and simultaneity. Subsequent analyses find effects of public infrastructure investment on growth that range from zero to effects that are comparable in size to the effects found by Aschauer (for overviews, see Munnell 1992 and Gramlich 1994). Furthermore, Fernald (1999) shows that investment in (road) infrastructure can only explain one-off, unrepeatable shifts in productivity but not permanent shifts in productivity growth. Closest to our study, Röller and Waverman (2001) analyze how voice telecommunications infrastructure affects economic growth across 21 OECD countries in the 1970s and 1980s. They use a simultaneous equation model to integrate demand and supply in the telecommunications sector into the aggregate economy. A country’s surface area and its government deficit identify the supply side of the model, as the surface area directly affects the size of the telecommunications network to be built and the government deficit determined governments’ financial ability to invest in telecommunications infrastructure at a time when state monopolies dominated in the telecommunications sector in most countries. Röller and Waverman (2001) find that about one third of growth in OECD countries over the period 1971-1990 can be attributed directly or indirectly to telecommunications. While their estimates are a prime example of addressing causality issues in macroeconomic growth analyses, their period of observation could not yet cover the diffusion of broadband technology, which we study in our paper. As argued above, broadband infrastructure may affect economic growth in different ways from traditional telecommunications infrastructure. The association between broadband infrastructure and economic development has also been examined in two policy reports, Crandall, Lehr, and Litan (2007) and Gillett, Lehr, Osorio, and Sirbu (2006). Both reports exploit differences in broadband development across U.S. states and find positive associations between broadband penetration and different economic outcome variables such as employment, wages, and housing prices. However, these results
2 Crafts (2004) shows that the contribution of steam power as an example of GPT to productivity growth has
been considerable and probably exceeds the productivity and growth effects of public infrastructure investment (Gramlich 1994).
6
cannot be interpreted as causal effects as both studies lack an empirical strategy to identify the role of broadband causally.
3. Model Framework, Data, and Descriptive Evidence
3.1 A Simple Growth Regression Framework
We start from a simple macroeconomic production function with constant returns to scale and the three inputs physical capital, human capital, and labor. Following Mankiw, Romer, and Weil (1992), the steady state is given by:
it it
it i
it A s h n
y log 1log 2log 3
log = +β +β +β (1)
Here, yit is GDP per capita in country i at time t, sit is the propensity to accumulate physical
capital, hit is average human capital accumulation of the workforce, and nit is the growth rate
of the workforce. Finally, Ai is the state of the technology in country i. In this framework, the
empirical observation of continuous growth in per-capita GDP can be expressed by a technological state that persistently increases over time and thus drives economic growth. Assuming that the technological state evolves along an exponential growth path over time, it can be written as:
t
it Ae i
A = 0 λ (2)
where λi is the growth parameter of technological progress for country i.
Assuming that the distribution of ideas and information via broadband internet increases the development of and competition for new products and processes and facilitates the adoption of new technologies devised by others, we expect broadband infrastructure to affect the growth parameter λi. To determine the effect of the introduction of broadband on economic
growth, we start with the following simple specification:
it t
it α α1D
λ = + (3)
Here, αt are year dummies and Dit is a binary variable equal to one after country i has
introduced broadband. This yields a difference-in-differences specification of equation (1):
it it it it it t i it D s h n y =α +α +α1 +β1log +β2log +β3 +ε log (4)
7
Thus, α1 gives the effect of the introduction of broadband introduction on GDP per capita, αi
capture country-specific effects, and εit is an error term.
The preceding specification assumes that there is a permanent shift in GDP per capita once broadband has been introduced. While this may be true if most benefits from broadband originate from availability and from early adopters, broadband penetration in the entire economy may also positively affect economic growth by continuously spurring innovation processes. To model the effect of broadband diffusion on economic growth, we write
i
i α α1B
λ = + (5)
Here Bi is the broadband penetration rate, i.e., the share of the population that has subscribed
to broadband in country i. Taking first differences, this results in a modified equation (1) in which we additionally control for initial GDP per capita yi0, i.e., one year before the first
appearance of broadband (Barro 1991):
it B it i it it it it it B s h n y T y =α +α +β Δ +β Δ +β Δ +β +β +ε
Δlog 1 1 log 2 log 3 4log 0 5 (6)
We are primarily interested in the effects of persistent differences in broadband penetration rates among countries. We therefore control for the catching-up in broadband diffusion by including the years since broadband introduction in a country, B
it
T . This ensures that we only
compare rates of broadband penetration at the same point in the diffusion process, which may differ across countries.
3.2 Data for OECD Countries
Broadband penetration is measured as the number of broadband subscribers per 100 inhabitants, provided by the OECD Broadband Portal. A broadband line is defined as a line (DSL, cable, fiber, or other) that offers download speeds of at least 256 kbit/s. The first country in our sample (Canada) started rolling out broadband in 1997. To start our analyses in the year before any broadband introduction, our first observation year is 1996.
All data on economic performance are taken from the OECD Economic Outlook and are available until 2007. Real GDP is expressed in 2000 Purchasing Power Parity (PPP) and normalized by the working-age population, defined as the population aged 15-64 years, to control for demographic differences among countries. The propensity to accumulate physical capital is proxied by the ratio of real private non-residential fixed capital formation to real
8
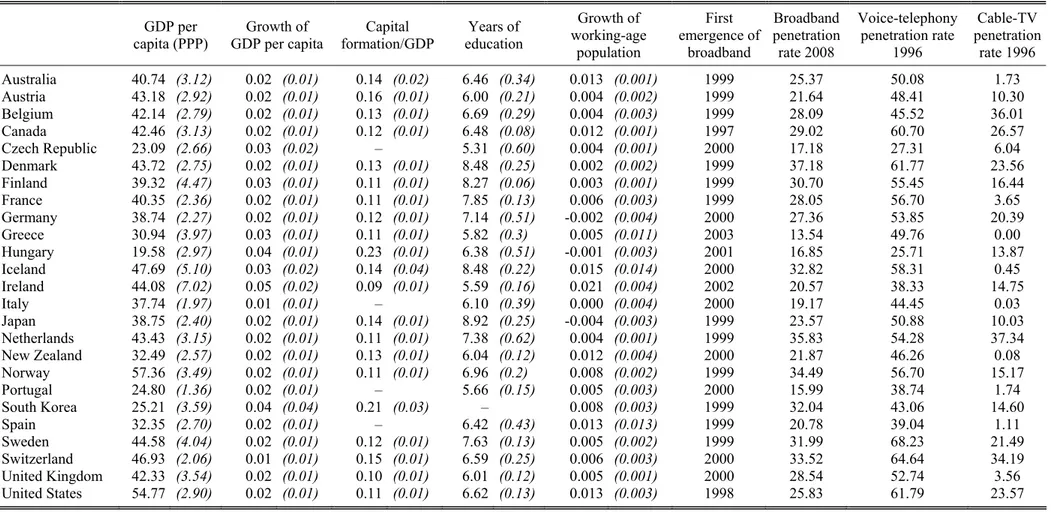
private GDP. Human capital accumulation of the workforce is proxied by the average number of years of schooling of the population aged 15-64 (from OECD Education at a Glance). Complete data are available for a panel of 20 OECD countries on an annual basis in 1996-2007 (see Table 1 for the list of countries). In models that do not control for investment and education, we can add five more countries with missing data on these control variables (the Czech Republic, Italy, Portugal, South Korea, and Spain).3 Table 1 provides descriptive statistics for the countries in our sample.
In addition to the variables described above, Table 1 also reports the year of broadband introduction and the broadband penetration rate in 2008. Broadband first emerged in most countries in the years 1999 and 2000. There are some early adopters – Canada (1997) and the United States (1998) – and some late adopters – Greece (2003), Hungary (2001), and Ireland (2002). In 2008, the three leading countries in terms of broadband subscribers per 100 inhabitants were Denmark (37.2%), the Netherlands (35.8%), and Norway (34.5%). Greece (13.5%), Portugal (16.0%), and Hungary (16.8%) have the lowest penetration in our sample. 3.3 The Association between Broadband and Economic Growth
Table 2 reports estimation results of equation (4) that models the effect of broadband introduction on GDP per capita in a difference-in-differences framework that contains fixed effects for each country and year. Model 1 refers to our sample of 20 OECD countries with complete data. Model 2 provides results for the same 20-country sample, but without controls for physical and human capital accumulation and working-age population growth. Changes in physical and human capital accumulation might be the result of innovation, e.g., labor saving technological progress leading to capital deepening and skill-biased technological change (Caroli and Van Reenen 2002). These innovations might in turn be the result of the introduction of broadband. Thus, including the above-mentioned controls suggests that Model 1 estimates a lower bound of the growth-enhancing effect of broadband. Model 3 replicates Model 2 with the full sample of 25 countries.
3 Among the OECD countries, this excludes only Luxembourg (for reasons of size) and Mexico, Poland, the
Slovak Republic, and Turkey, which do not have the required control variables and have GDP per capita and broadband penetration rates substantially below all other OECD countries.
Table 1: Descriptive Statistics
capita (PPP) GDP per GDP per capita Growth of formation/GDP Capital education Years of working-age Growth of population First emergence of broadband Broadband penetration rate 2008 Voice-telephony penetration rate 1996 Cable-TV penetration rate 1996 Australia 40.74 (3.12) 0.02 (0.01) 0.14 (0.02) 6.46 (0.34) 0.013 (0.001) 1999 25.37 50.08 1.73 Austria 43.18 (2.92) 0.02 (0.01) 0.16 (0.01) 6.00 (0.21) 0.004 (0.002) 1999 21.64 48.41 10.30 Belgium 42.14 (2.79) 0.02 (0.01) 0.13 (0.01) 6.69 (0.29) 0.004 (0.003) 1999 28.09 45.52 36.01 Canada 42.46 (3.13) 0.02 (0.01) 0.12 (0.01) 6.48 (0.08) 0.012 (0.001) 1997 29.02 60.70 26.57 Czech Republic 23.09 (2.66) 0.03 (0.02) – 5.31 (0.60) 0.004 (0.001) 2000 17.18 27.31 6.04 Denmark 43.72 (2.75) 0.02 (0.01) 0.13 (0.01) 8.48 (0.25) 0.002 (0.002) 1999 37.18 61.77 23.56 Finland 39.32 (4.47) 0.03 (0.01) 0.11 (0.01) 8.27 (0.06) 0.003 (0.001) 1999 30.70 55.45 16.44 France 40.35 (2.36) 0.02 (0.01) 0.11 (0.01) 7.85 (0.13) 0.006 (0.003) 1999 28.05 56.70 3.65 Germany 38.74 (2.27) 0.02 (0.01) 0.12 (0.01) 7.14 (0.51) -0.002 (0.004) 2000 27.36 53.85 20.39 Greece 30.94 (3.97) 0.03 (0.01) 0.11 (0.01) 5.82 (0.3) 0.005 (0.011) 2003 13.54 49.76 0.00 Hungary 19.58 (2.97) 0.04 (0.01) 0.23 (0.01) 6.38 (0.51) -0.001 (0.003) 2001 16.85 25.71 13.87 Iceland 47.69 (5.10) 0.03 (0.02) 0.14 (0.04) 8.48 (0.22) 0.015 (0.014) 2000 32.82 58.31 0.45 Ireland 44.08 (7.02) 0.05 (0.02) 0.09 (0.01) 5.59 (0.16) 0.021 (0.004) 2002 20.57 38.33 14.75 Italy 37.74 (1.97) 0.01 (0.01) – 6.10 (0.39) 0.000 (0.004) 2000 19.17 44.45 0.03 Japan 38.75 (2.40) 0.02 (0.01) 0.14 (0.01) 8.92 (0.25) -0.004 (0.003) 1999 23.57 50.88 10.03 Netherlands 43.43 (3.15) 0.02 (0.01) 0.11 (0.01) 7.38 (0.62) 0.004 (0.001) 1999 35.83 54.28 37.34 New Zealand 32.49 (2.57) 0.02 (0.01) 0.13 (0.01) 6.04 (0.12) 0.012 (0.004) 2000 21.87 46.26 0.08 Norway 57.36 (3.49) 0.02 (0.01) 0.11 (0.01) 6.96 (0.2) 0.008 (0.002) 1999 34.49 56.70 15.17 Portugal 24.80 (1.36) 0.02 (0.01) – 5.66 (0.15) 0.005 (0.003) 2000 15.99 38.74 1.74 South Korea 25.21 (3.59) 0.04 (0.04) 0.21 (0.03) – 0.008 (0.003) 1999 32.04 43.06 14.60 Spain 32.35 (2.70) 0.02 (0.01) – 6.42 (0.43) 0.013 (0.013) 1999 20.78 39.04 1.11 Sweden 44.58 (4.04) 0.02 (0.01) 0.12 (0.01) 7.63 (0.13) 0.005 (0.002) 1999 31.99 68.23 21.49 Switzerland 46.93 (2.06) 0.01 (0.01) 0.15 (0.01) 6.59 (0.25) 0.006 (0.003) 2000 33.52 64.64 34.19 United Kingdom 42.33 (3.54) 0.02 (0.01) 0.10 (0.01) 6.01 (0.12) 0.005 (0.001) 2000 28.54 52.74 3.56 United States 54.77 (2.90) 0.02 (0.01) 0.11 (0.01) 6.62 (0.13) 0.013 (0.003) 1998 25.83 61.79 23.57
Notes: Means and standard deviations (in parentheses) for economic indicators over the years 1996 to 2007. Economic indicators stem from the OECD Economic Outlook.
Data on years of schooling are taken from OECD Education at a Glance. Data on the emergence and diffusion of broadband are from the OECD Broadband Portal. Data on telephone access lines and on cable-TV subscribers in the year before the first emergence of broadband are taken from ITU World Telecommunication/ICT Indicators Database; broadband first emerged in Canada in 1997. Capital formation/GDP refers to the ratio of real private non-residential fixed capital formation to real private GDP. Years of education refer to the population aged 15-64. Broadband penetration rate refers to broadband subscribers per 100 inhabitants. Voice-telephony penetration rate refers to telephone access lines per 100 inhabitants. Cable-TV penetration rate refers to cable-TV subscribers per 100 inhabitants.
Table 2: Broadband Introduction and GDP per Capita
Dependent variable: Log of GDP per capita Model 1 Model 2 Model 3
Dummy broadband introduction 0.023** 0.025** 0.019**
(2.59) (2.62) (2.09 )
Log of capital formation/GDP 0.110**
(2.35)
Log of years of education 0.083
(0.54)
Growth of working-age population -0.006
(0.01)
Country dummies yes yes yes
Year dummies yes yes yes
Constant 3.644*** 3.563*** 3.492***
(13.03) (255.64) ( 304.32)
R2(within) 0.86 0.85 0.84
Observations 240 240 300
Countries 20 20 25
Notes: OLS estimation for 1996-2007. Sample of OECD countries. Five countries drop from the full model due to lack of data on control variables. Robust t statistics in
11
The coefficient of the broadband introduction dummy is positive and significant in all three models. It is slightly larger in Model 2 without controls than in Model 1, as expected. The results suggest that after a country has introduced broadband, GDP per capita is on average between 1.9 and 2.5 percent higher than before its introduction, controlling for country and year fixed effects.
Table 3 reports estimation results of equation (6) that models the effect of broadband diffusion on growth in GDP per capita in a standard cross-country growth regression framework. Again, Models 1 and 2 use the 20-country sample, where Model 1 includes changes in physical and human capital accumulation and population growth and Model 2 does not. Model 3 again uses all 25 countries. The coefficient on the broadband penetration rate is positive and significant in all three specifications. The coefficient estimate is again larger in the model without controls. The magnitude of the coefficients suggests that a ten percentage-point increase in the broadband penetration rate is associated with an increase in the annual growth rate of GDP per capita by 0.65 to 0.91 percentage points.
However, the results of both sets of regressions cannot be interpreted as causal effects of the introduction and diffusion of broadband. As discussed above, the timing of broadband introduction and its subsequent diffusion may depend on the demand of the population for new technologies or sector-specific regulation in telecommunications, which may bias the OLS results.
4. The Causal Effect of Broadband Infrastructure on Economic Growth
4.1 Instrumental Variables Derived from a Technological Diffusion Model
The associations between broadband and economic growth reported so far may suffer from different sources of endogeneity bias. One concern is reverse causality, in that both the year of broadband introduction and its subsequent penetration may be endogenous and depend on economic development. In wealthy countries, the demand of the population for new technologies might drive the emergence and diffusion of broadband. This is in line with Comin and Hobijn (2004), who provide evidence that most of the 20 technologies they study over two centuries are adopted first in advanced economies and subsequently trickle down to countries that lag economically.
Table 3: Broadband Diffusion and Growth of GDP per Capita
Dependent variable: Growth of GDP per capita Model 1 Model 2 Model 3
Broadband penetration rate 0.065*** 0.091*** 0.083***
(3.08) (4.31) (3.03)
Years since broadband introduction -0.003*** -0.004*** -0.003**
(2.95) (3.89) (2.59)
Growth of capital formation/GDP 0.069***
(6.76)
Growth of years of education -0.007
(0.30) Δ Growth of working-age population -0.231
(1.06) GDP per capita in 1996 -0.001*** -0.001*** -0.001*** (3.90) (3.97) (3.68) Constant 0.049*** 0.053*** 0.046*** (6.98) (7.68) (8.60) R2 0.30 0.19 0.11 Observations 240 240 300 Countries 20 20 25
Notes: OLS estimation for 1996-2007. Sample of OECD countries. Five countries drop from the full model due to lack of data on control variables. Broadband penetration
rate measured as broadband subscribers per 100 inhabitants; broadband line refers download speeds of at least 256 kbit/s. Robust t statistics in parentheses. Significance at *
13
Another source of endogeneity may be state intervention in the telecommunication sector. State intervention will typically depend on economic development in a country, thus confounding the effect of regulation with the effect of broadband diffusion. This issue has become evident in the response to the economic crisis in 2008 and 2009, when the governments of many countries initiated economic stimulus packages to dampen the economic downturn and stimulate growth. Many of these packages emphasize investments in high-speed internet and promote the roll-out of broadband networks (OECD 2009).
We address these endogeneity concerns using an instrumental-variable (IV) approach based on the fact that most commonly used broadband standards (e.g. ADSL, VDSL) rely on the copper wire of the voice-telephony network or the coaxial cable of the cable-TV network between the main distribution frame or the street cabinet and the household. In countries where fiber is rolled out to the homes (i.e., broadband via fiber-to-the-home, FTTH), the existing ducts of the traditional networks are used to reduce deployment cost of broadband. In other words, access to one of these existing infrastructure elements built for other purposes than the provision of broadband is necessary for economically viable fixed-line broadband roll-out. These existing elements are therefore relevant instruments for fixed-line broadband deployment to determine its causal effect on economic growth. We thus assume that the maximum reach of broadband γi (i.e., the ultimate “ceiling” of broadband penetration) is
determined by the extension of the voice-telephony and cable-TV networks that existed prior to broadband infrastructure: 0 2 0 1 0 _ i _ i
i γ α tel net α cable net
γ = + + (7)
To represent the extent of the traditional telecommunication and cable networks, we use the number of telecommunication access lines per 100 inhabitants in the year 1996 (tel_neti0) and
the number of cable-TV subscribers per 100 inhabitants in 1996 (cable_neti0), i.e., in the year
before the first country introduced broadband. Data on telecommunication access lines and cable-TV subscribers are taken from the International Telecommunications Union (ITU) World Telecommunication/ICT Indicators Database. The last two columns of Table 1 provide descriptive statistics on both variables. The number of telecommunication access lines per 100 inhabitants in 1996 ranges from 25.7 in Hungary to 68.2 in Sweden. The number of cable-TV subscribers per 100 inhabitants in 1996 ranges from 0.03 in Italy to 37.3 in the Netherlands.
14
Based on the work of Griliches (1957), a large body of research has found that the extensive margin of the diffusion of a new technology in country i at time t is best described through a logistic curve of the following form (Geroski 2000; Comin, Hobijn, and Rovito 2006):4
it i it t B ε τ β γ + − − + = )) ( exp( 1 (8)
Again, Bit is the broadband penetration rate in the population. The diffusion curve can be
characterized by the parameters γ, β, and τ that determine the maximum broadband penetration level (saturation level), the diffusion speed, and the inflexion point of the diffusion process, respectively. At the inflexion point τ, the diffusion curve has its maximum growth rate β/2. εit is an error term.
Inserting equation (7) into equation (8), we obtain a non-linear first-stage equation. Based on non-linear least squares estimation, we calculate from this equation counterfactual values of broadband penetration that are determined purely by exogenous factors. We then use these predicted values of broadband penetration rates in our second-stage growth regressions. We also calculate the predicted year of broadband introduction for each country from this diffusion curve. Here, we use the year in which predicted broadband penetration reaches one percent as the predicted year of introduction of broadband. Using a non-linear first stage to generate fitted values that are subsequently used in the second-stage equation is not innocuous because it generates consistent estimates only if the non-linear first-stage model is correctly specified (Angrist and Krueger 2001). However, the vast empirical literature on technology diffusion confirming the logistic shape of the diffusion process (Geroski 2000) provides confidence in the specific non-linear model. Moreover, our first-stage diffusion model allows us to obtain time-variant predicted values of broadband penetration rates even though the instruments are time-invariant.
4.2 Instrumental-Variable Results
The first stage of our IV model is a logistic model of technology diffusion, estimated by non-linear least squares. Models 1 and 2 of Table 4 present the parameter estimates of the first-stage regressions using both the 20-country and the 25-country sample. In both samples, the size of the voice-telephony network and the size of the cable-TV network have statistically
4 While the logistic form tends to capture the extensive margin of diffusion (the take-up of users) – as measured
in our paper – very well for a vast number of technologies, Comin, Hobijn, and Rovito (2006) show that it does not capture the intensive margin of diffusion (reflecting the intensity of use) for many technologies well.
15
significant positive effects on the saturation level γi of the broadband diffusion curve in a
country. The F-tests of joint significance (26.7 and 32.2, respectively) reject the null hypothesis of both coefficients jointly being zero. The logistic shape provides a very good fit to the broadband diffusion process across countries, and the average inflexion point of the diffusion curve is estimated around the year 2004. The same holds if the control variables of the second-stage model (investment, education, and population growth) are added (Model 3).5
To illustrate the broadband diffusion curves and the fit of our first-stage models, Figure 1 plots the actual and predicted values of the broadband penetration rate for the sample of 25 OECD countries. The logistic shape of the diffusion process of broadband technology is directly visible in most countries. There is no joint pattern in the deviation of the predicted values of broadband penetration from actual values across countries. For example, in South Korea all predicted values are below the actual values, while in Germany the predicted values are consistently above the actual values. In South Korea, the government has exerted great financial effort to roll out fiber-to-the-home, resulting in high actual broadband penetration rates, which is not reflected in the predicted values. In contrast, given the high penetration rate of the cable-TV network in Germany, predicted broadband penetration rates are higher than the actual values. However, in Germany the cable-TV network was owned by the incumbent telephone network operator until 2003, which had little incentive to update the cable network for broadband purposes. After the sale of the cable network by the incumbent following pressure by the European Commission, broadband via cable networks has been evolving since 2005. Both examples show that state intervention plays an important role for broadband diffusion. However, from a political-economy perspective, these interventions might simply be the reaction to unsatisfactory developments in a country, making such interventions endogenous (Duso and Röller 2003). Our instrumental-variable approach is designed to avoid these confounding effects.
5 The results reported below are based on Models 1 and 2 without additional control variables, as the two stages
Table 4: The Diffusion Curve: First Stage of the Instrumental-Variable Model
Dependent variable: Broadband penetration rate Model 1 Model 2 Model 3
Voice-telephony penetration rate 0.585*** 0.487*** 0.653***
(6.16) (4.59) (7.24)
Cable-TV penetration rate 0.279** 0.301** 0.334**
(2.11) (2.54) (2.47)
Diffusion speed (β) 0.647*** 0.623*** 0.613***
(15.60) (13.36) (9.15)
Inflexion point (τ) 2.004.531*** 2.004.532*** 2.004.485***
(10423.78) (10508.86) (7939.33)
Log of capital formation/GDP 0.035**
(2.24)
Log of years of education 0.034*
(2.08)
Growth of working-age population 0.347
(0.86)
Constant (γ0) -0.057 0.002 -0.104**
(1.25) (0.04) (2.25)
R2 0.96 0.93 0.95
F-test (cable-TV pen. rate = voice-tel. pen. rate = 0) 26.69 32.18 31.92
Observations 260 325 240
Countries 20 25 20
Notes: Non-linear least squares estimation for 1996-2008. Diffusion speed and inflexion point do not vary across countries. By contrast, the saturation level is country-specific and is a linear function of the voice-telephony penetration rate and the cable-TV penetration rate in the year before the first emergence of broadband. Model 3 contains additive control variables and is for 1996-2007. Sample of OECD countries. Five countries drop from the full model due to lack of data on control variables. Robust t statistics in parentheses. Significance at * 10%, ** 5%, *** 1% level.
Figure 1: Broadband Diffusion in OECD Countries: Actual and Predicted Curves 0 .2 .4 0 .2 .4 0 .2 .4 0 .2 .4 0 .2 .4 1995 2000 2005 2010 1995 2000 2005 2010 1995 2000 2005 2010 1995 2000 2005 2010 1995 2000 2005 2010
Australia Austria Belgium Canada Czech Republic
Denmark Finland France Germany Greece
Hungary Iceland Ireland Italy Japan
Netherlands New Zealand Norway Portugal South Korea
Spain Sweden Switzerland United Kingdom United States
Actual broadband rate
Predicted broadband rate
Year
Notes: Actual and predicted broadband penetration rates over 1996-2008 for 25 OECD countries. Predicted values are derived from non-linear least squares estimations of a diffusion curve as reported in Table 4. Diffusion speed and inflexion point do not vary across countries. By contrast, the saturation level is country-specific and is a linear function of telephone access lines per 100 inhabitants and cable-TV subscribers per 100 inhabitants in the year before the first emergence of broadband.
18
Results of the second-stage model that estimates GDP per capita as a function of broadband introduction in a difference-in-differences framework (i.e. equation (4)) are reported in Models 1-3 of Table 5. In all three model specifications, broadband introduction (as predicted by the first-stage diffusion model) has a strongly significant positive effect on GDP per capita. To account for the fact that broadband penetration is itself the result of a (non-linear) first-stage estimation, standard errors are bootstrapped (500 repetitions) in this and the subsequent models. Across our three model specifications, the results imply that after the introduction of broadband, GDP per capita was 2.7 to 3.9 percent higher than before, controlling for country and year fixed effects. In all three specifications, the IV results are slightly larger than in the OLS regressions, suggesting that the OLS regressions are downward biased. However, only in Model 3 is the difference between OLS and IV estimates statistically significant.
To test the assumption of this difference-in-differences approach that countries that have not (yet) introduced broadband and countries that have introduced broadband had the same time trends before broadband introduction, Models 4-6 additionally include “placebo introduction dummies” for points in time before the introduction of broadband that is actually predicted. Specifically, the models include placebo introduction dummies for two and three years before broadband introduction, i.e., before the predicted broadband penetration rate reached 1 percent.6 The placebo introduction dummies do not enter the model significantly. What is more, the effect of broadband introduction on GDP per capita is hardly affected at all by the inclusion of the placebos. Similarly, placebo introduction dummies for two and three years after actual broadband introduction (not shown) do not enter the model significantly and do not change the result on actual broadband introduction.7
6 We do not include the placebo dummy for one year before introduction because in some countries
counterfactual broadband penetration rates in this year are very similar to those in the counterfactual year of introduction. The maximum of the broadband penetration rate in the year before introduction was 0.99 percent, while the minimum in the year of introduction was 1.003 percent, making the difference somewhat arbitrary. In contrast, the counterfactual broadband penetration rate for two years before introduction has a maximum value of 0.53 percent.
Table 5: The Effect of Broadband Introduction on GDP per Capita: Second Stage of the Instrumental-Variable Model
Dependent variable: Log of GDP per capita Model 1 Model 2 Model 3 Model 4 Model 5 Model 6 Predicted broadband introduction 0.027*** 0.031*** 0.039*** 0.028*** 0.031*** 0.039***
(2.84) (3.18) (4.56) (2.79) (3.10) (4.60)
Log of capital formation/GDP 0.107** 0.108**
(2.11) (2.13)
Log of years of education 0.088 0.088
(0.61) (0.60)
Growth of working-age population 0.043 0.028
(0.06) (0.04)
Dummy 2 years before broadband introduction 0.006 0.007 -0.001
(1.14) (1.18) (0.11)
Dummy 3 years before broadband introduction 0.010* 0.009 0.001
(1.93) (1.63) (0.11)
Country dummies yes yes yes yes yes yes
Year dummies yes yes yes yes yes yes
Constant 3.627*** 3.563*** 3.492*** 3.627*** 3.561*** 3.492***
(12.10) (65.67) (61.41) (12.05) (65.11) (61.22)
R2(within) 0.86 0.85 0.84 0.86 0.85 0.84
Observations 240 240 300 240 240 300
Countries 20 20 25 20 20 25
Notes: Second-stage estimation for 1996-2007. The year of broadband introduction is predicted from the first-stage diffusion curve reported in Table 4, referring to the year in which the predicted broadband penetration rate was larger than 1%. Sample of OECD countries. Five countries drop from the full model due to lack of data on control variables. Bootstrapped z statistics in parentheses. Significance at * 10%, ** 5%, *** 1% level.
20
Our alternative second-stage model in equation (6) is based on a standard growth regression framework. As shown in Models 1-3 of Table 6, (first-stage predicted) broadband diffusion has a statistically significant positive effect on growth in GDP per capita. An increase in the broadband penetration rate by ten percentage points increases annual per-capita growth rates by 0.9 to 1.5 percentage points. To provide an example, 10 percentage points is approximately the difference in the broadband penetration rates between Germany and the leading OECD countries in 2003. Thus, a simple counterfactual thought experiment suggests that if in Germany broadband penetration had increased by 10 percentage points in 2003, GDP per capita would have been 3.7 to 5.9 percent higher in 2007. As in the previous model, the IV coefficients on broadband are larger than in the OLS regressions, with the difference being statistically significant in Models 2 and 3, but not in the full Model 1.
Models 4-6 add time lags in the growth-enhancing effect of broadband. This is based on the idea that the effect of dissemination and processing of information enabled by new broadband infrastructure may not show immediately but may take some time. The coefficients are hardly larger (1.2 to 1.6 percentage point growth contribution) than the baseline results in Models 1-3, suggesting that nearly the whole growth-enhancing effect of broadband appears already contemporaneous to the diffusion of broadband.
In Table 7, we add a full set of country fixed effects to the growth regression. In this specification, identification comes only from variation in growth rates within countries over time. Still, we can identify significant positive effects of the broadband penetration rate on growth rates which are rather precisely identified and, in the case of the first two models, even larger than without the country fixed effects. Models 4-6 additionally include time dummies for three-year intervals (1999-2001, 2002-2004, and 2005-2007, with 1996-1998 as the reference time period) to capture different phases of global economic growth. Again, the estimated effect of broadband diffusion on growth in per-capita GDP is hardly affected.
Table 6: The Effect of Broadband Diffusion on Growth of GDP per Capita: Second Stage of the Instrumental-Variable Model
Dependent variable: Growth of GDP per capita Model 1 Model 2 Model 3 Model 4 Model 5 Model 6 Predicted broadband penetration rate 0.092*** 0.135*** 0.145***
(3.57) (5.27) (4.10)
Lagged predicted broadband penetration rate 0.116*** 0.156*** 0.159***
(4.05) (5.20) (4.49)
Years since predicted broadband introduction -0.003*** -0.005*** -0.005*** -0.004*** -0.005*** -0.004***
(3.92) (5.40) (4.03) (4.66) (5.53) (4.24)
Growth of capital formation/GDP 0.069*** 0.071***
(5.73) (5.28)
Growth of years of education -0.004 -0.018
(0.19) (1.18)
Δ Growth of working-age population -0.18 -0.227
(0.77) (0.98) GDP per capita in 1996 -0.001*** -0.001*** -0.001*** -0.001*** -0.001*** -0.001*** (6.06) (6.57) (4.38) (7.01) (7.24) (4.18) Constant 0.052*** 0.056*** 0.049*** 0.057*** 0.060*** 0.050*** (10.29) (11.59) (8.36) (11.72) (12.33) (7.74) R2 0.29 0.19 0.12 0.35 0.25 0.14 Observations 240 240 300 220 220 275 Countries 20 20 25 20 20 25
Notes: Second-stage estimation for 1996-2007. Broadband penetration rates and year of broadband introduction are predicted from the first-stage diffusion curve reported in Table 4. Sample of OECD countries. Five countries drop from the full model due to lack of data on control variables. Bootstrapped z statistics in parentheses. Significance at
Table 7: The Effect of Broadband Diffusion on Growth of GDP per Capita: Instrumental-Variable Results with Fixed Effects
Dependent variable: Growth of GDP per capita Model 1 Model 2 Model 3 Model 4 Model 5 Model 6 Predicted broadband penetration rate 0.125*** 0.170*** 0.133*** 0.135*** 0.162*** 0.118*
(2.97) (4.23) (2.79) (2.63) (3.62) (1.85)
Years since predicted broadband introduction -0.004*** -0.006*** -0.004*** -0.004** -0.005*** -0.005**
(2.92) (3.98) (2.61) (2.13) (2.65) (2.55)
Growth of capital formation/GDP 0.061*** 0.068***
(4.04) (4.56)
Growth of years of education 0.003 0.002
(0.14) (0.11)
ΔGrowth of working-age population -0.248 -0.242
(1.03) (1.10)
Country dummies yes yes yes yes yes yes
Year controls no no no yes yes yes
Constant 0.027*** 0.029*** 0.028*** 0.024*** 0.028*** 0.026***
(8.37) (9.56) (10.94) (7.84) (8.86) (9.05)
R2(within) 0.27 0.15 0.06 0.30 0.17 0.10
Observations 240 240 300 240 240 300
Countries 20 20 25 20 20 25
Notes: Second-stage estimation for 1996-2007. Broadband penetration rates and year of broadband introduction are predicted from the first-stage diffusion curve reported in Table 4. Models 4-6 include dummies for three-year time intervals (1999-2001, 2002-2004, and 2005-2007; 1996-1998 is the reference interval). Sample of OECD countries. Five countries drop from the full model due to lack of data on control variables. Bootstrapped z statistics in parentheses. Significance at * 10%, ** 5%, *** 1% level.
Table 8: The Effect of Broadband Diffusion on Growth of GDP per Capita: Critical Mass Specification
Dependent variable: Growth of GDP per capita Model 1 Model 2 Model 3
Predicted broadband penetration rate -0.103 -0.061 0.099
(0.94) (0.55) (0.84)
Years since predicted broadband introduction -0.001 -0.003 -0.005**
(0.62) (1.55) (2.37)
Dummy for predicted broadband penetration rate ≥ 0.1 -0.013 -0.012 0.002
(1.23) (1.05) (0.19)
Interaction (broadband pen. rate ≥ 0.1) * broadband pen. rate 0.188* 0.200** 0.044
(1.90) (2.00) (0.44)
Dummy for predicted broadband penetration rate ≥ 0.2 0.009 0.012 0.011
(0.64) (0.84) (0.80)
Interaction (broadband pen. rate ≥ 0.2) * broadband pen. rate -0.052 -0.075 -0.057
(0.71) (0.97) (0.73)
Growth of capital formation/GDP 0.067***
(5.59)
Growth of years of education -0.001
(0.04) Δ Growth of working-age population -0.213
(0.90) GDP per capita in 1996 -0.001*** -0.001*** -0.001*** (5.56) (6.11) (4.25) Constant 0.052*** 0.056*** 0.049*** (10.11) (11.40) (8.40) R2 0.31 0.21 0.13 Observations 240 240 300 Countries 20 20 25
Notes: Second-stage estimation for 1996-2007. Broadband penetration rates and year of broadband introduction are predicted from the first-stage diffusion curve reported in Table 4. Dummies for having passed 10% and 20% broadband penetration rates as well as interactions of these dummies with the broadband penetration rates are included to test for network externalities. Sample of OECD countries. Five countries drop from the full model due to lack of data on control variables. Bootstrapped z statistics in parentheses. Significance at * 10%, ** 5%, *** 1% level.
24
Communication infrastructure is sometimes argued to be subject to network effects. As a consequence, the effect of broadband infrastructure on economic growth may not be linear. Specifically, broadband penetration may need to reach a “critical mass” to realize its full impact on economic growth. To test for this, we include interaction terms of the predicted broadband penetration rate and step dummies for having reached at least 10 and 20 percent broadband penetration rates. Note that broadband penetration rates range between 13.5 and 37.2 percent in 2008. The results of this specification are reported in Table 8. While multicollinearity among the different broadband measures hampers precise identification, in this specification a statistically significant positive effect of broadband penetration on economic growth emerges only when the 10 percent threshold is passed. Reaching values above 20 percent broadband penetration does not have an additional effect beyond the effect of 10 percent penetration.
4.3 Tests for Instrument Validity and Robustness
Existing networks for voice telephony and cable TV were completed well before the introduction of broadband and were installed for purposes other than broadband use, i.e., for voice telephony and the transmission of TV signals. Given that we measure the extent of the voice-telephony and cable networks in 1996, they are pre-determined when considering broadband diffusion. However, pre-determination does not necessarily constitute exogeneity in the econometric sense. In this section, we analyze whether the voice-telephony and cable networks might have an independent direct effect on economic growth or affect economic growth through other channels than broadband.
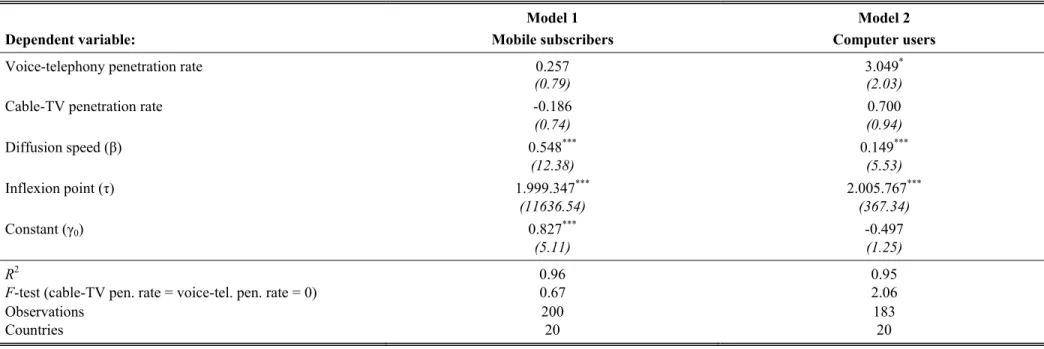
In principle, our instruments – the extension of the traditional telephone and cable networks – might not only affect the deployment of the broadband network but also the diffusion of other growth-enhancing technologies, such as mobile telephony (Gruber and Verboven 2001; Koski and Kretschmer 2005) and computers (Caselli and Coleman 2001). To test if this is true, we consider the diffusion of mobile telephony and computers which also emerged in the 1990s. We consequently estimate diffusion curves following equation (8) for mobile telephony and computers where the ceiling γi is again determined by the penetration of the traditional
fixed-line telephone network and the cable-TV network. Data on the number of mobile-telephony subscribers per 100 inhabitants and computer users per 100 inhabitants are taken from the ITU World Telecommunication/ICT Indicators Database. The results are reported in Table 9. We find no significant effects of penetration of the traditional networks on the diffusion of
25
mobile telephony and computers. Voice telephony and cable TV only determine broadband diffusion and not the diffusion of other potentially growth-enhancing technologies, underlining the validity of our instruments.
Fixed-line voice telephony could also have a direct effect on growth (Röller and Waverman 2001). However, the direct effect of fixed-line voice telephony is expected to weaken with upcoming substitutes such as mobile telephony and voice-over-IP telephony, so that the direct effect of fixed-line voice telephony is likely to have subsided in our period of analysis, starting in the late 1990s.8 Moreover, our models control for the initial level of GDP per capita in 1996, the year before broadband was first introduced, which would capture any potential indirect effects of voice-telephony and cable-TV networks on GDP per capita growth through past GDP per capita.
Still, the non-linear form of our first stage allows us to test for any effects that the fixed-line voice-telephony and cable-TV networks might have on growth. In Model 1 of Table 10, we include the number of telecommunication access lines per 100 inhabitants in 1996 and the number of cable-TV subscribers per 100 inhabitants in 1996 in addition to the predicted broadband penetration as potential separate growth determinants in the second stage of our growth model. In this model, identification of the effect of broadband on growth relies on the fact that our first stage is non-linear while the second stage is a linear model, and not on excluded variables. In line with our argument that the direct impact of traditional fixed-line voice telephony on economic growth will have subsided by 1996, both the share of telecommunication access lines and the share of cable-TV subscribers are insignificant. In contrast, broadband penetration still has a significant positive effect of similar magnitude as in our baseline IV specification.
8 According to OECD (2007) figures, the time spent on public switched telephone network (PSTN) calls is
declining in most OECD countries. For example, the number of PSTN minutes declined by 44% between 2003 and 2005 in Iceland and by more than 20% in Austria and Belgium. Among these minutes are increasing cases of users making calls to mobiles.
Table 9: Traditional Networks and the Diffusion of Mobile Telephony and Computers
Model 1 Model 2
Dependent variable: Mobile subscribers Computer users
Voice-telephony penetration rate 0.257 3.049*
(0.79) (2.03)
Cable-TV penetration rate -0.186 0.700
(0.74) (0.94) Diffusion speed (β) 0.548*** 0.149*** (12.38) (5.53) Inflexion point (τ) 1.999.347*** 2.005.767*** (11636.54) (367.34) Constant (γ0) 0.827*** -0.497 (5.11) (1.25) R2 0.96 0.95
F-test (cable-TV pen. rate = voice-tel. pen. rate = 0) 0.67 2.06
Observations 200 183
Countries 20 20
Notes: Non-linear least squares estimation for 1996-2005. Diffusion speed and inflexion point do not vary across countries. By contrast, the saturation level is country-specific and is a linear function of telephone access lines per 100 inhabitants and cable-TV subscribers per 100 inhabitants in the year before the first emergence of broadband. Sample of OECD countries. Five countries drop from the full model due to lack of data on control variables. Robust t statistics in parentheses. Significance at * 10%, ** 5%, *** 1%
Table 10: Additional Robustness Specifications
Dependent variable: Growth of GDP per capita Model 1 Model 2a Model 3 Model 4
Predicted broadband penetration rate 0.090*** 0.104*** 0.084*** 0.097***
(3.26) (3.57) (3.29) (3.64)
Years since predicted broadband introduction -0.003*** -0.004*** -0.003*** -0.004***
(3.75) (3.78) (3.99) (3.98)
Voice-telephony penetration rate -0.009
(0.95)
Cable-TV penetration rate -0.003
(0.37)
Trade openness 0.007***
(2.83)
Log of years of education -0.009
(1.22)
Growth of capital formation/GDP 0.069*** 0.070*** 0.073*** 0.069***
(5.47) (5.07) (6.14) (5.54)
Growth of years of education -0.002 -0.001 -0.008 0.0004
(0.09) (0.03) (0.35) (0.02)
ΔGrowth of working-age population -0.174 -0.196 -0.195 -0.179
(0.75) (0.78) (0.87) (0.76) GDP per capita in 1996 -0.001*** -0.001*** -0.001*** -0.001*** (4.94) (5.44) (4.59) (5.84) Constant 0.054*** 0.053*** 0.042*** 0.067*** (8.80) (9.58) (6.96) (4.56) R2 0.23 0.29 0.32 0.30 Observations 240 216 240 240 Countries 20 18 20 20
Notes: Second-stage estimation for 1996-2007. Broadband penetration rates and year of broadband introduction are predicted from the first-stage diffusion curve reported in Table 4. Sample of OECD countries. Five countries drop from the full model due to lack of data on control variables. Bootstrapped z statistics in parentheses. Significance at *
28
As an additional aspect, one might argue that countries that are prone to competition, market liberalization, deregulation, and international trade may also have had a highly developed voice-telephone and cable-TV network. To test for this, we exclude Canada and the United States from our sample as in all other countries, the preexisting networks were deployed by state monopolies. Thus, remaining countries seem to share similar attitudes towards market liberalization and regulation at least in the telecommunication sector.9 We further control for trade openness as measured by the sum of imports and exports over GDP, since broadband deployment might also reflect the level of openness and connectedness of a country. Data on imports and exports are from the OECD Economic Outlook. Both excluding Canada and the United States (Model 2 in Table 10) and adding trade openness (Model 3) does not change our basic result of broadband having a positive and economically meaningful effect on economic growth.
Cross-country analyses on technology diffusion demonstrate that the adoption of new technologies is associated with high levels of human capital (Caselli and Coleman 2001; Caroli and Van Reenen 2002). Models of endogenous growth (Lucas 1988; Romer 1990; Aghion and Howitt 1998) further state that the effect of human capital is not limited to increased labor productivity. Human capital also increases the innovative capacity of an economy, which in turn results in new processes and products, consequently promoting growth. Therefore, one could argue that the diffusion of broadband may proxy for the level of human capital. To test for this, we include the average number of years of schooling of the working-age population in levels in addition to its growth rate in our growth regression.10 The results are presented in Model 4 of Table 10. Again, including the level of years of schooling does not diminish the impact of broadband diffusion on economic growth.11
9 Alternatively, one might add a regulatory index that reflects the attitudes towards regulation in the different
countries. However, consistent time series on regulatory attitudes are not available for our complete observation period. Moreover, the development of attitudes towards regulation is not exogenous but may depend on the evolution of the telecommunication sector and the economy.
10 For a discussion of empirical evidence on the effects of levels of and growth in years of schooling, see
Hanushek and Woessmann (2008).
11 We experimented with firm-level micro data from the Community Innovation Survey (CIS) of the European
Union to gauge at possible channels through which broadband may affect growth. Unfortunately, for our purposes this database provides only two waves (CIS3 in 1998-2000 and CIS4 in 2002-2004) for nine countries (covering some 70,000 firms). Although these data limitations prohibit far-reaching interpretations, controlling for country and time fixed effects and clustering standard errors at the country x survey level, we find a positive effect of the national broadband penetration rate on radical product innovations that are new to the market and on process innovations. Detailed results are available from the authors upon request.
29
5. Conclusion
In this paper, we analyzed the effects of broadband infrastructure on economic growth. Based on annual data for a panel of OECD countries and using an instrumental-variable approach, we find that the introduction and diffusion of broadband had an important impact on growth in GDP per capita. After a country has introduced broadband, GDP per capita is 2.7 to 3.9 percent higher on average than before its introduction, controlling for country and year fixed effects. In terms of subsequent diffusion, an increase in the broadband penetration rate by 10 percentage points raises annual growth in per-capita GDP by 0.9 to 1.5 percentage points. Our results are robust to numerous tests and the inclusion of additional control variables. Our instrument for the supply of broadband, the penetration of underlying network infrastructure technologies, is successful in removing potential sources of reverse causality between growth and broadband diffusion and is shown to determine the deployment of broadband, but not of other technologies emerging around the same time. This provides confidence that our approach indeed isolates the causal effect of broadband infrastructure.
We close by discussing two limitations of our study. First, our measure of broadband is a rough one insofar as it considers any bandwidth over 256 kbit/s to be broadband. That is, the available data does not allow us to consider differences in the average or maximum bandwidths across countries, so that we concentrate on analyzing the extensive margin of broadband diffusion, i.e., the number of broadband users. Clearly, extensive diffusion may not tell the full story, as a new technology may be used more or less intensively by its users.12 However, as we are interested in the wide range of opportunities arising from increasing broadband deployment, extensive diffusion constitutes an informative measure. Second, given that broadband did not emerge until the mid-1990s and that technologies get replaced by new technologies like mobile broadband, our results represent medium-term effects for the period in which fixed broadband represents the main driver to enable firms to improve through new products, processes, and business models. Long-run projections of the effect of broadband on growth cannot be made without a longer sample period and a better understanding of the role that broadband may play in triggering further infrastructure innovations in the future. However, our results show an economically significant and robust effect of broadband diffusion on economic growth even in the time span of just over a decade. This evidence can
12 Grajek and Kretschmer (2009) document and analyze the considerable heterogeneity across users and
30
serve as a lower bound for the potential long-term effects of broadband infrastructure, which can be adequately assessed only once longer time series become available.
31
References
Aghion, P., and P. Howitt (1998). Endogenous Growth Theory.Cambridge, MA: MIT Press. Angrist, J.D., and A.B. Krueger (2001). Instrumental Variable and the Search for
Identification: From Supply and Demand to Natural Experiments. Journal of Economic Perspectives 15 (4), 69-85.
Aschauer, D.A. (1989). Is Public Expenditure Productive? Journal of Monetary Economics 23 (2), 177-200.
Audretsch, D.B., and M.P. Feldman (1996). R&D Spillovers and the Geography of Innovation and Production. American Economic Review 86 (3), 630-640.
Autor, D., F. Levy, and R. Murnane (2003). The Skill Content of Recent Technological Change: An Empirical Exploration. Quarterly Journal of Economics 118 (4), 1279-1333. Barro, R. (1991). Economic Growth in a Cross Section of Countries. Quarterly Journal of
Economics 106 (2), 407-443.
Benhabib, J., and M.M. Spiegel (2005). Human Capital and Technology Diffusion. In: Handbook of Economic Growth, Volume 1A, P. Aghion and S.N. Durlauf (eds.), 935-966. Amsterdam: Elsevier.
Bloom, N., T. Kretschmer, and J. Van Reenen (2009). Determinants and Consequences of Family-Friendly Workplace Practices: An International Study. Strategic Management Journal: forthcoming.
Bloom, N., and J. Van Reenen (2007). Measuring and Explaining Management Practices Across Firms and Countries. Quarterly Journal of Economics 122 (4), 1351-1408.
Bresnahan, T., E. Brynjolfsson, and L. Hitt (2002). Information Technology, Workplace Organization, and the Demand for Skilled Labor: Firm Level Evidence. Quarterly Journal of Economics 117 (1), 339-376.
Caroli, E., and J. Van Reenen (2002). Skill Biased Organizational Change? Evidence from British and French Establishments. Quarterly Journal of Economics 116 (4), 1449-1492. Caselli, F., and W.J. Coleman (2001). Cross-Country Technology Diffusion: The Case of
Computers. American Economic Review 91 (2), 328-335.
Comin, D., and B. Hobijn (2004). Cross-Country Technology Adoption: Making the Theories Face the Facts. Journal of Monetary Economics 51 (1), 39-83.