H
i-S
ta
t
D
is
cu
ss
io
n
P
a
p
er
Research Unit for Statistical
and Empirical Analysis in Social Sciences (Hi-Stat)
Hi-Stat
Institute of Economic Research
Hitotsubashi University
Global COE Hi-Stat Discussion Paper Series
December 2008
Intangible Investment in Japan:
New Estimates and Contribution to Economic Growth
Kyoji Fukao
Tsutomu Miyagawa
Kentaro Mukai
Yukio Shinoda
Konomi Tonogi
015
Intangible Investment in Japan: New Estimates and
Contribution to Economic Growth
December 2008
Kyoji Fukao
(Hitotsubashi University)
Tsutomu Miyagawa
(Gakushuin University)
Kentaro Mukai
(Cabinet Office, Government of Japan)
Yukio Shinoda
(Cabinet Office, Government of Japan)
Konomi Tonogi
(Hitotsubashi University)
*
This paper is a revised version of RIETI Discussion Paper 07-E-034. We thank Dr. Paul Schreyer of the
OECD, Dr. Carol Corrado of the Conference Board, Professor Jonathan Haskel of Queen Mary College,
University of London, and the participants of the OECD workshop on Measurement of Intellectual Assets in
National Accounts, the 2007 NBER/CRIW Summer Institute and the National Academies conference on
Intangible Assets for their excellent comments. We are grateful to Professors Bart van Ark and Marcel
Timmer of the University of Groningen and Mr. Yoshiaki Tojo of the OECD for valuable comments on
earlier drafts. Thanks are also due to Mr. Takayuki Sumita of the Ministry of Economy, Trade and Industry
and participants of the seminar at the Research Institute of Economy, Trade, and Industry (RIETI). We
appreciate the excellent research assistance provided by Mr. Sumio Hamagata (Central Research Institute of
Electric Power Industry), Dr. Shoichi Hisa (Takachiho University of Commerce) and Professor Miho
Takizawa (Toyo University). The views expressed in this paper are those of authors and should not be
attributed to any of the organizations which the authors belong to.
Abstract
The purpose of this paper is to measure intangible assets, to construct the capital stock of intangible assets,
and to examine the contribution of intangible capital to economic growth in Japan. We follow the approach
of Corrado, Hulten, and Sichel (2005, 2006) to measure intangible investment using the 2008 version of the
Japan Industrial Productivity (JIP) Database. We find that the ratio of intangible investment to GDP in Japan
has risen during the past 20 years and now stands at 11.6%, which is lower than the ratio estimated for the
United States in the early 2000s. The ratio of intangible to tangible investment in Japan is also lower than
equivalent values estimated for the United States. In addition, we find that, in stark contrast with the United
States, where intangible capital grew rapidly in the late 1990s, the growth rate of intangible capital in Japan
declined from the late 1980s to the early 2000s. In order to examine the robustness of our results, we also
conducted a sensitivity analysis and found that the slowdown of the contribution of intangible capital
deepening to economic growth and the recovery in Multi-Factor Productivity (MFP) growth from the second
half of the 1990s observed in our base case remain unchanged even if we take on-the-job training and
Japanese data with respect to investment in firm-specific resources into account.
Keywords: intangible investment, labor productivity, growth accounting.
JEL Classification Code: E22, O32, O47.
Corresponding author:
Tsutomu Miyagawa
Professor of Economics, Department of Economics, Gakushuin University
1-5-1, Mejiro, Toshima-ku, Tokyo, 171-8588, Japan
1. Introduction
In the 1990s, the United States enjoyed rapid rates of productivity growth. A major contributing factor
was the revolution in information and communication technology (ICT). The resurgence of US productivity
growth led governments of other developed countries such as the UK, Germany, France, the Netherlands,
and Japan to promote ICT investment in order to catch up with US productivity levels. In Japan, ICT
investment has shown steady growth, increasing at an annual average rate of 8.6% from 1995 to 2005 and
reaching 23.5 trillion yen in 2005 (in 2000 constant prices), which is equivalent to 18% of total investment.
Yet, the increase in ICT investment in Japan so far has failed to close the productivity gap with the US.
1Examining the reasons for the productivity gap, we find that a major factor is the low multi-factor
productivity (MFP) growth in services that use ICT, such as distribution services, finance and business
services, etc., as shown in Table 1. The table also indicates that in the case of the European Union (EU)
countries, too, the productivity gap vis-à-vis the US is due to the low productivity growth in ICT-using
services.
(Insert Table 1)
Examining the slow productivity growth in EU countries, van Ark (2004) suggested that the difference
with the US might be explained by differences in the accumulation of intangible assets which play a
complementary role to ICT capital. Studies that have addressed the role of intangible assets include those by
McGrattan and Prescott (2005), who took intangible investment at the macro level into account in order to
explain the solid growth of the US economy during the 1990s, and Corrado, Hulten, and Sichel (2005, 2006) ,
who measured intangible investment in the United States and showed the significant contribution of
intangible capital to US productivity growth.
The aim of this paper is to measure intangible investment and to examine its contribution to economic
growth in Japan. We have two reasons for focusing on the measurement of intangible investment. The first is
1
Discussions of recent developments in productivity growth in the US and the role of ICT investment can be
found in Corrado, Lengerman, Bertelsman and Beaulieu (2007), Stiroh and Botsch (2007), and Oliner, Sichel
and Stiroh (2007).
that we want to check whether trends in intangible investment can explain the productivity gap between the
United States and Japan in the 1990s. The second is that to date practically no studies have been carried out
on intangible capital in Japan. The Japanese government has made an acceleration of economic growth the
cornerstone of its economic policy, and given the economic challenges facing Japan, it is crucial to
understand why productivity growth has lagged behind that in the United States. The role of intangible
capital potentially is one key factor, and understanding if and why this is the case may make an important
contribution to policy design.
Our paper consists of four sections. In the next section, we estimate time series of intangible investment
following the methodology developed by Corrado, Hulten, and Sichel (2005, 2006). We find that the ratio of
intangible to tangible assets is lower in Japan than in the United States. We also estimate intangible
investment by sector and find that the intangible investment/value added ratio in the service sector is much
lower than that in the manufacturing sector. In Section 3, we construct intangible capital by using the
intangible investment series and conduct a growth accounting exercise. The results of the growth accounting
with intangible capital show that the contribution of intangible capital to economic growth is small because
the share of intangible capital in total capital is also relatively small. However, this result does not mean that
the potential role of intangible capital is not important for economic growth. If intangible capital in Japan
were to contribute to economic growth at the same rate as it does in the United States, labor productivity
growth in Japan would be 0.2 percentage points higher than it actually is. In Section 4, we conduct a
sensitivity analysis focusing on the parameters used for estimating investment in firm-specific resources. We
find that when we take Japanese data concerning firm-specific human resources and organizational structure
into account, the intangible investment/GDP ratio is higher than that estimated in the base case. On the other
hand, the effect of intangible capital deepening becomes smaller than that estimated in the base case, because
the growth in firm-specific human capital in the alternative case is slower than that estimated in the base case.
The last section summarizes our results and their policy implications and discusses future tasks.
2. Measurement of intangible investment in Japan
In this section, we describe how we measure intangible investment in Japan and look at the major
trends in intangible investment. In order to measure intangible investment, we follow the approach of
Corrado, Hulten, and Sichel (2005, 2006) (abbreviated as CHS hereafter), who classify intangibles into three
major types of assets: computerized information, innovative property, and economic competencies.
Computerized information consists of, for example, software and databases. Innovative property includes
scientific and nonscientific research and development (R&D), where the latter refers to, for example, mineral
exploitation, copyright and license costs, and other product development, design, and research expenses.
Economic competencies, finally, include brand equity, firm-specific human capital, and organizational
structure.
22.1 Computerized information
We take data on investment in computerized information from the 2008 version of the Japan Industrial
Productivity Database (JIP Database).
3This database was constructed by us and other economists and
provides data on the output, intermediate input, and labor and capital input of 108 industries from 1970 to
2005. In the JIP 2008 Database, investment in custom software and packaged software is estimated using
sales data for the information service industry from the
Survey on Selected Service Industries
and data from
the
Input-Output Tables
. The
Survey on Selected Service Industries
is conducted annually by the Ministry of
Economy, Trade, and Industry (METI) and includes information on the sales, number of workers, assets,
operating costs, and year of establishment about 7000 firms in the service sector, including the information
service industry.
We measure in-house software investment using the
ICT Workplace Survey
and the
Population Census..
The
ICT Workplace Survey
, which is also conducted annually by METI and provides information on
enterprises and organizations which heavily use ICT equipment with regard to their labor costs, other
expenditure, and number of employees categorized by job type such as programmers, systems engineers, and
network managers.
As The
ICT Workplace Survey
does not cover all workers who are involved in making
in-house software in Japan, we employ the following estimation procedures. From this survey, we take two
types of costs: the first is wages for workers in divisions which are specialized in in-house software
2
A detailed description of the measurement of intangible investment is provided in Appendix 1.
3The construction of the Japan Industrial Productivity (JIP) Database is described in Fukao et al. (2007). The
database is available from the website of the Research Institute of Economy, Trade and Industry
(
http://www.rieti.go.jp/en/database/d05.html
). A correspondence table for industry classifications in the JIP
Database and the ISIC code is provided in Appendix 2.
development and the second is other expenditures in these divisions. Using these values, we calculate the
cost of in-house software investment per engineer and programmer. We then multiply the result by the total
number of engineers and programmers in the market economy, which is available from the
Population
Census
, and derived in-house software investment in the market economy. The estimates for in-house
software investment we arrive at are largely consistent with those obtained by Nomura (2005). Finally,
investment in databases is estimated using sales data for the information service industry from the
Survey on
Selected Service Industries
and data from the
Establishment and Enterprise Census
.
2.2 Innovative property
For data on investment in science and engineering R&D, we use the
Survey of Research and
Development
. The
Survey of Research and Development
is conducted by the Ministry of Internal Affairs and
Communications and includes information on research expenditures categorized by several types of research
expenses such as material costs, labor costs and depreciation costs for about 19,000 enterprises, universities,
and research institutions. We use the expenses on materials and labor costs for R&D activities from this
survey as our data on investment in science and engineering R&D. Data on investment in mineral
exploitation were obtained from the
Handbook of the Mining Industry
and the
Annual Report on Natural Gas
.
Next, for copyright and license costs, we take data from the JIP 2008 Database, using the nominal output
data of JIP 2008 industry no. 92 (publishing and newspaper industry) and JIP 2008 industry no. 93 (video
picture, sound information, character information production and distribution industry).
As for the measurement of other product development, design, and research expenses, CHS (2005)
summed the following three items: (1) new product development costs in financial services and other service
industries such as book publishing, motion picture production, sound recording production, and broadcasting
(such costs account for 20 percent of intermediate purchases in these industries); (2) new architectural and
engineering designs which roughly account for half of industry purchased services (CHS (2005) estimated
this value from the revenues of architectural and engineering design industries reported in the Census
Bureau’s
Services Annual Survey
); and (3) R&D in social sciences and humanities which is estimated as
twice industry purchased services to include own-account expenses on R&D in social sciences and
humanities (this item is also estimated from the revenues of the Census Bureau’s
Services Annual Survey
).
Here, we estimate investment in (1) using data on intermediate purchases in JIP 2008 industries no. 69
(finance industry) and no. 70 (insurance industry). To measure investment in (2), we use the nominal output
data of the design, display, and machinery design industries from the Input-Output Tables as investment in
new architectural design, while for investment in engineering design, we use data from METI’s
Survey on
Selected Service Industries
. As for (3), we are unable to find suitable data.
2.3 Economic competencies
With regard to investment in brand equity, we follow the approach adopted by CHS (2005), taking 60
percent of the nominal output purchased by other industries from the advertising industry (JIP 2008 industry
no. 85).
Firm-specific human capital is accumulated through both on-the-job and off-the-job training.
Following CHS (2005), we only estimate off-the-job training costs here and assume that these costs consist
of two types of expenses: (1) direct firm expenses for off-the-job training of employees; and (2) opportunity
cost (the wage and salary costs of employees’ time spent in getting off-the-job training). In our sensitivity
analysis in Section 4, we estimate on-the-job training costs and examine how our results on Japan’s
intangible investment change when such costs are included.
As for the first item, direct firm expenses, we use data on vocational education costs per worker from
the
General Survey on Working Conditions
(
Shugyo Joken Sogo Chosa
) conducted by the Ministry of Health,
Labour and Welfare. The purpose of this survey is to statistically review the wage system, fringe benefits,
and retirement system of Japanese firms. It covers about 5,000 Japanese firms and asks these about training
costs, including the wage and salary costs of employees who teach workers in an off-the-job mode or
employees who support the off-the-job training processes.
As for the second item, opportunity cost, we use the results obtained by Ooki (2003). Using
micro-data of The Japan Institute for Labour Policy and Training’s
Survey on Personnel Restructuring and
Vocational Education/Training Investment in the Age of Performance-based
Wage Systems
(
Gyoseki-shugi
Jidai no Jinji Seiri to Kyoiku/Kunren Toshi ni Kansuru Chosa
), Ooki calculated the average opportunity cost
ratio of off-the-job training to direct firm expenses for training in 1998 for the whole business sector. The
value was 1.51. We use this value to estimate the opportunity cost.
CHS (2005) argue that investment in organizational structure consists of a purchased “organizational”
or “structural” component (such as management consultant fees) and an own-account component, which can
be measured in terms of the value of executive time.
With regard to the first component, CHS (2005), Marrano and Haskel (2006), and Marrano, Haskel
and Wallis (2007) use sales data for consulting firms. However, we are not able to find suitable data for the
consulting industry in Japan. As an alternative, we therefore use the nominal output of law firms and
accounting offices. Law firms and accounting offices fall into the business service industry (JIP 2008
industry no. 88), and we separate their nominal output from the total output in the business service industry
using the
Input-Output Tables.
For the measurement of the second component, own-account investment in
organizational structure, we use the
Survey on Financial Statements of Business Enterprise
s. This survey is
conducted annually by the Ministry of Finance and gathers the financial statements of enterprises whose
capital is above 2 million yen. Following CHS (2005), we approximate this component by taking 20 percent
of the salaries and bonuses for executives from this survey.
2.4 Measurement results for intangible investment in Japan
Our measurement results are shown in Table 2. Our estimates suggest that the annual average amount
of intangible investment in Japan from 2000-2005 was 56 trillion yen. The share of intangible investment in
GDP in the same period was 11.5 percent, which is similar to the estimate for the US by CHS (2006) and
larger than that for the UK by Marrano and Haskel (2006). However, the figure for the US obtained by CHS
(2006) is for the period from 1998-2000, and more recent, but as yet unpublished estimates by Dr. Corrado
suggest that the intangible investment/GDP ratio in the US in the early 2000s had reached 13.8 percent,
meaning that the equivalent ratio for Japan is lower than that for the US. However, it should be noted that
our measurement of intangible investment in Japan is likely to be an underestimation due to the lack of
reliable data for the estimation of investment in other product development, design, and research,
firm-specific human capital, and organizational structure.
(Insert Table 2)
Moreover, comparing the relative levels of intangible and tangible investment in Japan and the United
States, other significant differences emerge. For example, CHS (2006) found that in the United States,
intangible investment was 1.2 times the level of tangible investment. However, according to our estimation,
the ratio of intangible to tangible investment in Japan was only 0.6.
Given that the share of intangible investment in GDP in Japan is similar to that in the US, the low ratio
of intangible to tangible investment in Japan indicates not that investment in intangibles is small, but that
investment in tangibles is exceptionally large. Figure 1 shows the ratios of tangible and intangible investment
to GDP in Japan and the US. We find that in Japan, the GDP ratio of intangible investment is still much
smaller than that of tangible investment, while in the US, intangible investment has exceed tangible
investment since 2000. We suspect that the difference in investment behavior between Japan and the US is at
least partially due to differences in the financial system. In Japan, financial institutions such as banks play a
major role in the provision of corporate funds, and they typically require tangible assets as collateral to
provide financing. As a result, Japanese firms have preferred to accumulate tangible assets which can be
used as collateral. In addition, small firms have been hampered in their growth because they often possess
insufficient tangible assets to increase borrowing. These mechanisms as a result of Japan’s financial system
are likely to be important reasons why the ratio of intangible to tangible investment is low in Japan.
(Insert Figure 1)
The share of each type of intangible investment is shown in Table 3. The largest component of
intangible investment in Japan is innovative property with a share of nearly 51 percent in the early 2000s.
The share of computerized information has increased during the past 20 years. Table 4 presents the ratio of
intangible investment to GDP by category. The table shows that all categories contributed to the increase in
the ratio of total intangible investment to GDP. The investment/GDP ratios for computerized information and
innovative property are larger than those estimated for the US and the UK. However, the GDP ratio of
economic competencies is much smaller than those estimated for the US and UK due to the low GDP ratio of
investment in firm-specific human capital and organizational structure..
2.5 Intangible investment by sector
As discussed in Section 2.1, our measurement of intangible investment mainly relies on the JIP 2008
Database. Because this database includes data on output, intermediate input, labor input, and capital services
in 108 industries, we are able to measure intangible investment by sector. Table 5 shows intangible
investment in the manufacturing sector and the service sector.
4(Insert Table 5)
In Table 5, we find that intangible investment in the service sector is larger than that in the
manufacturing sector. However, as for the ratio of intangible investment to value added, the ratio is higher in
the manufacturing than in the service sector due to the high ratio of investment in R&D to value added in the
former. As can be seen in the table, although the total amount of intangible investment in the service sector is
greater than that in the manufacturing sector, the ratio to value added is lower. Moreover, given that the ratio
of intangible investment to value added in Japan’s manufacturing sector exceeds the equivalent ratio for the
US economy as a whole in the early 2000s, it becomes clear that it is the service sector which is responsible
for dragging the ratio for Japan’s economy as a whole below that of the US. The intangible/tangible
investment ratio is also slightly higher in the manufacturing than in the service sector. We suspect that the
reason why firms in the service sector accumulate more tangible than intangible assets is that they are more
dependent on debt finance.
3. Growth accounting
Using the intangible investment data obtained in the previous section, we examine the contribution of
intangible capital to Japan’s economic growth. We obtain real investment series by using the deflators shown
in Table 6. We then use the perpetual inventory method to construct the capital stock of intangible assets.
4
The economy as a whole consists of the manufacturing sector, the service sector, and a range of other
sectors that include agriculture, forestry, fishing, the mining and construction industries, and the public
sector.
The depreciation rates for intangible assets are taken from CHS (2006) and are shown in Table 7. Since data
on intangible investment at 1995 prices are available from 1973, we can use 1980 as the starting point for the
construction of the capital stock of intangible assets.
(Insert Tables 6 and 7)
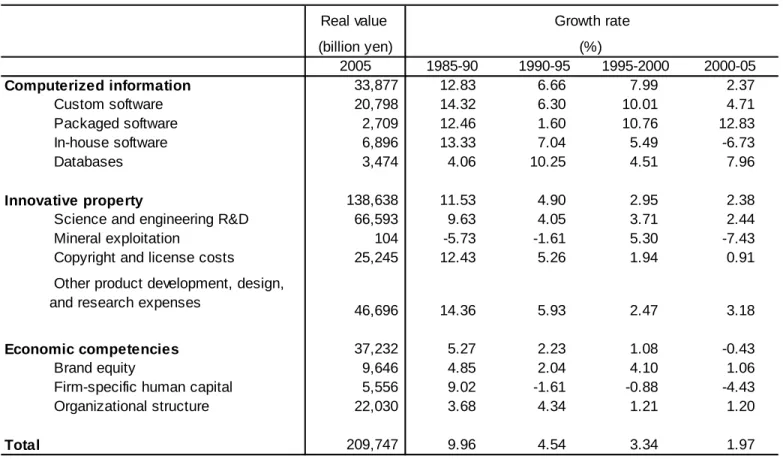
The value and growth rate of Japan’s intangible capital stock are reported in Table 8. In 2005, the real
intangible capital stock stood at 210 trillion yen. The growth rate of intangible capital has decreased
drastically from 10.0 percent in the late 1980s to 2.0 percent in the early 2000s. This pattern – rapid growth
during the 1980s but a slowdown during the 1990s and 2000s – is almost the exact opposite of that observed
in the United States, where the accumulation of intangible assets accelerated around the middle of the 1990s.
(Insert Table 8)
In order to examine the contribution of intangible capital to Japan’s economic growth, we conduct a
growth accounting exercise. We assume the following Cobb-Douglas type production function:
(1)
Y
t=
A
t(
K
tT)
α(
K
tI)
βL
1t−α−βwhere
Y
trepresents GDP,
A
tstands for multi-factor productivity (MFP),
T tK
is tangible capital, and
K
tIstands for intangible capital. From equation (1), we obtain:
(2)
Δ
y
=
Δ
a
+
α
Δ
k
T+
β
Δ
k
I+
Δ
l
where
t
X
x
t∂
∂
=
Δ
ln
, and
x
=
ln
X
t(
x
=
y
,
k
,
l
)
. Moreover,
k
Tand
k
Iare the logs of the ratios of
capital stock to hours worked.
The data for all the variables, except for intangible capital and MFP in equation (1), are taken from the
JIP 2008 Database. We calculate production factor shares on a cost basis. The labor share is calculated by
dividing labor compensation by nominal total costs. By subtracting the labor share from 1, we obtain the
total capital share. The shares of tangible and intangible capital are calculated by using the share of each type
of capital in total capital.
5The results of our growth accounting exercise based on equation (2) are shown in Table 9, which
compares the results of our growth accounting with intangible capital with the results of a conventional
growth accounting exercise without intangible capital. We find that the contribution of intangible capital to
Japan’s annual economic growth declined from 0.9 percent points in the second half of the 1980s to about
0.5 percentage points in the 1990s.
The effect of intangible capital deepening continued to decline in the
early 2000s, because intangible investment in Japan has stagnated since 2002. As a result, the total capital
deepening effect was larger in the growth accounting with intangible capital than in the conventional growth
accounting. Conversely, MFP growth has been slightly smaller in the growth accounting with intangible
capital than in the conventional growth accounting without intangible capital except the second half of the
1990s.
(Insert Table 9)
When we conduct growth accounting by sector, the contribution of intangible capital service to labor
productivity growth declined in both the manufacturing and the service sector in the 1990s. Although labor
productivity growth subsequently recovered in both sectors, intangible capital deepening did not contribute
to this recovery in either sector. When we compare growth accounting for Japan and the US, the contribution
of intangible capital to labor productivity growth in Japan in the early 2000s was negative, while CHS (2006)
found that the increase in intangible capital in the late 1990s and the early 2000s was responsible for 27
percent of labor productivity growth in the US. If the contribution of intangible capital to labor productivity
growth were as large in Japan as in the United States, then Japanese labor productivity growth in the early
2000s would have been 0.2 percentage points higher than it actually was.
4. Sensitivity analysis
5
In Section 2, we measured intangible investment in Japan following CHS (2005). However, investment
in firm-specific resources depends on the business customs of each country. Therefore, our results with
regard to intangible investment in Japan in Section 2 may depend on our parameter assumptions for the
measurement of investment in firm-specific resources in Section 2.3. To examine whether this is the case, we
conduct a sensitivity analysis changing the parameters assumed in the measurement of firm-specific
resources in the following two cases.
First, we examine what happens when we assume that the depreciation rate of firm-specific resources is
20 percent rather than the 40 percent assumed by CHS (2006) and used in the above analysis (see Table 7).
Second, we make the following assumptions with respect to firm-specific human capital and
organizational structure:
(1) We take account of informal training costs. These are not included in the measurement of
investment in firm-specific resources employed CHS (2005), but Japanese firms often utilize on-the-job
training to accumulate firm-specific human capital and they therefore may represent an important element of
intangible investment. Since there are no official surveys providing information on on-the-job training, we
use information on on-the-job training from a survey conducted by the Cabinet Office in 2007 for the
Annual
Report on the Japanese Economy and Public Finance
2007. The survey was sent to 979 listed firms of which
818 responded. According to this survey, Japanese workers spend about 9.9 percent of their time on
on-the-job training. Therefore, we count 9.9 percent of employees’ wages as on-the-on-the-job training costs.
6(2) In Section 2, we assume that all off-the-job
training activities contribute to the accumulation of
firm-specific human capital. However, according to a survey on household behavior conducted by Keio
University, 63 percent of workers answered that skills gained through off-the-job training supported by
employers would be useful even if they were to change jobs. Above, we count training costs which are useful
for a specific firm as investment in firm-specific human capital, but the result of the Keio survey implies that
we should not treat all such off-the-job training as investment in firm-specific human capital. Unfortunately,
we do not know how much of the training given to the 63 percent that thought it would be useful also in a
different job was firm-specific. For our sensitivity analysis, we therefore assume that the training that the 63
6
This result is very much in line with informal interviews with Japanese managers we conducted, which
suggest that about 10 percent of workers’ working time is used for on-the-job training.
percent received was not firm-specific and only count 37 percent of formal training costs as investment in the
accumulation of firm-specific human capital.
(3) Following CHS (2005), in the analysis above, we assumed that executives spend 20 percent of their
working time on organizational change. However, according to Robinson and Shimizu (2006), who surveyed
the time use of Japanese CEOs, Japanese CEOs spent only 9 percent of their working time on strategy
development, developing new business, and re-organization. Therefore, as an alternative, we measure
investment in organizational structure using 9 percent rather than 20 percent of the remuneration of
executives.
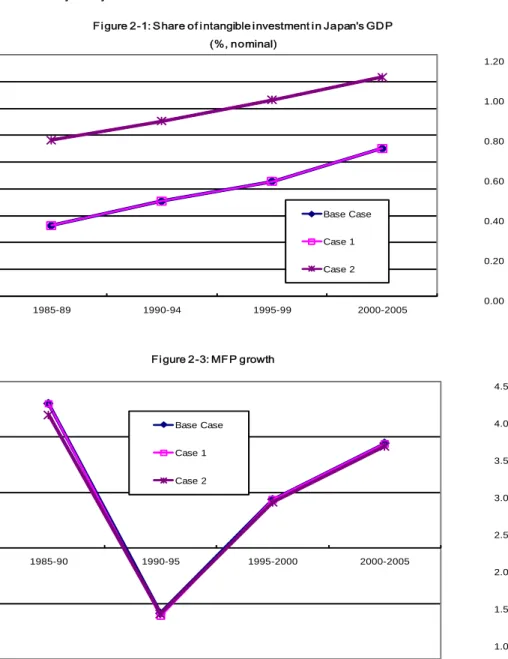
Figure 2 shows the sensitivity analysis considering the above modifications. The Base Case is the
estimation described in Section 2, the alternative Case 1 is the case where we change the depreciation rate of
firm-specific resources, and Case 2 is the case where we consider informal training and Japanese data with
respect to investment in firm-specific human capital and organizational change. We find no substantial
differences between Case 1 and the Base Case. The change in the depreciation rate of firm-specific resources
does not affect the growth accounting results.
7(Insert Figure 2)
In Case 2, we find that the intangible investment/GDP ratio (14.2 percent in the early 2000s) is higher
than that in the Base Case because on-the-job training costs are taken into account. In the growth accounting
in Case 2, both labor productivity growth and the capital deepening effect are lower than in the Base Case
from the late 1990s onward. As lower productivity growth is offset by the low capital deepening effect, the
MFP growth rate in Case 2 since the second half of the 1990s is similar to that in the Base Case. Our
sensitivity analysis thus shows that if on-the-job training costs and the working time of Japanese CEOs on
organizational change surveyed by Robinson and Shimizu (2006) with respect to firm-specific resources are
taken into account, the ratio of intangible investment to GDP in Japan is actually higher than that in the US
or the UK. In the growth accounting in Case 2, labor productivity growth and the total capital deepening
effect are lower than in the Base Case since the second half of the 1990s. As a result, the recovery in MFP
7
growth from the late 1990s to the early 2000s in Case 2 is similar to that suggested in the Base Case
estimation.
5. Policy implications and future research agenda
The purpose of this paper was to measure intangible assets in Japan. Using our estimates, we
constructed the capital stock of intangible assets and examined the contribution of intangible capital to
Japanese economic growth. The results of our study can be summarized as follows.
First, investment in intangible assets in Japan grew rapidly until 2000. Consequently, the ratio of
intangible investment to GDP also rose during this period. However, the ratio of intangible investment to
GDP in Japan is still lower than the value for the US for the early 2000s estimated by Dr. Corrado. In
addition, the ratio of intangible to tangible investment in Japan is lower than that in the US. One possible
reason for this are differences in the financial system, in particular the fact that much corporate financing in
Japan relies on loans from banks which require tangible assets as collateral.
Second, we also estimated intangible investment by sector. We found that it is the service sector which
is responsible for the low intangible investment/GDP ratio overall.
Third, the growth rate of intangible capital in Japan declined from the late 1980s to the early 2000s.
This slowdown stands in stark contrast with the high growth rate of intangible capital in the US in the late
1990s.
Fourth, due to the slowdown in the accumulation of intangible assets, the contribution of intangible
capital to economic growth in Japan turned negative in the early 2000s. The contribution of intangible capital
to total labor productivity growth in Japan has been much smaller that than in the US. If the contribution of
intangible capital to labor productivity growth were as large in Japan as in the United States, then Japanese
labor productivity growth in the early 2000s would have been 0.2 percentage points higher than it actually
was.
Fifth, the sensitivity analysis has shown that the intangible investment/GDP ratio in Japan exceeds the
level in the US and the UK if we take on-the-job training and Japanese data with respect to investment in
firm-specific resources into account. However, we find no change in the slowdown of the contribution of
intangible capital deepening to economic growth and the recovery in MFP growth from the second half of
the 1990s, which we observed in the Base Case.
Our results have a direct bearing on the debate on how to overcome the low productivity growth in the
service sector that has slowed down aggregate productivity growth in Japan. Service sector activities tend to
be more intangible asset-intensive than manufacturing activities and until now, it has been the
tangible
asset-intensive manufacturing sector which has driven Japan’s economic growth. However, Japan is facing strong
competition in the manufacturing sector from emerging Asian economies such as China, India, and South
Korea, and Japan cannot rely on the manufacturing sector alone to generate economic growth in the future. It
therefore has to promote growth in the service sector in order to attain GDP growth rates of 2 or 3 percent. In
order to achieve such change in economic structure, reforms to the accounting system and the financial
system are necessary. As mentioned in Section 2, firms in the service sector which hold few tangible assets
are stunted in their growth opportunities because they face difficulties in obtaining external finance.
Introducing a new accounting system which also values intangible assets would open the way for banking
and insurance firms to recognize intangible assets as collateral for finance. Therefore, it would be helpful to
devise a methodology that aids the valuation of the intangible assets of such firms. In addition, efforts should
be made to transform the current system in which banks dominate corporate financing to a new financial
system in which even small firms can gain access to funds through capital markets.
Our study is in progress and much remains to be done. For example, firm-specific human capital and
organizational structure are likely to be underestimated due to the lack of reliable data. To measure these
more accurately, we will need to gather data concerning firm-specific human capital and organizational
change by examining firm-level activities.
8We hope that once we have completed these tasks, we will have a clearer understanding of the role of
intangible assets in promoting Japan’s economic growth through faster productivity growth in the service
sector.
8
One study along these lines is that by Bloom and Van Reenen (2007), who tried to assemble and analyze
data on the organizational structure of firms through interviews with firm managers.
References
Ark, B. van (2004), “The Measurement of Productivity: What Do the Numbers Mean?” in G. Gelauff, L.
Klomp. S. Raes, and T. Roelandt (eds.),
Fostering Productivity,
Elsevier, Amsterdam.
Bloom, N. and J. van Reenen (2007), “Measuring and Explaining Management Practices Across Firms and
Countries,”
Quarterly Journal of Economics
122: 1351-1408.
Corrado, C., C. Hulten, and D. Sichel (2005), “Measuring Capital and Technology: An Extended
Framework,” in C. Corrado, J. Haltiwanger, and D. Sichel (eds.),
Measuring Capital in the New
Economy
, The University of Chicago Press, Chicago,.
Corrado, C., C. Hulten, and D. Sichel (2006), “Intangible Capital and Economic Growth,”
NBER Working
Paper
No. 11948.
Corrado, C. P. Lengermann, E. Bartelsman, and J. Beaulieu (2007), “Sectoral Productivity in the United
States: Recent Developments and the Role of IT,”
German Economic Review
8: 188-210.
Fukao, K., S. Hamagata, T. Inui, K. Ito, H.U. Kwon, T. Makino, T. Miyagawa, Y. Nakanishi, and J. Tokui
(2007), “Estimation Procedure and TFP Analysis of the JIP Database 2006 (revised),”
RIETI
Discussion Paper
No. 07-E-003.
Jorgenson, D. W., F. M. Gollop, and B. M. Fraumeni (1987),
Productivity and U. S. Economic Growth
,
Harvard University Press, Cambridge, MA..
Marrano, M. G. and J. Haskel, (2006) “How Much Does the UK Invest in Intangible Assets?”
Department of
Economics Queen Mary University of London Working Paper
No. 578.
Marrano, M. G., J. Haskel and G. Wallis (2007), “What Happened to the Knowledge Economy? ICT,
Intangible Investment and Britain’s Productivity Record Revisited,” paper presented at the NBER
Summer Institute 2007.
McGrattan, E., and E. Prescott (2005), “Expensed and Sweat Equity,” Federal Reserve Bank of Minneapolis,
Working Paper
No. 636.
Nomura, K. (2005), “Turn the Tables! Reframing the Measurement of Capital in Japanese National
Accounts,” paper presented at the Conference on the Next Steps for the Japanese SNA.
Ooki Eiichi (2003) “Performance-based Wage Systems and Vocational Education/Training Investment,
(Gyoseki-shugi to Kyoiku Kunren Toshi),”
Implications of Performance-based Wage Systems for
Individuals and Organizations
, in K. Konno (ed.), Chuo Keizai Sha, Tokyo (in Japanese).
Oliner, S., D. Sichel, and Stiroh (2007), “Explaining a Productive Decade,”
Brookings Papers on Economic
Activity
2007-1: 81-152.
Robinson, P. and N. Shimizu (2006), “Japanese Corporate Restructuring: CEO Priorities as a Window on
Environmental and Organizational Change,”
The Academy of Management Perspectives
20(3):
44-75.
Stiroh, K. and M. Botsch (2007), “Information Technology and Productivity Growth in the 2000s,”
German
Table 1: MFP growth and share in total hours worked by sector, major developed economies (%)
Japan US France Germany Italy UK Japan US France Germany Italy UK Market economy total
0.5 1.7 0.8 0.4 -0.7 0.9 100.0 100.0 100.0 100.0 100.0 100.0
.Electrical machinery, post and communication
5.4 8.7 5.9 4.7 2.7 3.7 5.0 4.3 4.5 5.1 3.7 4.9
.Manufacturing, excluding electrical
-0.7 2.2 1.8 1.3 -1.2 0.8 19.4 15.7 18.3 23.4 22.4 18.0
.Other goods producing industries
0.0 -0.3 0.7 1.4 -0.1 0.1 20.0 14.3 19.2 15.6 16.6 13.9
.Distribution services
0.9 2.1 0.4 1.5 -0.9 1.1 26.2 27.1 24.2 25.8 26.2 26.7
.Finance and business services
-0.1 0.4 -0.8 -3.3 -0.4 1.1 12.8 21.2 21.1 17.3 13.7 23.0
.Personal and social services
-0.1 0.0 0.9 -0.7 -2.0 -0.7 16.6 17.4 12.8 12.7 17.4 13.5
Source: EU KLEMS Database March 2008.
1995-2005
Table 2 : Intangible investment by category: comparison among Japan, the US, and the UK Japan US UK 2000-2005 (billion yen) CHS (2006) 1998-2000 (billion US dollars) MH (2006) 2004 (billion pounds) Computerized information 10,803 154 19.8 Custom software 6,584 Packaged software 848 In-house software 2,332 Databases 1,039 3 Innovative property 28,629 425 37.6
Science and engineering R&D 13,690 184 12.4
Mineral exploitation 16 18 0.4
Copyright and license costs 5,161 75 2.4
Other product development, design, and
research expenses 9,761 149 22.4
Economic competencies 16,186 505 58.8
Brand equity 5,534 140 11.1
Firm-specific human capital 2,241 28.5
Organizational structure 8,410 19.2
Total 55,618 1085 116.2
Intangible investment /Value added (%) 11.5 11.7 10.0
(13.8)
Intangible investment/Tangible investment 0.6 1.2 1.1
(1.1) 1) Sources: Japan:authors' calculations, US:Corrado, Hulten and Sichel (2006), UK:Marrano and Haskel (2006).
2) Figures in parentheses indicate estimates for the period from 2000 to 2003. 151
365
7.5
Table 3 : Intangible investment by category : share in total intangible investment (%)
Japan
US
UK
1980-89
1990-1999
2000-05
1980-84 1985-89
1990-94 1995-99
1998-2000
2004
Computerized information
10.0
7.7
12.2
16.3
15.1
17.4
19.5
14.2
17.0
Custom software
5.0
3.8
6.2
8.4
7.4
9.4
11.8
Packaged software
0.5
0.4
0.6
0.8
0.8
0.8
1.5
In house software
3.5
2.7
4.3
5.7
5.7
5.7
4.3
10.7
Databases
1.0
0.8
1.1
1.4
1.3
1.5
1.8
0.3
Innovative property
54.1
53.9
54.3
51.7
52.4
51.0
51.3
39.2
32.4
Science and engineering R&D
24.2
24.2
24.2
24.1
23.9
24.3
24.4
17.0
10.7
Mineral exploitation
0.1
0.2
0.1
0.1
0.1
0.1
0.0
1.7
0.3
Copyright and license costs
10.2
10.3
10.2
10.0
10.1
9.8
9.3
6.9
2.1
Other product development,
design, and research expenses
19.6
19.3
19.9
17.6
18.4
16.8
17.6
13.7
19.3
Economic competencies
35.9
38.3
33.5
32.0
32.4
31.6
29.2
46.5
50.6
Brand equity
9.4
10.2
8.5
9.3
8.8
9.8
9.9
12.9
9.6
Firm-specific human capital
7.9
7.9
8.0
6.2
6.9
5.5
4.1
24.5
Organizational structure
18.6
20.2
17.0
16.5
16.7
16.3
15.1
16.5
Total
100.0
100.0
100.0
100.0
100.0
100.0
100.0
100.0
100.0
1) Sources: Japan:authors' calculations, US:Corrado, Hulten and Sichel (2006),
UK:Marrano and Haskel (2006).
13.9
6.5
Table 4: The ratio of intangible investment to value added: by category and year (%)
Japan
US
UK
1980-89
1990-1999
2000-05
1980-84 1985-89
1990-94 1995-99
1998-2000
2004
Computerized information
0.8
0.6
1.1
1.6
1.4
1.8
2.2
1.7
1.7
Custom software
0.4
0.3
0.5
0.8
0.7
1.0
1.4
Packaged software
0.0
0.0
0.1
0.1
0.1
0.1
0.2
In-house software
0.3
0.2
0.4
0.6
0.5
0.6
0.5
Databases
0.1
0.1
0.1
0.1
0.1
0.2
0.2
0.0
Innovative property
4.3
3.9
4.7
5.1
5.0
5.2
5.9
4.6
3.2
Science and engineering R&D
1.9
1.7
2.1
2.4
2.3
2.5
2.8
2.0
1.1
Mineral exploitation
0.0
0.0
0.0
0.0
0.0
0.0
0.0
0.2
0.0
Copyright and license costs
0.8
0.7
0.9
1.0
1.0
1.0
1.1
0.8
0.2
Other product development,
design, and research expenses
1.6
1.4
1.7
1.7
1.8
1.7
2.0
1.6
1.9
Economic competencies
2.8
2.8
2.9
3.2
3.1
3.2
3.4
5.4
5.0
Brand equity
0.7
0.7
0.7
0.9
0.8
1.0
1.1
1.5
1.0
Firm-specific human capital
0.6
0.6
0.7
0.6
0.7
0.6
0.5
2.4
Organizational structure
0.3
0.3
0.3
0.4
0.4
0.4
0.5
1.6
Total
7.9
7.2
8.6
9.9
9.5
10.3
11.5
11.7
10.0
1) Sources: Japan:authors' calculations, US:Corrado, Hulten and Sichel (2006),
UK:Marrano and Haskel (2006).
0.6
1.6
3.9
Table 5 : Intangible investment by category in the manufacturing sector and the service sector Manufacturing sector Services sector 2000-2005 (billion yen) Ratio to value added (%) 2000-2005 (billion yen) Ratio to value added (%) Computerized information 2,447 (2.09) 6,125 (2.37) Custom software 1,526 (1.30) 4,197 (1.61) Packaged software 184 (0.16) 388 (0.15) In-house software 510 (0.45) 1,065 (0.42) Databases 226 (0.19) 475 (0.18) Innovative property 13,316 (11.22) 9,161 (3.55)
Science and engineering R&D 9,312 (7.83) 1,052 (0.40) Mineral exploitation 0 (0.00) 16 (0.01)
Copyright and license costs 472 (0.41) 4,152 (1.61) Other product development, design, and
research expenses
3,531 (2.98) 3,940 (1.54)
Economic competencies 4,657 (3.95) 9,292 (3.59)
Brand equity 1,876 (1.59) 3,477 (1.33)
Firm-specific human capital 584 (0.49) 1,334 (0.54)
Organizational structure 2,198 (0.91) 4,480 (0.36)
Total 20,420 (17.27) 24,577 (9.51)
Intangible investment/Tangible
investment 0.9 0.5
Table 6: Deflators for intangible investment
Data source and comments
Computerized information
Custom software
Investment deflator in the JIP 2008 Database
Packaged software
Investment deflator in the JIP 2008 Database
In-house software
Investment deflator in the JIP 2008 Database
Databases
Investment deflator in the JIP 2008 Database
Innovative property
Science and engineering R&D
Output deflators for JIP 2008 Database industry nos. 99 and 106
Mineral exploitation
Investment deflator in the JIP 2008 Database
Copyright and license costs
Output deflators for JIP 2008 Database industry nos. 92 and 93
Other product development, design,
and research expenses
Output deflators for JIP 2008 Database industry nos. 69, 70, and 88
Economic competencies
Brand equity
Output deflator for JIP 2008 Database industry no. 85
Firm-specific human capital
Output deflator in JIP 2008 Database industry no. 80
Table 7: Depreciation rates for intangible assets
Category
Depreciation rate (%)
Computerized information
33
Innovative property
20
Brand equity
60
Firm-specific human capital
40
Table 8 : Real value and growth rate of intangible capital stock
Real value
(billion yen)
2005
1985-90
1990-95
1995-2000
2000-05
Computerized information
33,877
12.83
6.66
7.99
2.37
Custom software
20,798
14.32
6.30
10.01
4.71
Packaged software
2,709
12.46
1.60
10.76
12.83
In-house software
6,896
13.33
7.04
5.49
-6.73
Databases
3,474
4.06
10.25
4.51
7.96
Innovative property
138,638
11.53
4.90
2.95
2.38
Science and engineering R&D
66,593
9.63
4.05
3.71
2.44
Mineral exploitation
104
-5.73
-1.61
5.30
-7.43
Copyright and license costs
25,245
12.43
5.26
1.94
0.91
Other product development, design,
and research expenses
46,696
14.36
5.93
2.47
3.18
Economic competencies
37,232
5.27
2.23
1.08
-0.43
Brand equity
9,646
4.85
2.04
4.10
1.06
Firm-specific human capital
5,556
9.02
-1.61
-0.88
-4.43
Organizational structure
22,030
3.68
4.34
1.21
1.20
Total
209,747
9.96
4.54
3.34
1.97
Source: Authors' calculation.
Growth rate
(%)
Table 9-1: Growth accounting with and without intangible capital (Whole Economy)
(a) Conventional growth accounting
(%)
1985-90
1990-95 1995-2000 2000-2005
Growth rate of GDP
4.66
1.10
0.98
1.53
Growth rate of labor input
0.93
-0.11
-0.52
-0.61
Growth rate of labor productivity
3.73
1.20
1.50
2.14
Contribution of capital deepening
2.14
1.47
1.13
1.12
Contribution of MFP growth
1.59
-0.27
0.37
1.02
(b) Growth accounting with intangibles
(%)
1985-90
1990-95 1995-2000 2000-05
Growth rate of GDP
4.89
1.06
1.26
1.51
Growth rate of labor input
0.93
-0.11
-0.52
-0.61
Growth rate of labor productivity
3.96
1.17
1.78
2.12
Contribution of capital deepening
2.66
1.75
1.34
1.17
Contribution of tangible capital
1.76
1.25
0.86
0.82
Contribution of intangible capital
0.90
0.51
0.48
0.35
Contribution of MFP growth
1.30
-0.59
0.44
0.94
Table 9-2: Growth accounting with and without intangible capital (Manufacturing sector)
(a) Conventional growth accounting
(%)
1985-90
1990-95 1995-2000 2000-05
Growth rate of GDP
4.30
0.15
1.05
2.16
Growth rate of labor input
0.22
-2.42
-1.85
-1.82
Growth rate of labor productivity
4.08
2.57
2.90
3.98
Contribution of capital deepening
3.11
2.66
1.37
2.78
Contribution of MFP growth
0.97
-0.09
1.53
1.20
(b) Growth accounting with intangibles
(%)
1985-90
1990-95 1995-2000 2000-05
Growth rate of GDP
4.66
0.27
1.48
2.43
Growth rate of labor input
0.22
-2.42
-1.85
-1.82
Growth rate of labor productivity
4.43
2.69
3.33
4.26
Contribution of capital deepening
3.91
3.34
2.05
2.82
Contribution of tangible capital
2.18
1.84
0.97
1.85
Contribution of intangible capital
1.72
1.50
1.08
0.96
Contribution of MFP growth
0.53
-0.65
1.29
1.44
Table 9-3 : Growth accounting with and without intangible capital (Service sector)
(a) Conventional growth accounting
(%)
1985-90
1990-95
1995-2000
2000-05
Growth rate of GDP
4.71
2.51
1.30
1.52
Growth rate of labor input
1.56
0.62
0.06
-0.50
Growth rate of labor productivity
3.15
1.89
1.24
2.02
Contribution of capital deepening
2.52
1.53
1.23
1.35
Contribution of MFP growth
0.63
0.36
0.01
0.67
(b) Growth accounting with intangibles
(%)
1985-90
1990-95
1995-2000
2000-05
Growth rate of GDP
4.98
2.34
1.56
1.84
Growth rate of labor input
1.56
0.62
0.06
-0.48
Growth rate of labor productivity
3.41
1.72
1.50
2.32
Contribution of capital deepening
2.87
1.69
1.33
1.23
Contribution of tangible capital
2.09
1.26
0.95
0.91
Contribution of intangible capital
0.78
0.43
0.38
0.32
Contribution of MFP growth
0.54
0.03
0.17
1.09
Figure 1: Business investment (Percentage of Business Output)
Source: Authors' calculation.
Source: Corrado, Hulten and Sichel (2006).
Japan
0
5
10
15
20
25
30
1980 1982 1984 1986 1988 1990 1992 1994 1996 1998 2000 2002 2004
%
Intangible Investment
Tangible Investment
US
8
9
10
11
12
13
14
15
16
17
18
1980 1982 1984 1986 1988 1990 1992 1994 1996 1998 2000 2002
%
Intangible Investment
Tangible Investment
Figure 2 : Sensitivity Analysis
Source: Authors' calculation.
6.00 7.00 8.00 9.00 10.00 11.00 12.00 13.00 14.00 15.00 1985-89 1990-94 1995-99 2000-2005 Base Case Case 1 Case 2 Figure 2-1: Share of intangible investment in Japan's GDP
(%, nominal) 0.00 0.20 0.40 0.60 0.80 1.00 1.20 1985-90 1990-95 1995-2000 2000-2005 Base Case Case 1 Case 2 Figure 2-2: Capital deepening (Intangibles)
-1.00 -0.50 0.00 0.50 1.00 1.50 1985-90 1990-95 1995-2000 2000-2005 Base Case Case 1 Case 2 Figure 2-3: MFP growth 1.00 1.50 2.00 2.50 3.00 3.50 4.00 4.50 1985-90 1990-95 1995-2000 2000-2005 Base Case Case 1 Case 2 Figure 2-4: Labor productivity