The (Lack of ) Experimental Evidence Supporting the Use of Accelerated Reader
Stephen Krashen
Journal of Children's Literature (2003) vol .29 (2): 9, pp. 16-30.
The purpose of this paper is to review the experimental evidence on Accelerated Reader (AR), probably the best-known reading management program. Accelerated Reader consists of the following elements:
- Additional time for reading is provided, along with - Increased access to books.
- Children take computerized tests on what they read and earn points. - Children can exchange their points for prizes.
If we wish to study the effect of these programs scientifically, we should compare groups that are very similar to each other, and that receive treatments that differ only with respect to the factor of interest. Thus, in the case of AR, it would be useful to study the impact of treatments that differ with respect to each of the four components.
The research literature has already provided us with some of what we need. There is consistent evidence that those who have more access to books read more (Krashen, 1993), and that those students who are provided with more time to do recreational reading (e.g. sustained silent reading programs) show better gains in reading achievement than comparison students. The effect is especially strong when such programs are allowed to last for one year or longer (Krashen, 1993; 2001; Pilgreen, 2000). On the basis of this research it would be expected that reading management programs that provide reading time and access to books will indeed result in gains in reading comprehension. The issue is whether the addition of tests and rewards makes any difference.
In addition, it is important to determine the long-term effects of rewards. A classic argument against the use of rewards is that it affects only short-term behavior (see McLoyd, 1979, discussed below).
This survey of the research is an update of a previous review by McQuillan (1997) on the effect of incentives, but focuses exclusively on the effect of AR on tests of reading comprehension. It begins with a review of studies that utilize standardized tests to measure student progress. Standardized test scores allow us to compare the progress of the group receiving the treatment with a norm, usually a national norm.
This kind of information is useful, but comparison with a national norm is often not appropriate. It is far preferable to compare the treated subjects with a group that is similar to them in terms of academic achievement, poverty, language background and other variables that can strongly influence performance.
The next category of studies attempts to compare those who participated in reading management programs with comparison students who did not. This solves the problem raised in discussion of the previous category of studies, but do not solve the problem of which aspect of AR is responsible for gains, if indeed gains exist. We will see that very few studies attempted to provide a comparison group that was also engaged in recreational reading. The lack of these studies is a serious gap. It is firmly established that providing access to books and time for free reading is
effective. AR differs from free reading only because it adds tests and rewards. If there is no evidence providing clear support for the use of these factors, there is no evidence in support of AR.
Performance on AR Students on Standardized Tests of Reading Comprehension
Turner (1993) examined the impact of AR in a New Jersey middle school. The treatment included one hour per week of sustained silent reading, trips to the public library, and additional literature added to the language arts class. The school
involved had an adequate school library (19.4 books per student). Those in grades 6 and 7 at the start of the study had the treatment for two years, those in grade 8 had the treatment for one year. AR included the usual tests and prizes, including pizza and ice cream parties. In addition, "... the names of the top scorer in fifth, sixth, seventh and eighth grade were etched into a permanent plaque outside the library ..."(p. 59).
Turner presented results of the CTBS reading comprehension test, administered in April 1991, and again in 1992 and 1993. The 1991 test can be considered the
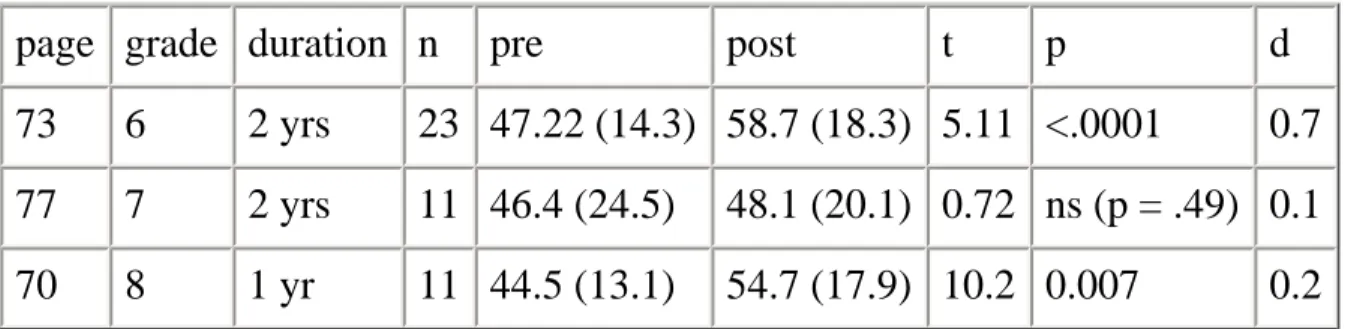
pretest. For grades 6 and 7, the 1993 test is the posttest, for grade 8 the 1992 test can be considered a posttest. Those who were sixth graders at the start of the study improved 10.5 percentile points relative to norms in two years, seventh graders grew less than two percentiles in two years, and eighth graders grew 10 percentiles in one year. I performed a matched pair t-test on the data (table 1). The gains were statistically significant for grades 6 and 8, but not for grade 7. The small sample size and the unusual variability in scores of the seventh graders on the pretest may have played a role here (note that the standard deviation for the pretest is high, sd = 24.5).
Table 1: Gains made in three grade levels using AR
page grade duration n pre post t p d 73 6 2 yrs 23 47.22 (14.3) 58.7 (18.3) 5.11 <.0001 0.7 77 7 2 yrs 11 46.4 (24.5) 48.1 (20.1) 0.72 ns (p = .49) 0.1 70 8 1 yr 11 44.5 (13.1) 54.7 (17.9) 10.2 0.007 0.2
From: Turner (1993).
Standard deviation in parentheses.
d = effect size (mean of post test minus mean of pretest/pooled standard deviation) Turner claims that "increasing reading activity had a positive relationship with improved reading comprehension" (p. 85), noting that those students who earned 40 or more points made better gains on the CTBS (in terms of NCEs, normal curve equivalents) than those who earned fewer.
To determine whether more points earned resulted in more gains, I performed a more detailed analysis, based on data supplied in Turner's paper. Multiple regression allows us to measure the effect of AR points earned on CTBS gains, controlling for the effects of previous reading ability. The results are surprising: For grades 6 and 8, those who earned more points made lower gains, but the effect was not statistically significant (for grade 6, b = -.134, p = .11; for grade 8, b = -.165, p = .24). For grade 7, those who earned more points made significantly greater gains (b = .128, = .02). This analysis shows that AR had a positive effect in grade 7, but not in the other grades, contrary to Turner's conclusion.
Potter (1994) reported on a middle school program that used "an accelerated reader program" and the Electronic Bookshelf. After two years, students improved 2.4 percentiles on the California Test of Basic Skills (CTBS), and Chapter I students improved 6.87 NCE's (Normal Curve Equivalents). Potter also noted that after four years "the school is still using the same program ... with success" (p. 245). Potter does not explain why he reported school-wide scores for two years, Chapter I scores for one year, and does not provide scores for the entire four years. Nor are we told why NCE's are used in one case and percentiles in the other. Nor were means, standard deviations, or sample sizes provided. Nor are we told the name of the middle school; thus, there is no way to confirm this data.
middle school in Arizona. Students were in grades 7 and 8, ages 12 to 15. AR was accompanied by an increase in the number of books available (an increase of 2000 books for a total of 282 students), which could have had a large impact, as about half (46%) of the students were classified as "economically disadvantaged" (p. 18). It was also clear that students were given special reading time in the classroom and library (pp. 13-14). More access to books was also provided through public
libraries, during the summer. The duration of the study was one full year.
The results are presented in table 2 in terms of grade-equivalent scores. These gains are not impressive. In one year, these students gained only three months in reading comprehension.
Table 2: Standardized test scores: one year of AR in Arizona VOCAB.
pretest posttest gain grade 7 5.52 (1.85) 6.29 (2.04) 0.77 grade 8 6.07 (2.09) 7.31 (1.24) 1.24
READING COMP
pretest posttest gain grade 7 5.50 (2.51) 5.78 (3.05) 0.28 grade 8 5.61 (2.84) 5.95 (3.89) 0.34
From: Goodman (1999)
Howard (1999) examined the impact of AR on children in grades three, four and five over one academic year. Before AR, 17% of third graders, 19% of fourth graders and 23% of fifth graders scored at or above grade level in reading
comprehension. One year later, these figures increased to 57%, 52%, and 41%. But a closer analysis revealed that the gains were not universal.
Howard divided her sample into low, average, and high AR users. Only the high user category was defined: High users were those who devoted at least one-half hour per day to AR reading. "Low users" gained only .73 grade levels during the
year, but high users showed remarkable gains, 2.24 years. Average users fell in the middle; 1.52 years. But few students were high users, only 11% of the sample. Most alarming is the finding that 65% of the poor readers (below grade level) were low users. Most (82%) of the high users were good readers (at or above grade level). Despite the fact that the Waitz Elementary School in Texas serves many low-income families, its children have done remarkably well on the TAAS test (Texas Assessment of Basic Skills), given in grades three through six. Nintyone percent of Waitz students passed the TAAS reading test in 1998, compared to the state average of 84 percent. In 1993, only 63% at Waitz passed the reading test. Renaissance Learning, the company that produces AR, claims that AR deserves some of the credit for high achievement at the Waitz: "Waitz's success is attributed to many factors including a commitment to time for reading practice and extensive use of Accelerated Reader" (http://research.renlearn,com/research/52.asp).
Renaissance does not indicate what these factors are, but according to the Waitz website, http://iweb.mission-cons.k12.tx.us/waitz/main.html, this school (pre K to 6) uses the following literacy programs in addition to Accelerated Reader: Literacy Lab (Early Success), Soar to Success, Reading Recovery, Hosts Learning,
Expressways to Learning, and Lexia, which includes several programs, such as the Herman Method, and the Hanson Initiative. Cawelti (2000) also points out Waitz uses bilingual education, phonics, whole language, paired reading, and "oral reading." Cawelti also states that there is one instructional aide for every two
teachers, "teachers give extra help to individual students during free periods or after school" (p. 43), and "on Saturdays, high school students and parents tutor students" (p. 43). There is also intensive test preparation with a focus on math, reading and writing. Students take six practice tests for the TAAS during the year. The school unashamedly "teaches to the test" - they "focus their efforts on results that are important to local parents" (p. 44). Cawelti also informs us that Waitz includes "silent reading" but does not provide any details.
Smith and Clark (2001) is a 192 page evaluation of AR as implemented in the McKinley district in Texas over one year (1999-2000). The Renaissance Learning website claims that this report "reveals districtwide success with Renaissance
programs." (www.renlearn.com), but a close look at the report shows that there is no evidence of "district wide success" - only a modest percentage of the students
appeared to profit from AR.
It appears that 2,717 of the 3,649 students in the district took AR quizzes, or 74% of the total student population (Smith and Clark, p.53, 54). Those who averaged above 90% on the tests grew about 1.36 years in reading over the academic year, a
AR quizes. The rest, those scoring under 90%, averaged nearly exactly one year's growth in one year (mean = .97). AR thus appeared to be of benefit to about 1/3 of those who took the quizzes, about 28% of the students in the district.
Reports from the Renaissance Website
The Renaissance website (renlearn.com) contains a number of short reports all claiming success for AR, and all submitted by "independent researchers." Because these reports appear on a commercial website, promoting a product, one would expect these reports to be positive. Nevertheless, some problems are revealed when the reports examined in detail. I present a few of these reports: All of involve
comparison to published norms.
Institute for Academic Excellence, Report 5: Craven County, North Carolina. AR was installed district-wide in Craven County in 1991. As evidence for the efficacy of AR, it is noted that the percentage of "pass rates" of Craven students (grades 3-8 combined) on tests of reading is consistently above the state average and increases from 1993 to 1998 from 66 to 81 percent.
We cannot interpret this increase as due only to the impact of AR, because state-wide scores also increased. Such increases are typical after new tests are introduced (Linn, Graue, and Sanders, 1990), but we do not know the history of state-wide testing in North Carolina. We also do not know whether Craven scores were above the state average before AR was installed.
We would like to know if Craven's scores increased more than the state-wide average. They did, but the difference is small. In 1993, after two years of
implementation, four percent more Craven students passed the state examination in reading than the state-wide average (Craven = 66%, state = 62%). In 1998, the difference was eight percent (Craven = 77%, state = 69%). By 1998, all Craven students had been exposed to AR, and older students had had five full years of AR. At best, the impact of AR was an increase of just a few percent more students passing the state exam: Craven students improved 11% from 1993-98, and the state-wide improvement was 7%.
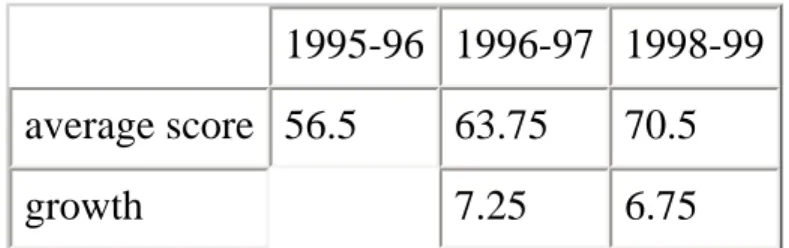
Institute for Academic Excellence 7: The Buford Elementary School (Georgia) Buford Elementary introduced AR in 1996. The scores presented in this report are for grades 1 through 4 (830 students). The 1995-96 scores can be considered the pretest.
Table 3: Increase in Reading Comprehension on the FCAT at Buford Elementary
1995-96 1996-97 1998-99 average score 56.5 63.75 70.5
growth 7.25 6.75
From: Inst. Ac. Ex. 7 1995-96 = pretest
The gains presented in table 3 are impressive. According to the report, this represents reading growth of three years over the two year period.
A look at the state of Georgia website data on Buford revealed one potential flaw in this cheerful picture. Buford fifth graders in 2001 scored at the 50th percentile in reading. These students were in first grade in 1996-97 and in second grade in 1997-98, and should have participated in the AR program. If their scores at these times were typical of other students at Buford, they were scoring at the 64th percentile in 96-97 and the 70th in 98-99. What happened? Perhaps Buford dropped AR. If so, it means AR had no lasting effect. Another reason could be due to the high mobility rate at Buford: The report noted that Buford has a mobility rate of 25%. Perhaps many of these fifth graders never did AR.
Institute for Academic Excellence, Report 8: The Heritage Middle School (Indiana)
This is a study of five grade 6 classes (125 students) taught by one teacher (Matthew Lind), who reported that he has been using AR for five years. Lind's report, however, is limited to one year, 1997-1998: The use of AR resulted in gains of 1.5 years, or 3.8 NCE points. This is an outstanding gain, and Lind shows that it was not limited to the better readers: In fact his 18 low readers (grade level 4.9 or
less) gained 1.8 years.
Renaissance Report 17: Monroe County, Florida
AR was used in an entire district of 6000 students over one year (1998-99). Renaissance claimed that
1. The lowest performing grade level improved from 56 to 65 on the SAT9 reading test. (Note that if the lowest performing group scored 56, this is a very
high-performing district.)
2. The highest performing grade level improved from 70 to 72.
3. The number of students scoring below the district's proficiency level dropped from 596 to 480 students.
An inspection of FCAT scores for Monroe students only partly confirms this improvement. Fourth graders in 1998 scored 311, eighth graders 306. Fourth graders in 1999 also scored 311, but eighth graders rose sightly, to 315. (http://www.firn.edu/doe/sas/fcat/fcinfopg.htm)
Renaissance Report 36: Troy Howard (Maine)
At the Troy Howard Middle School, AR was done with two classes of sixth graders, a total of 76 students, over one year. One class improved from the 40th percentile on the STAR test (designed by Renaissance) to the 49th percentile, and the other improved from the 48th to the 50th percentile. Thus, one class gained a substantial amount and the other did not.
Renaissance Report 51: Highland Renaissance Academy (North Carolina) The Highland Elementary school in Charlotte, North Carolina is so enthusiastic about Accelerated Reader and other Renaissance products that they have renamed their school the Highland Renaissance Academy. AR was introduced in 1998, along with 40 minutes of daily reading. In addition, students keep a daily "reading log." The report presented data combining reading and math scores. The gains appear to
be remarkable: In 1997, before AR was introduced, 36% of Highland students scored at or above grade level on the North Carolina "end-of-grade" math/reading test. This increased to 40% in 1998, 60% in 1999, 64% in 2000 and 75% in 2001. It should be noted that scores for the state of North Carolina as a whole also increased from 1998 to 2001, from 62% to 75% of students scoring above grade level (North Carolina, 2002).
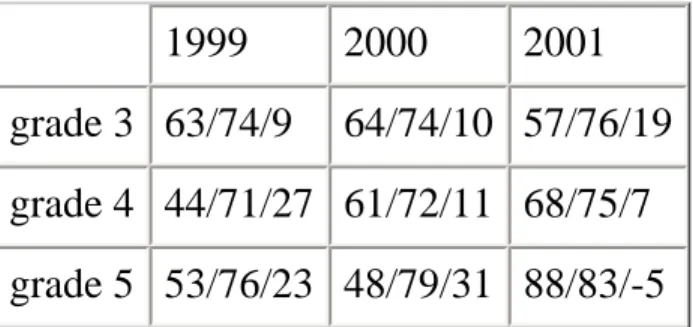
From the Highland Elementary website, I obtained the scores for reading only, broken down by grade. Highland did not indicate how many students were at each grade. I also include the state of North Carolina figures (North Carolina, 2002, table 2), followed by the difference between the two (table 4).
Table 4: Percentage of students scoring at or above grade level: Highland/State/difference
1999 2000 2001 grade 3 63/74/9 64/74/10 57/76/19 grade 4 44/71/27 61/72/11 68/75/7 grade 5 53/76/23 48/79/31 88/83/-5
From: Ren. Report 51
When viewed relative to state gains, Highland reading scores are still impressive for a high-poverty school. (It is not clear that Highland is as high-poverty as
Renaissance says it is. Renaissance claimed that 94% of Highland students had free or reduced price lunch. The Highland website indicates that between 44% and 86% receive free or reduced lunch, depending on the grade.)
The scores are, however, not as spectacular as they seemed before. They remain below the state average, but grades 4 and 5 show some signs of improving relative to state-wide scores. Grade 3, however, does not. Unfortunately, I could not find pre-AR scores for Highland and the State of North Carolina.
Renaissance Report 53: St. Monica
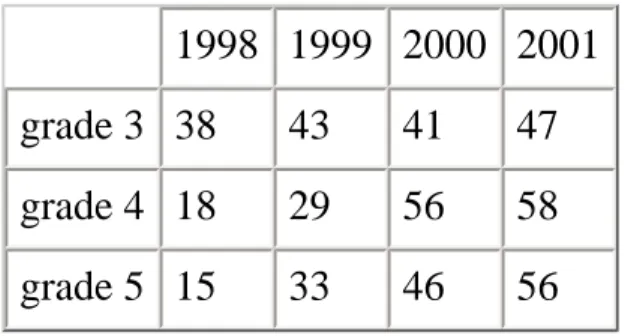
in a spectacular increase in reading scores. The report noted that "in 1998, average reading scores of fourth- and fifth-graders were far below the national norm ... by 2001 ... fourth and fifth graders demonstrated significantly improved reading ability that is well over the national norm. Over this period, third-grade test scores
increased 9 percentile points, while fourth- and fifth-grade scores improved 40 and 41 percentile points, respectively."
These do indeed appear to be huge increases (table 5). Table 5: ITBS: Total Reading Score at St. Monica
1998 1999 2000 2001 grade 3 38 43 41 47 grade 4 18 29 56 58 grade 5 15 33 46 56
From: Ren. Report 53
1998 = "pretest" (before AR implemented)
There are a few small blemishes. A look at the progress of cohorts of students (table 6) shows that from 1998 to 1999, one class of students got worse, scoring at 38 in grade 3 and declining to 29 in grade 4. They then, however, recovered nicely to 46 in grade 5.
Table 6: St. Monica scores: Cohort analysis
cohort 1 cohort 2 1998 38
1999 29 43 2000 46 56
2001 56
St. Monica includes K-6. One wonders why a wider range of scores was not
presented. Also, it would have been helpful to have 1997 scores as well. A problem with cohort analysis in this school is the high mobility rate (34%).
Despite these flaws, the scores at St. Monica are high, especially considering that students at this school are largely inner-city and high poverty (88% free or reduced lunch).
Renaissance Monograph: The Idaho Study
This monograph contains three evaluations, one for each year of AR, in Idaho. Student progress was measured with the Renaissance STAR test. The first
evaluation (1998-99) was based on about 13,000 children from 50 schools in Idaho, grades 1-9. Those who did AR gained 1.84 NCE's. Those in schools in which more teachers attended AR training made better gains. The second evaluation (1999-2000) produced similar results. It was based on slightly under 8000 students, grades 1-9, from 37 schools. The average gain was three NCE's. Again, there was a
relationship between gains and whether the teachers had AR training. About a thousand students were tracked for both years; they gained six NCE's over the two years.
The third evaluation is reported with much more detail. It was based on over 20,000 children, grades 1-9, from 76 schools. The average gain was five NCE's, but nearly all of this was in the early grades: "Grades one through four had the highest growth (29,9,4, and 5 percentiles respectively). Grades five through nine had less growth (0,-2,2,1, and 2 percentiles respectively)" (p. 2).
As was the case in earlier evaluations, students in schools in which teachers had more AR training made better gains. But those in schools in which teachers had more training also read more.
Some students had AR for three years (n = 401). They gained seven NCE's, but the average grade level of the books they read increased only from 3.1 to 4.5, that is, 1.4 years in three years (tables 13, 14). Some of these students were in schools that had "less than full implementation" of AR (p. 12).
Renaissance provides data on the average time spent reading for each grade level, as well as their estimate of the percentage of time spent reading that is above the
average for that grade level. For example, first graders averaged 17 minutes of reading per day, while fifth graders averaged 24 minutes. But that 17 minutes was more than double the time the average first grader reads (240%) while the 24
minutes for the fifth grade was 88% of the average for fifth graders. I calculated that the number of minutes spent reading did not predict gains (r = -.051) but the
percentage above average was a strong predictor of gains (r = .911). This makes sense when one hypothesizes that gains are clearly to related to amount read; norms on tests are based on average performance at that grade level.
Table 7 summarizes the results of studies using standardized tests without control groups
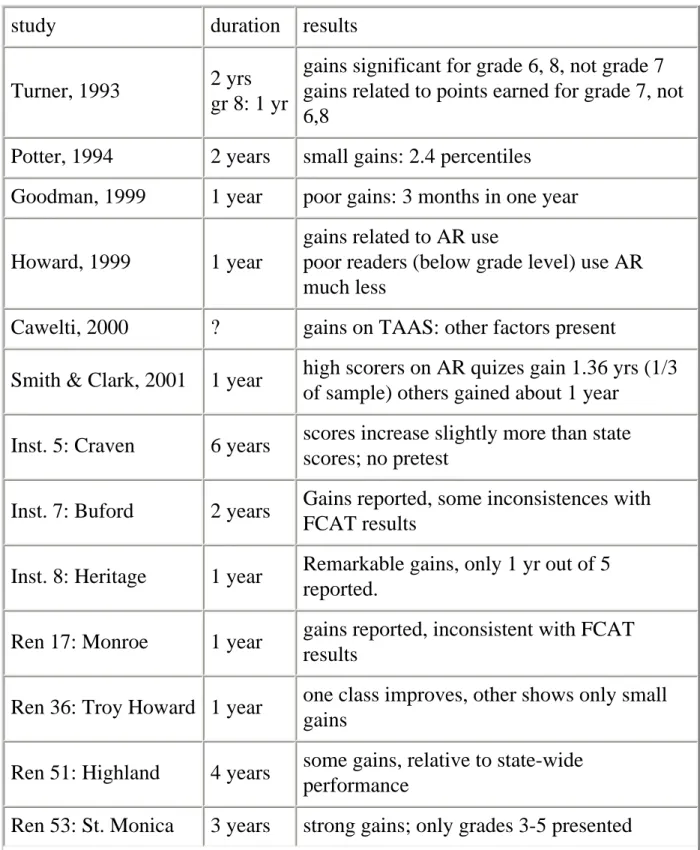
Table 7: Summary of studies using standardized tests, no comparison group
study duration results
Turner, 1993 2 yrs gr 8: 1 yr
gains significant for grade 6, 8, not grade 7 gains related to points earned for grade 7, not 6,8
Potter, 1994 2 years small gains: 2.4 percentiles Goodman, 1999 1 year poor gains: 3 months in one year
Howard, 1999 1 year
gains related to AR use
poor readers (below grade level) use AR much less
Cawelti, 2000 ? gains on TAAS: other factors present
Smith & Clark, 2001 1 year high scorers on AR quizes gain 1.36 yrs (1/3 of sample) others gained about 1 year
Inst. 5: Craven 6 years scores increase slightly more than state scores; no pretest
Inst. 7: Buford 2 years Gains reported, some inconsistences with FCAT results
Inst. 8: Heritage 1 year Remarkable gains, only 1 yr out of 5 reported.
Ren 17: Monroe 1 year gains reported, inconsistent with FCAT results
Ren 36: Troy Howard 1 year one class improves, other shows only small gains
Ren 51: Highland 4 years some gains, relative to state-wide performance
Ren: Idaho 3 years
gain of 7 NCE's in 3 years, yearly gains = 2-5 NCE's
more reading correlates with higher gains On the basis of the research on SSR one would expect AR to give positive results. Students are, after all, provided with more access to books and more reading time. But the results presented thus far, with the exception of the Idaho study, are not impressive. Sometimes claimed gains diminish when we consider published data from the school districts and the state and/or examine the reported data carefully. In fact, only the Idaho study provides truly strong data.
In addition, the Renaissance Independent Research Reports, according to
Renaissance, are "sent in by independent researchers." They are suggestive and interesting, but are not scientific studies. It is possible that there is a selection bias: It is possible that only the apparently successful cases are submitted to Renaissance, and it is possible that only the apparently successful ones are posted on the website. I have of course no evidence that this is so. But in scientific studies, results are published regardless of whether they favor one hypothesis or another.
Even if AR did well in these studies, they would not demonstrate its efficacy: it is possible that the only aspect of AR that has a positive effect is the increased access to books and increased time to read them. The only way to settle this is a controlled study.
AR Students Compared to Traditionally Taught Comparison Groups In the following studies, a real control group is used. In each case, however, the control group followed traditional language arts instruction.
Peak and Dewalt (1994) investigated the impact of AR on 50 randomly selected ninth graders in North Carolina who had used the system for five years; these students made better gains in reading than comparison students. Over five years, experimental students went from a mean of 716 (scale score) on the California Achievement Test (CAT) at grade 3 to a mean of 788 at grade 8, an average gain of 14.4 points per year, while comparisons went from 724 to 766 (8.4 points per year). In Mathis (1996) the AR group consisted of 30 sixth graders. Comparisons were the same children one year earlier. Thus Mathis measured the effect of AR on a group of children during grade six (one year duration) and compared gains to gains made
by the same children in grade five. Using AR, the children dropped about 1/2 of a point (.53) on the Stanford Achievement Test of reading. The year before, they fell 1/4 of a point (.27). The decline with AR was slightly greater, but these are very small declines. Both groups gained approximately one year in one year's time and AR made no difference.
Pavonetti, Brimmer, and Cipielewski (2003) administered the Title Recognition Test to seventh graders in three districts. The Title Recognition Test is a checklist that correlates highly with various measures of reading achievement (Cipielewski and Stanovich, 1992; Allen, Cipielewski, and Stanovich, 1992). Some of the titles included were: A Wrinkle in Time, The Outsiders, and My Side of the Mountain. For all districts combined, Pavonetti et. al. reported no difference between those children who had had AR in elementary school and those who had not.
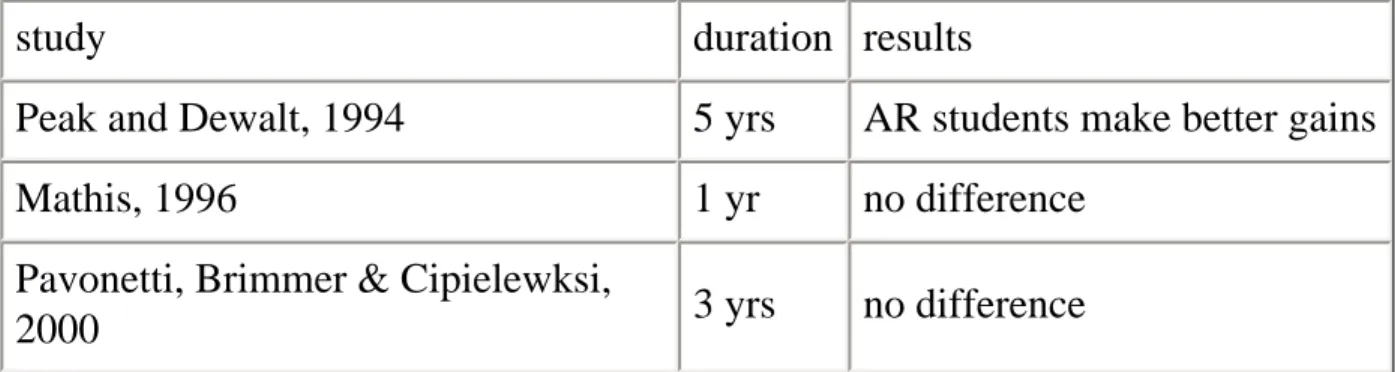
Table 8: Studies with Comparison Groups doing Traditional Instruction
study duration results
Peak and Dewalt, 1994 5 yrs AR students make better gains
Mathis, 1996 1 yr no difference
Pavonetti, Brimmer & Cipielewksi,
2000 3 yrs no difference
Table 8 summarizes studies with comparison groups doing traditional instruction. One would expect AR and related programs to do well in these studies, as
experimental students clearly read more than comparisons. Only Peak and Dewalt (1994), however, provide positive results. The other two, one with a long duration, showed no difference between AR and comparisons.
Studies with Comparison Groups that do Recreational Reading
We finally arrive at the gold standard, studies in which comparison groups, it is claimed, also did recreational reading. This is the sort of study that is needed to settle the issue of what aspect of AR is effective, if indeed AR is effective. Few studies have claimed to do this. Two of these studies appear in one publication, published in two versions. Vollands, Topping and Evans (1996) is an ERIC report, while Vollands, Topping and Evans (1999) is a slightly abbreviated version
independent studies, each lasting six months. In both cases, it is claimed that AR is compared to a group that did recreational reading. It is crucial to examine them in some detail.
Vollands, Topping and Evans: Project A
This study involved very few children, especially in the comparison group (n = 12; there were 27 in the experimental group). All were 11 years old. Comparisons had 30 minutes per day of "reading time" (Vollands et. al., 1999, p. 203), but had to give "written feedback on book completion to the teacher on what they read." The fuller description in Vollands et. al. (1996, p. 53) strongly suggests that this was not merely a record of what was read but was a full "book report"; students were free to read what others had written about a book before selecting it. This means that the "written feedback" provided by students included content and most likely opinion. The AR group in Project A had 15 minutes of reading time per day for the first five weeks of the project, which was then increased to 30 minutes. Students were also read to for 30 minutes per day, and were allowed to take AR tests on books read to them. Since it is established that readalouds have a positive effect on literacy development (Blok, 1999; Bus, van IJzendoorn, and Pellegrini, 1995), it can be argued that this read aloud time counts as exposure to reading. A factor that certainly depressed performance of the AR group was the fact that there was a severe shortage of books that the children could read and be tested on.
This study thus suffers from several problems. The comparison group sample size was small and they had to write book reports on what they read, a serious departure from pure recreational reading. Also, the AR group combined reading and read alouds: if read aloud time counts, the comparisons had less total exposure to comprehensible text. (According to Jeff McQuillan's calculations, controls had 3,600 minutes of reading. The AR group had 3,225 of reading time plus 2,850 minutes of listening to the teacher read aloud to them.)
The results are not clear. The AR group made better gains on one measure of reading comprehension (the Edinburgh, see table 9), but both groups declined on another test of reading comprehension, given only to a random subsample of the AR group. The AR group appeared to decline less, however.
Vollands et. al (1996, pp. 148-9) contains a very brief report of follow-up testing done three months after the project ended. As noted in table 9, the AR group gained 12.6 months over their previous score, and the comparisons gained 15.2 months, a
substantial recovery over their decline during the treatment period. These are spectacular gains for both groups, more than four times expected growth. Vollands et. al. provide no explanation for this.
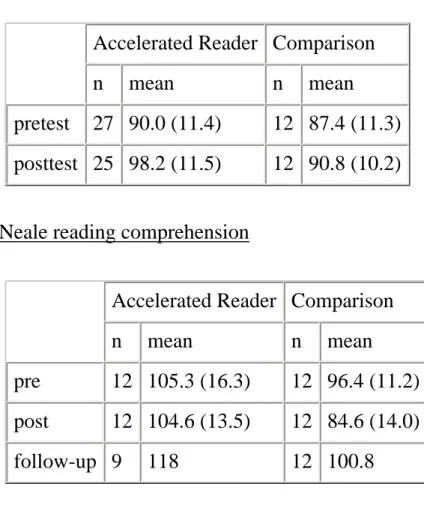
Table 9: Vollands et. al., Project A Edinburgh reading comprehension
Accelerated Reader Comparison
n mean n mean
pretest 27 90.0 (11.4) 12 87.4 (11.3) posttest 25 98.2 (11.5) 12 90.8 (10.2)
Neale reading comprehension
Accelerated Reader Comparison
n mean n mean
pre 12 105.3 (16.3) 12 96.4 (11.2) post 12 104.6 (13.5) 12 84.6 (14.0) follow-up 9 118 12 100.8
Standard deviations in parentheses
Thus, the AR group did better on one test, declined less on another, but did not gain as much on the follow-up. This study is not a comparison of AR versus recreational reading alone. It is a comparison of two programs in which students were held accountable for what they read, and the AR group had far more exposure to
comprehensible text. In addition, the sample sizes are so small that test results are probably not reliable.
Project B
minutes per day of sustained silent reading time during which they could read whatever (novel) they wanted to. Vollands et. al. (1999) noted that "children would write their name on a publicly displayed chart when they had finished their book" (p. 54). The comparison group was thus also involved in a kind of incentive
program. Comparison children also spent 20 to 60 minutes per week, depending on their reading level, reading from a selection of ten novels, with all reading done aloud by students, and answering comprehension questions in class or at home. This is hardly free voluntary reading. If we count only the genuine sustained silent
reading time, comparison children spent a total of 30 hours in actual free reading (15 minutes per day * 120 sessions (six months) = 1800 minutes = 30 hours). AR students in this study took the tests but received no rewards, bringing their treatment somewhat closer to genuine free voluntary reading. Points were, however, displayed in public. This study, thus, compared two versions of incentives: Points gained in AR tests displayed in public (the AR group) versus titles of books read displayed in public (comparison group).
As was the case in project A, the AR group suffered from a lack of access to books they could read and get credit for, which certainly affected their progress negatively. On the positive side, they were also read to, as were the AR readers in Project A, which most likely boosted their performance; the readaloud time, however, was counted as part of reading time (Vollands et. al., 1996, p. 78).
The AR group read for 15 minutes four times per week for the first three months of the project, and 20-30 minutes for the last three months. This amounts to 1920 minutes or 32 hours (for the first three months, or 12 weeks: 48 sessions * 15 minutes = 720 minutes; for the second three months, or 12 weeks, 48 sessions * 25 minutes = 1200 minutes, or a total of 1920 minutes).
Thus, the AR children read slightly more (two hours) than the comparison children. This is contrary to the claim made by Vollands et. al. (1999) that the comparisons read more. (All this is highly speculative. The detailed report, Vollands et. al., 1996, contains a number of diary entries. An entry for the last month of the project, March 1995, contains the following: "No information was available in terms of the average amount of time spent reading by the children in the class as the (AR) teacher did not keep a running note of this (although she had been asked to do this)." (p. 79). It is not clear whether this observation applied only to that month.)
Adding to the confusion, the AR students were sixth graders (11 year olds), while the comparisons were fifth graders (10 year olds), even though comparisons had higher pretest reading scores. Also, in the detailed report (Vollands et. al., 1996), it was noted that a thunderstorm occurred during the pretest for the AR students,
which was distracting: students "were more interesting in looking out the window than taking a reading test" (p. 98). Moreover, "cheating was witnessed" during the comparison group post-test!
The results are inconsistent. Comparison students made larger gains on one test of reading comprehension (Edinburgh) but AR students made larger gains on another (Neale), with comparisons making no gains at all on the Neale (table 10), a
mysterious result for a group of good readers. This inconsistency may be due to the fact that all 26 comparison students and nearly all AR students took the Edinburgh test but only a random sample of 11 AR students and 12 comparison students took the Neale comprehension test. If one considers the Edinburgh to be the valid
measure, comparisons doing less reading outperformed AR students who did more. Thus, this study could be interpreted as showing the failure of AR. The comparisons gained more, despite reading slightly less, on the test taken by the full sample. If the thunderstorm seriously affected pretest reading scores for the AR group, they
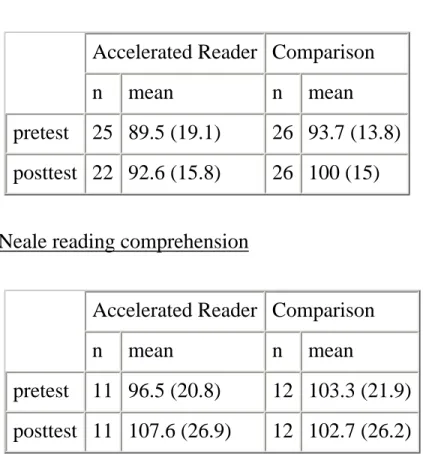
actually did worse than the results indicate. But if cheating on the posttest was widespread for the comparison groups, their gains would be exaggerated. These factors, the small sample size, inconsistency of the results, and the use of incentives in both groups makes it difficult to conclude much of anything from this study. Table 10 Volland et. al., Project B
Edinburgh reading comprehension
Accelerated Reader Comparison
n mean n mean
pretest 25 89.5 (19.1) 26 93.7 (13.8) posttest 22 92.6 (15.8) 26 100 (15)
Neale reading comprehension
Accelerated Reader Comparison
n mean n mean
pretest 11 96.5 (20.8) 12 103.3 (21.9) posttest 11 107.6 (26.9) 12 102.7 (26.2)
standard deviations in parentheses
Facemire (2000) also used a comparison group that was engaged in recreational reading. AR was used over a nine week period with 15 third graders in a low SES area of West Virginia. Extrinsic rewards were limited to "bookmarks and paperback books" (p. 28). The school library had a total of 8000 books but only 800 were designated by AR. AR students were given "as much time as possible, at least 20 minutes per day" (p. 35) for reading. They also were "guided to appropriate reading materials during regularly scheduled library visits, eighty minutes per week, and were given time to discuss literature" (p. 35).
The comparison children had access to the entire library collection, and did 20 minutes per day of SSR. They had the "regular third grade curriculum, book talks, and read-aloud sessions in the media center" (p. 36). Facemore does not mention whether the AR group also had the regular curriculum.
Comparison subjects gained about three months on the STAR reading
comprehension test. AR students gained more, about five months over the three month interval. The difference was statistically significant (t = 2.145, df = 14, comparing differences between gain scores). This is by far the most impressive result in favor of AR in the research literature.
Note, however, that the number of students in the study was small. With small samples, behavior of a few subjects can influence scores a great deal. The AR group, for example, contained one child who gained 2.3 years in nine weeks! If we remove this "outlier" the AR mean gain drops to about four months The comparison group had one child who got much worse, dropping more than one year (1.1) in nine weeks. If we remove this outlier, the comparison mean increases to three and a half months. Some researchers would discard these subjects because they fall so far away from the group mean. (Facemore, in fact, discarded two students in the AR class who could not pass any of the AR tests and "had chosen not to participate in any way in the AR program" (p. 32).) A more prudent policy, in my opinion, is to include analyses with and without outliers. Excluding the outliers results in
practically no difference between the groups.
Finally, it is likely that the AR students read more than the comparison subjects. They had "at least" 20 minutes per day of SSR, while comparisons had exactly 20 minutes. While comparions had "access" to the library, AR students had a regularly scheduled 80 minutes per week.
This study is an important step in the right direction, in my opinion. There is a comparison group, and an attempt is made to note the amount of reading done.
More precise data on the amount of actual access to books and reading time would be helpful, as would a larger sample size.
Table 11: Comparisons of AR with Control Group that did Recreational Reading
study duration
Vollands et. al., 1966
Project A 6 months
AR have more exposure to comprehensible text
Comparisons wrote book reports AR better on immediate test
Comparisons gain more on delayed test
Vollands et. al., 1966
Project B 6 months
AR: points earned displayed (no other rewards)
Comparisons: names of readers displayed AR: slightly more exposure to comprehensible text
AR better on one test, comparisons on the other
Facemire, 2000 9 weeks
AR rewards = books and bookmarks Comparisons also do SSR
AR gain more; two serious outliers
Not clear if AR read more, have more access
What can we conclude? In agreement with McQuillan (1997), I conclude that the research provides inconsistent evidence in support of incentive-based reading management programs. In a review of 14 reports in which standardized tests were used to determine the effectiveness of incentive-based systems (table 7), in all cases except one (Idaho study), gains were not present or small, limited to a subgroup of students, inconsistent with other data on the same students, or only a subgroup of scores were reported. Of three studies in which AR is compared to traditionally taught comparison groups (table 8), a clear advantage for experimental students was found in only one study (Peak and Dewalt, 1994).
Even if the results of all of these studies had favored students in incentive-programs, we would not be able to determine why the program worked. To do this requires comparison with a group that also engaged in recreational reading and had plenty of access to books, but did not have tests and rewards. Three studies were found that claimed to compare AR with such comparison groups. In two cases, the AR
students actually had more exposure to comprehensible text. Also, in these studies, the comparisons were not in a purely recreational reading program; in one case they
wrote book reports, in another they also had incentives. AR did very well in a third study, but the sample size was small, the duration short, there were two serious outliers in the sample, and it is likely that AR students did more reading.
Long term effects
None of the studies included long term follow-up data telling us if children continue to read after the incentive system is no longer in place. This is crucial in light of McLoyd's finding (McLoyd, 1979) that the use of rewards inhibits subsequent reading.
McLoyd (1979) asked second and third graders to read from "high interest" books under three conditions: a "high reward," "low reward" and "no reward" condition. In the high reward condition, children were promised a reward that they rated the most highly out of six presented. In the low reward condition, children were promised a reward that they rated the least highly out of six presented (Accelerated Reader can be considered a high reward system, because children can exchange points for a wide variety of prizes).
It was explained to the children that the reward would be granted if they read up to a marker in the text (indicating 250 words), and that the experimenter was interested in their opinion of the book. Rewards were not mentioned to the children in the no-reward condition; rather, they were simply asked to read up to the indicated place in the text and to then give their opinion of the book. The reading sessions lasted for ten minutes. (McLoyd also included a group reading from "low interest" books; I consider here, however, only the high interest group, children reading a book that they rated the most interesting out of six books presented to them. This group is of the most interest to us, because it reflects what is or should be the case in sustained silent reading and in most reading management programs.)
Both rewarded groups read only what they had to in order to get the reward, barely going beyond the 250 word maker. The no-reward readers went well beyond this point; they were engaged in reading about twice as much than the two rewarded groups, and read more than twice as much.
Robbins and Thompson (1991) did a separate study of seven low-achieving readers who participated in their incentive program. For at least four of the seven low-achievers, the incentive program had no lasting effect. One low-achiever, Walter, continued reading after the program ended (p. 67), but Timmy, "didn't do much reading ... once the summer reading program ended" (p. 65). Octavious earned all
his points in the first few weeks, then his reading "slowed considerably" (p. 71). Sann "found little time for reading and library visits ... as the summer ended" (p. 73)." The incentive program clearly had no impact on Jason, who remained a reluctant reader (p. 69). Robbins and Thompson's analysis thus suggests that rewards do not "jump start" reading interest.
There is, thus, suggestive evidence that the use of incentives does not have positive long-term effects on reading frequency and enthusiasm. The studies reviewed here were short-term and the focus was on the impact of AR on reading achievement. If the amount of actual reading children do is the cause of their reading achievement, one could argue that long-term reading frequency is the crucial issue. Studies must ask whether AR contributes to a reluctant reader becoming an enthusiastic reader long after the program ends.
Conclusion
The results presented here strongly suggest that of the four aspects of AR, access to books, time devoted to reading, tests, and rewards, only the first two are supported by research. There is considerable evidence that providing access to books results in more reading and better reading and considerable evidence that providing time to read results in better reading. There is suggestive evidence that incentives do not promote additional reading in the long term. The AR research literature does nothing to change these conclusions.
A hypothetical example may help us understand whether AR should be used or not. Drug A and Drug B are both designed to cure a specific disease. A is known to be effective with highly beneficial long-term effects. There is little evidence for or against B, but suggestive evidence that it may be harmful in the long run. A drug company produces AB, more expensive than A alone, and justifies it by providing studies showing that AB tends to be effective. A scientist reviewing the research shows that no study has compared AB to A alone. Clearly such studies are called for before the medical establishment endorses or even approves AB. A is providing access and time to read. B is tests and rewards. Accelerated Reader is AB. Obviously our first priority should be to make sure that high-interest reading material is easily available to students, and that students have time to read and a place to read. Ironically we have not even done this for many students. Instead, we rush off to purchase a more expensive, complex package that may have long term harmful effects.
References
Allen, L., Cipielewski, J., & Stanovich, K. 1992. Multiple indicators of children's reading habits and attitudes: construct validity and cognitive correlates. Journal of Educational Psychology, 84, 489-503.
Blok, H. 1999. Reading to young children in educational settings: A meta-analysis of recent research. Language Learning, 49(2), 343-371.
Bus, A., van IJzendoorn, M., & Pellegrini, A. 1995. Joint book reading makes for success in learning to read: A meta-analysis of intergenerational
transmission of literacy. Review of Educational Research 65, (1), 1-21. Cawalt, G. 2000. Portrait of a benchmark school. Educational Leadership, 57(5), 42-44.
Cipielewksi, J. & Stanovich, K. 1992. Predicting growth in reading ability from children's exposure to print. Journal of Experimental Child Psychology, 54, 74-89.
Facemire, N. 2000. The effect of the accelerated reader on the reading comprehension of third graders. ERIC Document ED 442 097
Goodman, G. 1999. The Reading Renaissance/Accelerated Reader Program. Pinal County School-to-Work Evaluation Report. ERIC Document ED 427 299
Howard, C. 1999. An evaluation of the Accelerated Reader program in grades three, four, and five on reading vocabulary, comprehension, and attitude in an urban southeastern school district
Krashen, S. 1993. The Power of Reading. Inglewood, CO: Libraries Unlimited.
Krashen, S. 2001. More smoke and mirrors: A critique of the National Reading Panel report on fluency. Phi Delta Kappan, 83, 119-123.
Krashen, S. 2001b. Current research: The positive impact of libraries. California School Library Journal 25/1, 21-24.
Linn, R., Graue, E., and Sanders, N. 1990. Comparing state and district test results to national norms: The validity of claims that "everyone is above average." Educational Measurement: Issues and Practice 10: 5-14.
Mathis, D. 1996. The effect of the Accelerated Reader program on reading comprehension. ERIC Document ED 398 555
McLoyd, V. 1979. The effects of extrinsic rewards of differential value on high and low intrinsic interest. Child Development, 50, 1010-1019.
McQuillan, J. 1997. The effects of incentives on reading. Reading Research and Instruction, 36, 111-125.
North Carolina 2002. The North Carolina State Testing Results. http://www.ncpublicschools.org/accountability/testing/reports/
Pavonetti, L., Brimmer, K., & Cipielewski, J. 2003. Accelerated reader: What are the lasting effects on the reading habits of middle school students exposed to Accelerated Reader in elementary grades? Journal of Adolescent and Adult Literacy, 46(4), 300-311.
Pilgreen, J. 2000. The SSR Handbook. Portsmouth, NH: Heinemann.
Peak, J. & Dewalt, M. 1994. Reading achievement: Effects of computerized reading management and enrichment. ERS Spectrum 12: 31-34.
Potter, L. 1994. Putting reading first in the middle school: The principal's responsibility. Reading Improvement 31: 243-245.
Institute for Academic Excellence, Report 5. 1999. District-wide impacts of Accelerated Reader® and Reading Renaissance® in Carven County, North Carolina. Madison, WI: The Institute for Academic Excellence. See also: www.renlearn.com.
Institute for Academic Excellence, Report 7. 1999. Georgia elementary school achieves growth in ITBS scores through Reading Renaissance implementation. Madison, WI: The Institute for Academic Excellence. See also:
www.renlearn.com.
Institute for Academic Excellence, Report 8. 1999. Reading gains reported at Indiana Middle School. Madison, WI: The Institute for Academic Excellence.
See also:
www.renlearn.com
Renaissance Independent Research Report 17. 2001. Districtwide
Renaisaance® implementation results in all eight elementary schools in Monroe County scoring an "A" in reading on the Florida Comprehensive Assessement Test. Madison, WI: Renaissance Learning. See also:
www.renlearn.com.
Renaissance Independent Research Report 36. 2001. Maine middle school achieves academic success with Renaissance comprehensive schoolwide program. Madison, WI: Renaissance Learning. See also:
www.renlearn.com.
Renaissance Independent Research Report, 51. 2002. Inner-city school more than doubles passing rates on North Carolina end-of-grade test. Madison, WI: Renaissance Learning. See also:
www.renlearn.com.
Renaissance Independent Research Report, 53. 2002. Inner-city school with 88% poverty rate triples ITBS test performance. Madison, WI: Renaissance Learning. See also:
www.renlearn.com
Renaissance Monograph. 2002. Results from a three-year statewide
implementation of Reading Renaissance in Idaho. (A Renaissance Learning Monograph). Madison, WI: Renaissance Learning. See also:
www.renlearn.com.
Robbins, E. & Thompson, L. 1991. A study of the Indianapolis-Marion
County public library's summer reading program for children. ERIC Document ED 355 647
Smith, E., & Clark, C. 2001. School Renaissance Comprehensible Model Evaluation. Prepared for the School Renaissance Institute by the Texas Center for Educational Research.
www.renlearn.com
Turner, T. 1993. Improving Reading Comprehension Achievement of Sixth, Seventh, and Eighth Grade Underachievers. ERIC Document, 372 374.
Vollands, S., Topping, K., & Evans, R. 1996. Experimental evaluation of computer assisted self-assessment of reading comprehension: Effects on reading achievement and attitude. ERIC Document, ED 408 567.
Vollands, S., Topping, K., & Evans, R. 1999. Computerized self-assessment of reading comprehension with the accelerated reader: Action research. Reading and Writing Quarterly 15, 197-211.
Waitz Elementary School, "Waitz Elementary: Seven Years Exemplary," http://iweb.mission-cons.k12.tx.us/waitz/main.html,. Accessed November 13, 2002.