This article can be dowloaded from: http://www.nopecjournal.org/NOPEC_2009_a04.pdf Other articles from the Nordic Journal of Political Economy can be found at:
http://www.nopecjournal.org
ISSN 0345-8555
Volume 35 2009 Article 4
The Labour Market Impact of Recent Immigration
on Ethnic Groups in The UK
Ken Clark and Stephen Drinkwater
∗
∗ Ken Clark: University of Manchester and IZA, Bonn. Stephen Drinkwater: Swansea University
Ken Clark and Stephen Drinkwater
The Labour Market Impact of Recent
Immigration on Ethnic Groups in the UK
1
Abstract
The UK experienced has unprecedented levels of immigration in the last decade. These inflows were particularly pronounced following EU enlargement in May 2004, since when the UK has received a huge influx of migrants from Central and Eastern Europe. Although existing studies have suggested that the impact of these migration flows on the UK labour market in general has been small, little is known about the effect on particular demographic sub-groups. We begin to fill this void by examining the effect of recent immigration on the labour market experiences of individuals from different ethnic groups. This analysis is important because of the labour market disadvantages that certain minority groups have previously encountered, the continued rapid population growth experienced by some groups and concerns regarding social cohesion. Using the Labour Force Survey, our econometric estimates suggest that recent immigration has had a small negative impact on labour market outcomes, with a slightly greater effect on native born whites compared to ethnic minorities, although some variation is also found between minority groups.
JEL Classification: J61, F22.
Keywords: immigration, labour market outcomes, ethnic minorities
1 Material from the Quarterly Labour Force Survey is Crown Copyright and has been made available by the Office for
National Statistics through the Data Archive at the University of Essex. We would like to thank an anonymous referee and participants at a workshop on the Labour Market Impacts of Immigration - Who are the Winners and Who Stands to Lose? held in Oslo in May 2008 for helpful comments. The views expressed in this work and errors therein are those of the authors.
1. Introduction
Debates surrounding the impact of immigration have become increasingly important in the UK in recent years. In particular, discussions within the media and policy circles have grown considerably following EU enlargement in 2004, since when immigration to the UK has risen on an unprecedented scale. A key factor in these population inflows was the decision of the UK government, along with those of Ireland and Sweden, to allow migrants from the eight central and eastern European countries entering the EU in 2004 (which have collectively become known as the A8) to work in their labour market. Although there are no exact figures on the extent of A8 migration, it is known to be substantial, with estimates suggesting that over 1 million nationals from these countries entered the UK between the middle of 2004 and end of 2007 (Pollard et al., 2008). Not only has the sheer extent been on a different scale to previous waves of migration but there have also been several other notable features of migration to the UK from the A8 group of countries. These include the preponderance of short term moves, the fact that A8 migrants are overwhelmingly young workers who have found employment in relatively low skilled and low paying jobs despite being comparatively highly educated and their geographically dispersed location patterns. As a result, this recent wave of migration is likely to have a varying influence on different demographic groups. In this paper, we approach this issue from the perspective of analysing the impact of rising immigration to the UK on the labour market position of members of ethnic minority groups who are already resident.
There is a handful of existing studies which investigate the impact of post-enlargement flows of A8 migrants on the UK labour market. In particular, Blanchflower et al. (2007), Gilpin et al.
(2006) and Lemos and Portes (2008) argue that the impact on overall labour market outcomes, particularly focusing on unemployment, is likely to have been very small. This accords with previous evidence on the impact of past migration flows on the UK labour market, such as by Dustmann et al. (2005), who report only very small effects on wages and employment. However, different demographic groups may be affected to varying degrees by large migration flows. For example, it is noted in Blanchflower et al. (2007) that although there has been no negative effect of recent A8 migration at the aggregate level, some rise in youth unemployment has been observed, although they discount the recent population inflows from abroad as a contributing factor. However, there currently exists no evidence for the UK on the impact of the large migration flows since 2004 on the labour market outcomes of ethnic minorities or even much on the previous (smaller) migration flows. One exception is Manacorda et al. (2006), who, in addition to arguing that this small overall effect may be due to imperfect substitution between natives and immigrants, and because the immigrant share in the UK has been quite small, find that the main impact of increased migration to the UK has been on previous immigrants.
Analysis of the impact by ethnicity is important for several reasons. These include the continued rapid population growth of certain groups, the labour market disadvantages that some groups have previously encountered and concerns regarding social cohesion and community relations. In terms of the first of these, the percentage of nonwhites in England increased by around 2 percentage points (from 9% to 11%) in just the first half of this decade. The presence of nonwhites amongst younger sections of the population is particularly noticeable, representing at least 15% within the three younger age categories (0-15, 16-24 and 25-34). Given their younger age structure, ethnic minorities may have been more affected by the migration of young workers into low skilled occupations. This implies a conflict may have been created between the policy targets and initiatives aimed at ethnic minority groups, such as by the Ethnic Minority Employment Task Force, and the large-scale migration from the A8. Alternatively, policy measures aimed at ethnic minorities may have mitigated the effects of A8 migration. It could also be the case that employers are more likely to replace ethnic minority workers with A8 migrants, or to not hire minorities in the first place, a view which has received some anecdotal support. For example, in the recent House of Lords Economic Select Committee report into the economic impact of immigration, it was
recorded that “Slough Council said that some of the Pakistani community in the borough felt their jobs were being lost to the new incoming Polish community, which is higher skilled and prepared to work for lower wages” (pp. 27-8). The perceived loss of jobs by Asians to Eastern Europeans has also led to increased tensions between these groups in some parts of the UK (Smithard, 2008).
In contrast to the paucity of UK evidence on the impact of new migration on the labour market outcomes of native born minorities and more established immigrants, there exists quite a large literature on this issue in the US. Borjas (1987) calculates elasticities of substitution between migrants and different groups of natives, including Blacks and other minority groups, using the 1980 Census. He finds that immigrants are substitutes for some labour market groups and complements with others. In particular, it is found that an increase in immigration has a small impact on the earnings of natives (causing a slight fall for Whites and a slight increase for Blacks) but a much larger effect on the earnings of other immigrants. This implies that immigrants’ main labour market competitors are other immigrants. There is also evidence from specific migration flows, including on the impact of the Mariel boatlift on the Miami labour market Card (1990). He reports that there was a differential impact of the increased labour supply, although it only negatively affected other Cuban immigrants, with much smaller effects on Whites, Blacks and non-Cuban Hispanics. Whilst Winegarden and Khor (1991) examine the effect of undocumented immigration on age-specific unemployment rates for Blacks and Whites using a simultaneous equation framework. Their results indicate that undocumented immigration has a small but significantly positive influence on the unemployment rates of White youths, however a similar effect could not be found for either young or older Blacks. More recently, Borjas et al. (2006) report evidence that immigration has reduced the wages and employment rates, and increased the incarceration rate, of African American males. Their estimates suggest that a 10% increase in labour supply within a particular skill group reduces the wages of Black males by 4% and employment rates by 3.5 percentage points.
In this paper, we examine the impact that the recent large flows of migrants to the UK have had on the labour market experiences of different ethnic groups. To achieve this we focus on four outcomes: participation, employment, unemployment and wages. In the descriptive analysis, we compare labour market outcomes across a range of ethnic and migrant groups. The econometric analysis, which is based on recent approaches such as Borjas (2003), mainly concentrates on the impact on ethnic minorities compared to white natives but we also present some results at a finer level of disaggregation. Our analysis covers the period from 2000 to 2007, which corresponds to a time when immigration to the UK rose rapidly. This is particularly true in the immediate aftermath of the 2004 enlargement of the EU. Our cut-off point is the end of 2007 because the labour market had began to slow in the UK and there was also a decrease in immigrant flows, which have continued to decline at a rapid pace since.
2. Ethnicity and the UK Labour Market
The immigration that took place to the UK in the second half of the Twentieth Century mainly emanated from (new) Commonwealth countries, initially to fill labour shortages in the public and other key labour market sectors.2 This began in the late 1940s with the arrival of immigrants from the West Indies, who continued to enter the UK in fairly large numbers until the early 1970s. Indian migrants started to arrive in the late 1950s, with steady inflows from this country up to the end of the 1990s, since when the extent of these flows has increased. Part of this is likely to be the result of the ending of the Primary Purpose Rule in 1997, which led to a significant increase in the number of partners and spouses entering the UK, but there was also a large rise in the number of Indian nationals receiving work permits. These increased from under 2,000 in 1995 to almost 30,000 in
2005 (Salt and Millar, 2006). A similar immigration pattern can be observed from Pakistan, with migrants from Bangladesh tending to enter the UK at a slightly later date, with numbers peaking in the late 1980s. In contrast, the Chinese have a less concentrated arrival pattern but there have been notable flows during the 1980s, 1990s and 2000s. Finally Black Africans mainly arrived in the 1990s, with again the large inflows continuing past the turn of the century.
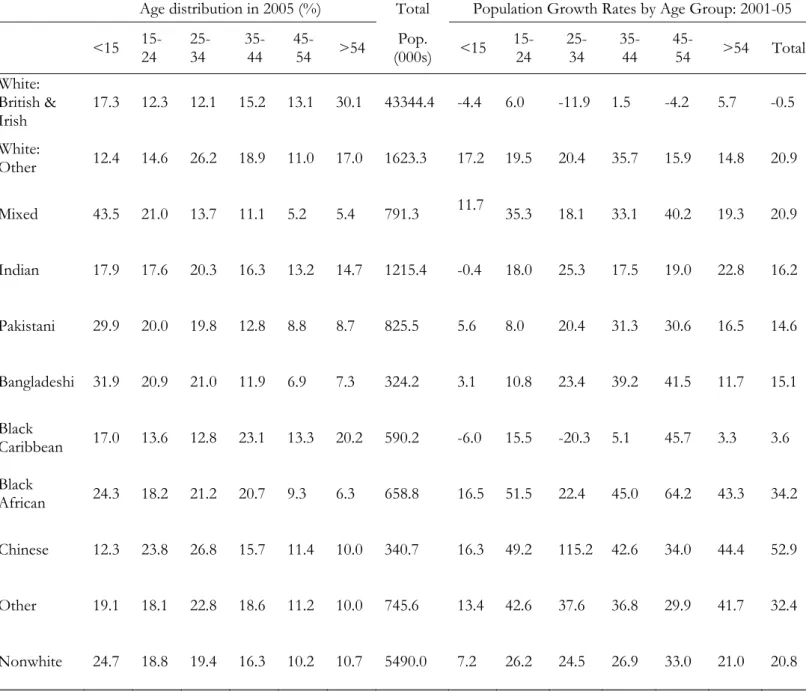
These arrival patterns have influenced the ethnic composition of the UK population. This is shown in Table A1, which uses data from the population estimates by ethnic group that have recently been produced by the Office for National Statistics for England.3 Despite this relatively short timeframe it can be seen that population growth has been very rapid for some groups, notably the Chinese, Black African and Other ethnic groups, whilst the only group to experience a population decline over this period was White British & Irish. These migration patterns have also led to a different age structure for many in comparison to White natives. In particular, in 2005 there was a relatively high percentage of Black Africans, Pakistanis, Bangladeshis and individuals with a mixed ethnic background in the 0-15 and 16-24 age categories. The different age structure of these groups implies that they are likely to be affected very differently by labour market shocks (including population inflows), both with respect to the groups that are currently most at risk as well as in future given the increasing flows entering the labour market from education.
Table A2 contains further details on the demographic characteristics of ethnic groups in the UK. In addition to providing confirmatory evidence on the age and the immigrant profile of the main ethnic groups, it also reports the regional distribution and educational attainment of the groups. These data relate to the period from 2000-3 and have been obtained from the Quarterly Labour Force Survey (LFS). This is the main source of information on the UK’s immigrant population, especially given the vastly changed picture of immigration to the UK since the 2001 Census. The LFS is a representative sample of households and has been used fairly extensively to examine the labour market outcomes of ethnic minorities and immigrants (e.g. Blackaby et al., 2002; Dustmann and Fabbri, 2005). Given that households are supposed to stay in the survey for five waves, we only use wave 1 interviews so as not to double count, however successive quarters of data are pooled in order to achieve adequate sample sizes for each ethnic group. The sample is restricted to only working age respondents and excludes full-time students.
Table A2 also indicates that most ethnic minority groups are also clustered in metropolitan areas (London, Midlands and some Northern cities). The ethnic minority groups have higher levels of educational attainment than Whites, especially groups such as the Chinese, Black Africans and Indians but far less so for Pakistanis, Black Caribbeans and Bangladeshis. This is partly due to the younger age structure of ethnic minority groups but there are other explanatory factors such as a greater incentive to acquire post-compulsory education because of discrimination in the paid labour market and cultural influences, including the expectations of family members (Leslie and Drinkwater, 1999).
The different arrival patterns of the ethnic minority groups in the UK have also contributed to their diverse performances in the labour market. For example, the groups which have experienced the greatest labour market disadvantage include Pakistanis, Bangladeshis and Black Africans, who are amongst the more recent arrivals. However, many other factors have been found to be important in accounting for the ethnic diversity seen in labour market performance including variations in human capital accumulation and in patterns of discrimination as well as differences in location patterns and tastes for isolation (Blackaby et al., 2002; Clark and Drinkwater, 2007). Differences have also been noted in the performance between males and females from the same ethnic group such as Black Caribbeans, which can in some part be attributed to family issues such as high rates of marital instability. Whilst religion can have a large influence on the labour market outcomes of some groups, especially females from Muslim groups such as Pakistanis and Bangladeshis, who have extremely low rates of employment and economic activity. For both males
and females, it has been found that the highest earnings and lowest unemployment have typically been observed for the Chinese and Indians, whose outcomes are not dissimilar to those of Whites.
Table 1 updates the previous studies by presenting broad labour market differences between ethnic groups based on information from the LFS. It reports similar patterns to those highlighted above such as the relatively high earnings and low unemployment of Indians and the Chinese, the opposite for Pakistanis and Bangladeshis, whilst the Black and Mixed groups appear in the middle. The high rates of economic inactivity amongst Pakistani and Bangladeshi females is a major influence on the low employment rates of these groups as a whole, although both Bangladeshi males and females have tended to suffer from very high unemployment rates. Whilst the self-employment rate is very high for Pakistanis, especially males, partly reflecting difficulties in obtaining suitable jobs in the paid employment sector (Clark and Drinkwater, 2007). Some minority groups also have a very high proportion of students, as shown by the discrepancy in employment rates with and without the inclusion of students, which accords with the educational statistics reported in Table A2. The regional distribution of the ethnic minority workforce, especially concentrations in London, results in raw earnings statistics that are similar to Whites, whilst they are quite substantially higher for the Chinese. In contrast, average earnings are much lower for Pakistanis and Bangladeshis, with many having only low wage jobs. There are also differences by gender, with nonwhite males tending to have relatively low earnings in comparison to their White counterparts.
3. Recent Migration to the UK
In contrast to most EU member states, which introduced transitional arrangements that effectively blocked A8 nationals from accessing their labour market following the 2004 enlargement, the UK government decided that migrants from the new member states could enter its labour market more or less freely.4
The only real restriction was that in order to take up employment in the UK, A8 nationals were required to register on the Worker Registration Scheme (WRS).5 Partly because of their much smaller economies, comparatively few migrants have gone to Ireland and even fewer to Sweden. Evidence of these patterns comes from Kepinska (2006), who uses the Polish LFS to confirm that the UK is now the most important country for Polish migrants, having overtaken Germany for the first time in 2006, since it accounted for almost a third of all Polish emigrants, compared to just 4% in 2000.
4 A8 migrants could move without restriction to Sweden after enlargement, whilst Ireland introduced similar
arrangements to the UK. A8 migrants could also move to Denmark from May 2004 but the arrangements were more restrictive than in Ireland, Sweden and the UK in that work permits were only issued for one year. In April 2006, four other member states (Finland, Greece, Portugal and Spain) announced that they were lifting the restrictions that they had imposed two years earlier. Italy, Luxemburg and the Netherlands also lifted their restrictions in 2007.
5 Applicants are supposed to register more than once if they have more than one employer and also reregister if they
change employer. The cost per registration was initially set at £50 but has subsequently been raised to £70 in October 2005 and currently stands at £90. A8 nationals also have restricted access to welfare benefits.
Table 1: Labour Market Characteristics of Ethnic Groups in the UK (2000-3) and for Recent Migrants (2004-7)
Economic Activity
Gross Hourly Earnings
(June 2005 £’s) Occupation (%)
Emp. Rate E.R. (N.S.) Unemp. Rate
Self. Emp.
Rate Mean S.D. Median Q3 Q1 Low Medium High
White 74.7 77.3 4.5 12.3 10.4 7.7 8.4 12.6 5.9 34.1 26.5 39.4 Mixed 61.0 68.0 12.1 9.5 10.4 7.0 8.3 12.5 6.0 33.5 23.3 43.2 Indian 65.0 71.1 6.8 15.0 10.8 8.1 8.4 13.1 5.9 33.2 21.8 45.1 Pakistani 40.9 45.9 13.4 26.5 8.8 6.3 7.0 10.6 4.9 51.6 16.9 31.5 Bangladeshi 35.8 39.9 19.4 15.1 6.6 4.1 4.9 7.9 4.1 47.0 26.5 26.5 Black Caribbean 65.1 69.4 10.6 8.6 10.2 8.8 8.8 12.4 6.4 36.1 29.4 34.5 Black African 53.6 62.0 13.4 8.1 10.0 8.2 8.6 12.4 6.0 41.0 15.8 43.1 Chinese 58.4 72.8 5.0 23.3 11.5 9.0 8.4 14.1 5.8 25.1 22.5 52.4 Other 54.8 60.8 9.8 11.9 10.4 7.0 8.4 12.5 6.0 35.5 16.3 48.2 Nonwhite 55.5 61.9 10.2 14.3 10.2 7.4 8.3 12.4 5.8 37.2 21.0 41.7 Recent A8 migrants 80.3 82.2 7.9 5.0 6.2 2.8 5.6 7.1 4.9 76.9 15.6 7.6
Other recent migrants 55.9 63.6 11.8 6.4 10.6 8.1 8.1 12.7 5.5 39.8 13.4 46.8
Notes on table 1: Sample consists of working age respondents, excluding full-time students, apart from the employment rate reported in the second column. E.R.(N.S.) is the employment rate excluding full-time students from the numerator and denominator. Recent migrants refers to individuals arriving post-2004 and their characteristics relate to 2004-7. Professionals and Managerial workers are defined as having a high ranking occupation, clerical and craft workers a medium ranking occupation and all other groups a low ranking occupation. Hourly earnings have been deflated on a monthly basis using the Retail Price Index excluding Mortgage Interest Payments but including other housing costs.
Precise details on the extent of recent A8 migration to the UK are not readily available, although it is possible to piece together the main trends and patterns by examining the relevant sources that do exist. For example, data from the issuing of new National Insurance Numbers (NINos) to Overseas Nationals and from the WRS database should give relatively accurate indications of flows of new A8 migrants.6 There are no real data available on stocks of recent migrants but some idea of the increase in the A8 is available from the LFS. Pollard et al. (2008) estimate that the number of migrants from accession countries working in the UK had increased from 56,000 in the first quarter of 2004 to 474,000 by the end of 2007. However, the LFS is likely to underestimate the number of A8 migrants both because of under-sampling and the under-weighting of recent migrants. The issue of short term migration is particularly important in the context of recent migration. For example, almost two-thirds of workers registering on the WRS in 2007 stated that they intended to stay in the UK for less than a year and less than 10% indicated that they would stay less than 2 years, whilst almost a quarter were unsure how long they would stay. This is consistent with the information in Kepinska (2006), who reports that 77% of Polish migrants to the UK in 2005 had moved on a short-term basis, defined as staying in the UK between 2 and 11 months.
Figure 1 uses NINo data to show the general increase in migration flows to the UK in this decade and the extent of A8 migration since 2004. It reports migrant flows by year of registration (not by year of entry, for which a more limited series also exists). The figure reports a fairly steady increase in migration from non-A8 countries from 2002 to 2007, whereas there was a massive increase in flows from A8 countries after the 2004 enlargement. A fairly large increase can also be observed for 2003 i.e. pre-enlargement, which may have been due to A8 migrants entering as self-employed which they were able to do at the time or possibly early entrants into the paid-employment sector. In particular, the figures for 2007 indicate that around 335,000 A8 nationals registering for a NINo, which represented a rise of 21% over the previous year. Figure 2 provides further details on A8 migration by reporting A8 inflows on a quarterly basis by age group using the WRS. The numbers entering are similar to those reported in the NINo data but somewhat lower because of non-registration by the self-employed and by workers who should have registered. As can be seen, A8 migration generally rose up to the end of 2006 but fell back in 2007. Several reasons have been suggested to account for the slowdown, particularly the more buoyant Polish labour market - where around two-thirds have come from, the movement to other EU countries that have loosened their restrictions and the less favourable zloty-sterling exchange rate (Pollard et al., 2008). These factors plus the declining youth populations in A8 countries are expected cause further reductions in the flows in future periods. Figure 2 also shows that migration has mainly been concentrated amongst the 18-24 and 25-34 age groups and a seasonal pattern can be detected, particularly amongst the younger migrants.
Table A2 provides some basic demographic information on A8 migrants and for other recent migrants by reporting their age, location patterns and education. These statistics are again obtained from the LFS and relate to migrants who have arrived after 2004 and so concern individuals who were interviewed between 2004 and 2007. The table highlights the young age distribution of A8 migrants, even compared to other recent migrants. However, the percentage in the 25-34 age category is higher than in the WRS, which may be because of more short term/seasonal migration amongst the younger migrants or because they are more difficult to identify in the LFS sampling frame. It is also notable that the location patterns of recent A8 migrants have been relatively dispersed so that their regional distribution is not dissimilar to White natives. In contrast, over a third of other recent migrants are found in London, which has traditionally been a magnet for immigrants to the UK. Nevertheless, in common with other recent
6 The self-employed do not need to register on the WRS, plus a relatively high proportion of A8 migrants working in
the UK have not registered. For example in a survey of Polish return migrants who had worked in the UK since 2004, Pollard (2008) found that 42% had not registered on the WRS.
migrants, A8 migrants possess relatively high levels of education, with only just over 12% leaving full-time education before the age of 17 and a third after the age of 21.
Figure 1: National Insurance Number Allocations to Overseas Nationals by Year of Registration, 2002 – 2007 0 50 100 150 200 250 300 350 400 450 500 2002 2003 2004 2005 2006 2007 R egi st ra ti ons in 0 00s A8 Non-A8
Source: Department of Work and Pensions
Figure 2: Approved Applications for A8 Nationals to Work in the UK by Age Group, 2004 Q2 – 2007 Q4 0 10000 20000 30000 40000 2004 Q2 2004 Q4 2005 Q2 2005 Q4 2006 Q2 2006 Q4 2007 Q2 2007 Q4
Under 24 25-34 35-44 45 and over
Table 1 reports information on the labour market outcomes for the two groups of recent migrants. One of the most noticeable features is the very high employment rates of A8 migrants.7 In comparison, employment rates are much lower for recent migrants from other parts of the world due to the more diverse range of activities (including looking after the home) undertaken by this group. There are also large differences in terms of earnings since these are generally very low for A8 migrants - with even lower average wages than was observed for the Bangladeshis in the pre-enlargement period -whereas the earnings distribution of other recent migrants is similar to that seen for nonwhites in the earlier period. Moreover, the distribution of earnings of A8 workers is clustered just above the national minimum wage. Further evidence on the concentration of A8 workers in the low wage jobs comes from the very low proportion of workers with high ranking occupations. Possible explanations for the discrepancy between education and occupational attainment/earnings of A8 migrants include that many have weak English language skills and many have come to the UK on a short term basis (Drinkwater et al., 2009).
There have already been a couple of studies that have attempted to assess to which A8 migration has affected the UK labour market. Gilpin et al. (2006) conducted a detailed examination of unemployment at the local authority level in the immediate aftermath of EU enlargement because of the suggestion that A8 migration had partly caused the increase in the claimant count seen in 2005. They were unable to find any evidence that A8 migration had made a significant contribution to the rising claimant count figures and concluded that the economic impact of A8 migration on the UK had been minimal, but broadly positive. They argue that this was due to the flexibility and speed of adjustment of the UK labour market but they did not examine the impact on the unemployment of subgroups of the UK population.
Blanchflower et al. (2007) also suggest that these migration flows did not have a large labour market effect but note that youth unemployment has risen. Figure 3 confirms this and provides an updated picture of unemployment rates by age group, which are reported on a monthly basis from the beginning of 2000 up to the end of 2007. In particular, the figure shows that unemployment rates for the 16-17 and 18-24 age groups have increased since 2004, whereas the rates for 25-49 and over 50 year olds have remained more or less constant.8However, in assessing the link between youth unemployment and the rise in immigration, Blanchflower et al. (2007) do find not that all of the regions that experienced the biggest rises in immigration witnessed the largest increases in youth unemployment, although they do report a weak (insignificant) positive relationship between these variables. They interpret this as indicating that the influx of new migrants had little influence on the increase in unemployment rates of 18-24 year olds. Furthermore, Lemos and Portes (2008) find no evidence of this in their econometric study.
The increasing incidence of youth unemployment since 2004 can also be seen from claimant count statistics (Lemos and Portes, 2008). Unfortunately, claimant count statistics have only been published by ethnicity since April 2005. Figure 4 reports the percentage of claimants accounted for by individuals from ethnic minority groups from this date.9 No clear trends can be identified in the data, with the proportion of claimants from the ethnic minorities having remained more or less constant since April 2005. This is even true for the 18-24 age category, despite the rise in the nonwhite share of the youth population. It also remains very low amongst under 18 year olds,
7 A8 migrants can only claim benefits if they have been in the UK for more than a year.
8 These are the ‘official’ age related unemployment rates calculated by the ONS using the International Labour
Organisation definition and are based on information from the LFS. Claimant count unemployment rates are also available for age groups but these relate to only benefit claimants rather than those currently out of work who are seeking employment or waiting to take up a job.
9 Those claimants who refused to state their ethnic group or for those for whom it was unknown have been excluded
which reflects the high participation rates of ethnic minorities in post-compulsory education. However, the percentage of claimants aged 50 and over from the ethnic minorities has shown some increase since April 2005.
Figure 3: Seasonally Adjusted Unemployment Rates by Age Group, January 2000 – December 2007 0 5 10 15 20 25 30 35 16-17 18-24 25-49 Source: ONS
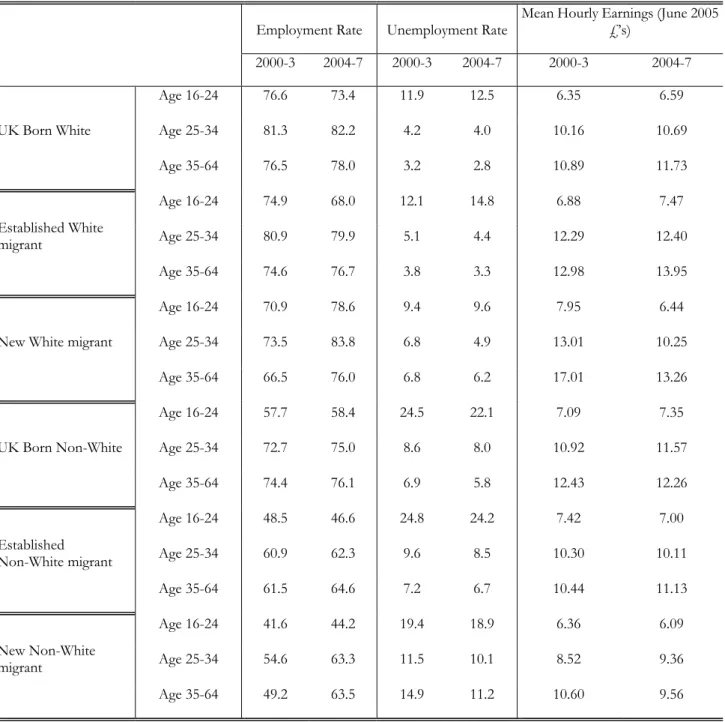
By way of providing further background information Table 2 reports differences in employment and unemployment rates and average earnings for whites and nonwhites. Each of these groups have been split into natives, established migrants (been in UK for 5 or more years) and new migrants (been in the UK for less than 5 years) and the statistics are reported for three different age groups. The table indicates that labour market outcomes have generally improved across the two periods, with employment rates and real earnings rising and unemployment rates declining for nearly all age categories within the different ethnic-migrant classifications. However, there are some exceptions, with employment and unemployment rates having fallen and risen respectively for young white natives and established migrants. Thus it implies that the increase in unemployment rates for Whites mainly explains the rise seen at the aggregate level in Figure 3. Employment rates and real earnings have also fallen for established young nonwhite migrants, whilst earnings have also fallen slightly for nonwhite natives aged 35-59/64 and established nonwhite natives aged 25-34. The influence of A8 migration since 2004 can not only be seen in the fairly large reduction in wages of new white migrants but also on new nonwhite migrants, across all age categories apart from 25-34 year old new nonwhite migrants.
Figure 4: Nonwhite Unemployment as a Percentage of the Claimant Count, April 2005 – December 2007 0 5 10 15 20 25
apr.05 aug.05 des.05 apr.06 aug.06 des.06 apr.07 aug.07 des.07
N onw hites as a % of Claim ant Count
Total Under 18 18-24 25-49 50 and over Source: ONS
4. Methodology and Data
To investigate the impact of recent migration on the labour market outcomes of ethnic minorities in the UK we estimate regression models which have the general form:
Yist = βRst + γXist + εist (1)
where Yist is the average level of some labour market outcome for group i in “cell” s of the labour market at time t. Rst is the independent variable of interest and measures the proportion of recent immigrants in cell s at time t. The vector X contains a set of controls, which may include fixed effects or the average values of variables thought to affect the average labour market outcome in each cell, while ε is an error term. Variants of this model have been estimated by various authors to investigate the impact of immigration on the economy. Data on the variables Y, R and X are typically obtained through a process of “collapsing” multiple years of cross-sectional data sets by taking averages over cells and time.
The definition of the appropriate cell is a methodological choice of the researcher and varies by study. For example, Altonji and Card (1989) for the US and Dustmann et al. (2005, 2007) for the UK use geographical areas. The idea is that the labour supply shock caused by increased immigration is captured by the increasing immigrant share of the labour force in a particular area. The estimated sign of β reflects whether this supply shock has a positive or negative effect on other (typically native) workers, controlling for other variables.
Table 2: Labour Market Outcomes of Broad Ethnic Groups in the UK by Age Group: 2000-3 and 2004-7
Employment Rate Unemployment Rate Mean Hourly Earnings (June 2005 £’s)
2000-3 2004-7 2000-3 2004-7 2000-3 2004-7 UK Born White Age 16-24 76.6 73.4 11.9 12.5 6.35 6.59 Age 25-34 81.3 82.2 4.2 4.0 10.16 10.69 Age 35-64 76.5 78.0 3.2 2.8 10.89 11.73 Established White migrant Age 16-24 74.9 68.0 12.1 14.8 6.88 7.47 Age 25-34 80.9 79.9 5.1 4.4 12.29 12.40 Age 35-64 74.6 76.7 3.8 3.3 12.98 13.95
New White migrant
Age 16-24 70.9 78.6 9.4 9.6 7.95 6.44 Age 25-34 73.5 83.8 6.8 4.9 13.01 10.25 Age 35-64 66.5 76.0 6.8 6.2 17.01 13.26 UK Born Non-White Age 16-24 57.7 58.4 24.5 22.1 7.09 7.35 Age 25-34 72.7 75.0 8.6 8.0 10.92 11.57 Age 35-64 74.4 76.1 6.9 5.8 12.43 12.26 Established Non-White migrant Age 16-24 48.5 46.6 24.8 24.2 7.42 7.00 Age 25-34 60.9 62.3 9.6 8.5 10.30 10.11 Age 35-64 61.5 64.6 7.2 6.7 10.44 11.13 New Non-White migrant Age 16-24 41.6 44.2 19.4 18.9 6.36 6.09 Age 25-34 54.6 63.3 11.5 10.1 8.52 9.36 Age 35-64 49.2 63.5 14.9 11.2 10.60 9.56
Notes: Sample consists of working age respondents, excluding full-time students. New migrant indicates a migrant who arrived in the UK less than 5 years before they were interviewed.
The “area studies” approach, however, has been criticised by Borjas (2003) who argues that it neglects the impact of immigration on the location choices of native workers. Essentially, if increased immigration flows cause natives to move out of particular locales or to lower their propensity to move into areas where immigrants cluster, the impact of immigration on the labour market outcomes of natives will be underestimated. Borjas proposes instead to use “skill” cells as opposed to geographical areas, where skill cells are defined both by levels of education and years of potential labour market experience. Workers within a particular skill category are thought to compete in a national labour market and the supply shock induced by immigration is manifested as an increase in the proportion of immigrants in a particular education-experience cell.
investigate the impact of recent waves of immigration on the labour market outcomes of two main groups. The first group, which we will label “ethnic minorities” consists of both native born members of the UK’s non-white ethnic minority groups as well as ethnic minority individuals who were born abroad but have been in the UK for five years or more, what we call “established migrants”. The second group, labelled “white natives” is all those native-born individuals of white ethnic origin.9 To provide a baseline we estimate equation (1) using skill cells since, in addition to the criticisms levelled by Borjas (2003) at studies based on spatial correlations, there are other reasons why this approach may not be well suited to analysing the impact of recent migration to the UK. In particular, the recent migration wave has been much more geographically dispersed than previous migration cohorts (Bauere et al., 2007; Pollard et al., 2008). This, combined with the fact that UK regions are extremely large geographical entities, implies that identifying the extent of the immigrant supply shock using such an approach is potentially problematical.
However, the skill cell approach is also likely to be adversely affected by a problem caused by the nature of the recent migration to the UK, particularly after EU enlargement in 2004. This relates to the mismatch between the educational levels of migrants and the jobs they do in the UK labour market. In particular, A8 migration has mainly been into unskilled occupations, in spite of the fact that according to Table 2, A8 migrants had the lowest proportion of all groups in the low education category, in terms of years of completed education. As suggested previously, poor English language skills and different migration strategies are likely to play some role in this pattern of occupational choice, which suggests that using skill cells to investigate the impact of recent migration may misrepresent where in the labour market the immigrant supply shock has been felt.
To deal with these issues we also estimate a version of equation (1) in which the labour market cells are based on occupational classifications. Here, competition between immigrant and native workers is thought to occur within occupations. This seems intuitively plausible: many workers do search for particular types of occupation, rather than simply looking for any opportunity which fits their level of skill. It is within occupations that the immigrant labour supply shock may really “bite”. However, in order to allow for the fact that workers with more or less experience within occupations are not perfect substitutes we use a combination of potential experience and occupation to define the cells within which we measure the dependent variable as well as the immigrant supply shock. Note that, unlike the skill-cell approach, using which it is possible to analyse the full range of labour market outcomes, we can only investigate the impact of recent immigration on earnings using occupation-experience cells as occupation is conditional on employment. Other studies which use an occupation based approach to examine the labour market impact of immigration include Card (2001) and Orrenius and Zavodny (2007). 10 A potential drawback of such an approach is that endogeneity can be more of an issue compared to the skill-cell approach. Individuals have more choice over their occupation than over their age (or amount of potential experience) and, at least for older workers, their level of formal education which is largely pre-determined.
Our data are drawn from the LFS which collects information on a wide range of socioeconomic characteristics including country of birth and year of arrival in the UK. This enables us to analyse the composition of recent migration flows. Earnings information is collected in the first and fifth waves while information on other labour market outcomes is collected in all five waves. Using the skill cells approach we examine employment rates, participation rates, unemployment rates and log hourly wages, but only the latter outcome when using occupation-experience cells. Unlike the earlier descriptive analysis which used data from only wave 1, we retain data from all five waves. The justification for this is that estimation of equation (1) depends on reliable estimation of the mean outcomes and explanatory variables in each cell. This
10
Both of these studies analyse occupation across geographical areas in the US rather than across experience groups.
is particularly important given that ethnic minorities are a relatively small proportion of the total UK population. It should also be noted that, despite the large increases in immigration seen in the UK over the past few years, the share of each cell accounted for by recent immigrants typically remains very small.
5. Results
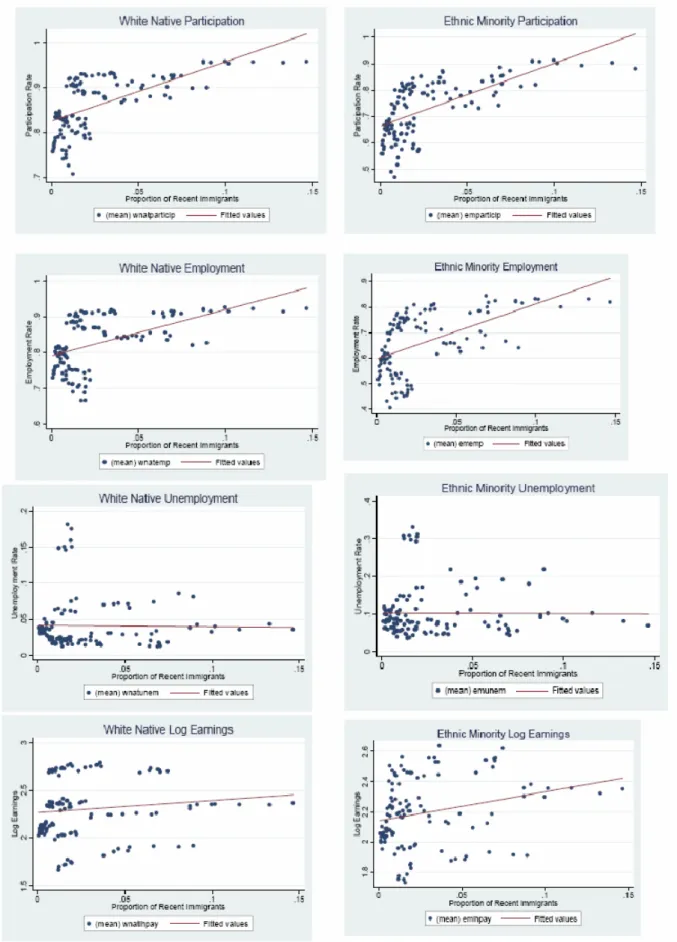
Figure A1 plots the data obtained when we break the labour market down into cells defined by skills. There are three educational categories: those who left school at the age of 16 or younger, those who left between 17 and 20 inclusive and those who left aged 21 or over. These are combined with 5 equally spaced experience categories up to 40 years of potential labour market experience. There are also eight calendar years giving 120 observations in total. In each panel, the horizontal axis shows the proportion of workers in each cell who are recent immigrants, that is those who have been in the UK for less than 5 years, while the vertical axis indicates the level of the appropriate labour market outcome. Graphs are plotted separately for ethnic minorities (native born and established migrant nonwhites) and white natives. Two points are worth making at this stage. First, recent migrants are concentrated in relatively few skill cells with most cells containing relatively few recent migrants. This confirms the findings of Table 3 which showed that new migrants were likely to be non-representative of the workforce as a whole. Second, there is, in these raw data, no negative relationship between mean outcomes and the proportion of recent migrants in the labour force. In fact the fitted least squares regression lines, which are overlaid on the scatter plot, suggest that skill cells in which there are more recent migrants have, on average, better outcomes. Of course these raw figures do not control for other variables which might be correlated both with outcomes and the immigrant supply shock. For example, labour market outcomes such as employment and real earnings have shown a secular increase over the period and time is clearly positively related to flows of recent migrants. Hence it is to the regression analysis that we now turn.
Table 3 contains the results. In each case the dependent variable is the mean of the relevant labour market outcome in each skill cell. Fixed effects are included for education category, experience category and year. An interaction between education and experience category is also included however, in contrast to Borjas (2003), we do not include interactions between education and time or experience and time. This is because our data span a much shorter period (8 years rather than 40 years) and it seems more plausible to assert that returns are constant over this length of time.11 The independent variable of interest is the proportion of recent migrants in each cell and, rather than report raw estimates of the coefficient on this variable, β, which are somewhat difficult to interpret, the table reports the predicted impact of a increase in the proportion of recent immigrants equal to that which actually occurred in the UK between 2000 and 2007. This involved a doubling of the proportion of recent migrants in the labour force from 1.5% to 3.0% thus the β
estimates have been multiplied by 0.015. This is an upper bound on the increase in the proportion of recent migrants given that these years appear at the either end of the time period and thus represent the extreme values. Clearly taking an average of differences before and after 2004 would lower the predicted changes.
The table suggests that most of the estimated effects are small and negative. Indeed many are insignificantly different from zero at standard levels of significance. For the discrete labour market outcomes, there is some evidence that employment and unemployment rates for white native males and females were adversely affected by the increase in immigration however these are only on the borderline of statistical significance and are small in quantitative terms. For example,
11 We did in fact experiment with interacting year with education and experience, however this used up too many
the recent immigrant supply shock is estimated to have reduced the employment rate of white native females by around eight tenths of one percentage point. There are slightly larger, statistically significant effects on the wages of white natives where recent immigration is estimated to have reduced wages by around 1.5%. Interestingly ethnic minority females exhibited the largest negative wage effect of around 2.1% which is also statistically significant. In terms of the contrast between white and ethnic minority workers, the effect of the immigrant supply shock seems to depend on gender with ethnic minority females faring worse than white native females but white native males doing worse than non-white males.
Table 3: PredictedChanges in Labour Market Outcomes using Skill-Cell Approach
Participation Employment Unemployment Log Wages White Natives All -0.004 -0.006 0.002 -0.015 (1.31) (1.55) (1.24) (2.61) Males -0.004 -0.006 0.003 -0.017 (1.47) (1.61) (1.56) (2.28) Females -0.006 -0.008 0.002 -0.017 (1.69) (1.93) (1.77) (3.58) Ethnic Minorities All -0.007 -0.007 0.001 -0.008 (1.01) (1.16) (0.23) (1.07) Males 0.001 -0.002 0.003 0.000 (0.22) (0.39) (0.54) (0.04) Females -0.011 -0.011 -0.001 -0.021 (1.06) (1.24) (0.20) (2.99)
Notes: In all regression models the dependent variable is the mean value of the labour market outcome for the specified group in a skill cell in a given year. The reported estimate is the impact of a 1.5 point increase in the percentage of recent migrants. For the discrete outcomes this can be interpreted as the percentage point change in the relevant outcome. For the log earnings variables this can be interpreted as approximately the percentage change in earnings. There are 120 skill cells which are derived from 5 experience categories, 3 education categories and 8 years. Controls were also included for year, fixed effects for educational category, experience category and interactions between experience and education categories. The t-statistics in parentheses use standard errors produced by weighting the regression by the number of observations on the dependent variable in each cell and clustering by skill group.
As noted in the previous section, however, it is possible to argue that the skill-cell approach does not capture a major feature of the recent immigration to the UK, particularly that of workers from A8 countries. This relates to the fact that many such workers work in jobs which for which they are ostensibly overqualified. It is therefore possible that the true immigrant supply shock is not felt in skill cells but elsewhere in the labour market. This motivated us to investigate the impact of increasing migration within occupation-experience cells and Figure A2 plots the results of this exercise for white native and ethnic minority workers. There are ninety points on each figure reflecting the interaction of 5 experience categories, 9 one-digit occupations and two time periods reflecting the periods before and after EU enlargement in 2004.
The figure suggests not only that recent migrants are concentrated in relatively few sectors and that, overall, there was a negative relationship between the proportion of recent migrants and
log wages. This holds for both white natives and ethnic minorities with the slope of the fitted regression line somewhat steeper for white natives. Table 4 presents the corresponding regression results and the models control for average levels of education and experience in each cell as well as fixed effects for occupation and period (pre or post 2004). Again the estimated coefficients have been rescaled to reflect the impact of an increase in the proportion of recent migrants in the labour market of 1.5 percentage points. Recall also that we can only analyse earnings using occupation based cells as occupation is conditional on employment.
Table 4: Predicted Changes in Log Wages using Occupation-Experience Cell Approach
White Natives All -0.025 (2.58) Males -0.023 (2.08) Females -0.031 (2.69) Ethnic Minorities All -0.019 (1.65) Males -0.017 (1.78) Females -0.020 (1.44) Comined Groups Black -0.030 (3.11) Indian/Chinese -0.030 (1.91) Pakistani/Bangladeshi -0.004 (0.45) Mixed/Other -0.018 (1.50)
Notes: The dependent variable is the mean value of log real gross hourly earnings for the specified group in an occupation-experience cell in a given year. The reported estimate is the impact of a 1.5 percentage point increase in the proportion of recent migrants and this can be interpreted as approximately the percentage change in earnings. There are 90 cells which are derived from 5 experience categories, 9 occupation categories and 2 time categories reflecting the period before and after 2004. Controls were also included for year, occupational group and the mean level of education and experience in each cell. The t-statistics in parentheses use standard errors produced by weighting the regression by the number of observations on the dependent variable in each cell and clustering by skill group.
The results broadly confirm the situation displayed in Figure A2 by indicating a negative relationship between log pay and the proportion of recent migrants for both white natives and ethnic minorities. This relationship is stronger (more negative) for white natives and there is a higher level of statistical significance for this group, with a t-statistic of 2.58. The increase in immigration over the period in question is estimated to have reduced white native earnings by around 2.5%. The effect for ethnic minority workers is smaller at 1.9% and only borderline significant, with a t-statistic of 1.65. Again there are some gender differences but this time white
native females have the largest negative coefficient, suggesting a 3.1% reduction in real wages due to immigration as compared with a 2.0% effect for their non-white counterparts. One caveat to these results, as previously discussed, is the potential effect of endogenous occupational choice. However, it is worth noting at this juncture that both Card (2001) and Orrenius and Zavodny (2007) use instrumental variable techniques to control for this and find more negative effects of the immigrant supply shock on occupation-level labour market outcomes. Our results may therefore underestimate the adverse effect on native outcomes.
To dig a little deeper into the effect on ethnic minorities we have disaggregated nonwhites into sub-groups since previous research has shown that there are big differences between minority groups. Again sample size restrictions constrain the choice of groups, but Table 4 suggests that the negative impact of recent migration on wages has been greatest for the combined Indian/Chinese group, who have generally been relatively successful in the UK labour market, and for Blacks. The magnitude of the effect on these groups is similar to that seen for whites. Furthermore, the impact on Blacks is significant at better than the 1% level and that on the Indian/Mixed group at around the 5% level. In contrast, the impact has been smallest on the Pakistanis and Bangladeshis, who have traditionally been seen as the most disadvantaged groups. For this group, the impact was essentially zero, whilst the effect observed for the Mixed/Other group was smaller than for white natives and also insignificant at the 10% level. These findings could possibly be explained by the fact that Pakistanis and Bangladeshis were starting from a much lower position in terms of labour market outcomes, and thus reflects a continuation of the greater success achieved by these groups, especially by males, since the early 1990s (Clark and Drinkwater, 2007). It might also be the case that policy initiatives targeted at ethnic minority groups have helped to mitigate some of the possible negative effects of increased migration flows.12
6. Conclusion
Our findings suggest that the labour market impact of the historically large recent migration flows to the UK has been relatively small. The impact is larger when occupation-experience cells are used, which is likely to reflect the nature of recent migration patterns, where seemingly highly skilled migrants have mainly entered low paid sectors. Potential explanations for the small effect include that the estimates relate to a short time period, the fact that the UK economy had generally been performing well and that, despite the larger numbers involved, recent migrants still account for a small proportion of the total workforce and contain a relatively high proportion of short-term stayers. Some ethnic differences were also identified, with whites generally affected slightly more than ethnic minorities as a whole, and Pakistanis and Bangladeshis the least affected group.
It should also be noted that our results are preliminary and further analysis needs to be undertaken. In particular, the precision of our estimates is likely to be affected by small cell sizes with respect to recent migrants and some of the minority groupings. It would also be desirable to establish the robustness of the econometric results to concerns of unobserved heterogeneity and endogeneity. However, additional econometric analysis using instrumental variables or first differences may not be straightforward. For example, the relatively short time period involved may imply that differencing is not much of an improvement on estimation in levels. Furthermore, typical instruments for immigrant concentration involve the use of historical immigration patterns. The validity of this may be questioned in a situation where a significant regime change of the type experienced in the UK since 2004 has fundamentally altered the nature of immigration patterns.
These concerns aside, our results suggest that contrary to some expectations, it is not the case that the large recent migration wave has widened the gaps in the labour market between white
12 See http://www.emetaskforce.gov.uk/ for details of the work of the Ethnic Minority Employment Task Force,
and non-white workers. This has been the view of some popular reporting of the situation and might have been expected given the types of occupations in which both immigrants and established ethnic minority workers are found. The production function estimates of Manacorda et al. (2006) also tend to suggest that established immigrants are more likely to suffer than white natives. However, it appears that white natives have been affected to at least the same extent by recent immigration. Policies targeted at nonwhite individuals may have helped to bring about this result.
References
Altonji, J. and Card, D. (1989), “The effects of immigration on the labor market outcomes of natives”, NBER Working Paper No. 3123.
Blackaby, D. H., Leslie, D. G., Murphy, P. D. and O’Leary, N. C. (2002), “White/Ethnic Minority and Employment Differentials in Britain: Evidence from the LFS”, Oxford Economic Papers, 54, 270-97.
Blanchflower, D., Saleheen, J. and Shadforth, C. (2007), “The impact of recent migration from Eastern Europe on the UK economy”, IZA Discussion Paper No. 2615.
Borjas, G. (1987), “Immigrants, minorities and labor market competition”, Industrial and Labor
Relations Review, 40, 382-92.
Borjas, G. (2003), “The labor demand curve is downward sloping: Reexamining the impact of immigration on the labor market”, Quarterly Journal of Economics, 118, 1335-74.
Borjas, G. Grogger, J. and Hanson, G. (2006), “Immigration and African-American employment opportunities: The response of wages, employment, and incarceration to labor supply shocks”, NBER Working Paper No. 12518.
Card, D. (1990), “The impact of the Mariel boatlift on the Miami labor market”, Industrial and Labor
Relations Review, 43, 345-57.
Card, D. (2001), “Immigrant inflows, native outflows and the local labor market impacts of higher immigration”, Journal of Labor Economics, 19, 22-63.
Clark, K. and Drinkwater, S. (2007), Dynamics and Diversity: Ethnic Minorities in the UK Labour Market, Bristol, Policy Press.
Drinkwater, S., Eade, J. and Garapich, M. (2009), “Poles Apart? EU Enlargement and the Labour Market Outcomes of Immigrants in the UK”, International Migration, 47, 161-190.
Dustmann, C. and Fabbri, F. (2005), “Immigrants in the British Labour Market”, Fiscal Studies, 26, 423-70.
Dustmann, C., Fabbri, F. and Preston, I. (2005), “The impact of immigration on the British labour market”, Economic Journal, 115, F324-F341.
Dustmann, C., Frattini, T. and Preston, I. (2007), A Study of Migrant Workers and the National Minimum
Wage and Enforcement Issues that Arise, Report to the Low Pay Commission.
Gilpin, N., Henty, M., Lemos, S., Portes, J. and Bullen, C. (2006), “The impact of free movement of workers from Central and Eastern Europe on the UK labour market”, Department of Work and Pensions Working Paper No. 29.
House of Lords Select Committee on Economic Affairs (2008), The Economic Impact of Immigration, London, The Stationary Office.
Poland”, Working Paper No. 15/73, Centre of Migration Research, Warsaw University.
Leslie, D. and Drinkwater, S. (1999), “Staying on in full-time education: Reasons for higher participation rates among ethnic minority males and females”, Economica, 66, 63
77.
Lemos, S. and Portes, J. (2008), The Impact of Migration from the New European Union Member States on Native Workers, Department of Work and Pensions, Research Report.
Manacorda, M., Manning, A. and Wadsworth, J. (2006), “The impact of immigration on the structure of male wages: Theory and evidence from Britain”, CEP Discussion Paper No. 754, London School of Economics.
Orrenius, P. M. and Zavodny, M. (2006), “Does immigration affect wages? A look at occupational-level evidence”, Labour Economics, 14, 757-73.
Pollard, N., Latorre, M. and Sriskandarajah, D. (2008), Floodgates or Turnstiles? Post-EU Enlargement
Migration Flows to (and from) the UK, London, Institute for Public Policy Research.
Salt, J. and Millar, J. (2006), “Foreign labour in the United Kingdom: Current patterns and trends”,
Labour Market Trends, October, 335-53.
Smithard, T. (2008), “Eastern Europeans ‘targeted’ by angry Asians”, Yorkshire Post, 8th January. Winegarden, C. R. and Khor, L. B. (1991), “Undocumented immigration and unemployment of U.S. youth and minority workers: Econometric evidence”, Review of Economics Statistics, 73, 105-12.
Table A1: Age Related Population Estimates for Ethnic Groups in England, 2001-2005
Age distribution in 2005 (%) Total Population Growth Rates by Age Group: 2001-05
<15 15- 24 25- 34 35- 44 45- 54 >54 (000s) Pop. <15 15- 24 25- 34 35- 44 45- 54 >54 Total White: British & Irish 17.3 12.3 12.1 15.2 13.1 30.1 43344.4 -4.4 6.0 -11.9 1.5 -4.2 5.7 -0.5 White: Other 12.4 14.6 26.2 18.9 11.0 17.0 1623.3 17.2 19.5 20.4 35.7 15.9 14.8 20.9 Mixed 43.5 21.0 13.7 11.1 5.2 5.4 791.3 11.7 35.3 18.1 33.1 40.2 19.3 20.9 Indian 17.9 17.6 20.3 16.3 13.2 14.7 1215.4 -0.4 18.0 25.3 17.5 19.0 22.8 16.2 Pakistani 29.9 20.0 19.8 12.8 8.8 8.7 825.5 5.6 8.0 20.4 31.3 30.6 16.5 14.6 Bangladeshi 31.9 20.9 21.0 11.9 6.9 7.3 324.2 3.1 10.8 23.4 39.2 41.5 11.7 15.1 Black Caribbean 17.0 13.6 12.8 23.1 13.3 20.2 590.2 -6.0 15.5 -20.3 5.1 45.7 3.3 3.6 Black African 24.3 18.2 21.2 20.7 9.3 6.3 658.8 16.5 51.5 22.4 45.0 64.2 43.3 34.2 Chinese 12.3 23.8 26.8 15.7 11.4 10.0 340.7 16.3 49.2 115.2 42.6 34.0 44.4 52.9 Other 19.1 18.1 22.8 18.6 11.2 10.0 745.6 13.4 42.6 37.6 36.8 29.9 41.7 32.4 Nonwhite 24.7 18.8 19.4 16.3 10.2 10.7 5490.0 7.2 26.2 24.5 26.9 33.0 21.0 20.8
Table A2: Key Demographic Characteristics of Ethnic Groups in the UK (2000-2003) and for Recent Migrants (2004-7)
Immigration (%) Age (%) Region (%) Education (%)
UK
born Arr. <90 Arr. >89 16- 24 25- 34 35- 64 Lon. S. Eng Mids N. Eng Celtic Low Med. High
White 95.2 3.1 1.8 10.9 21.9 67.2 8.4 32.7 16.0 26.9 16.1 61.7 24.0 14.3 Mixed 72.5 14.8 12.7 23.2 32.9 43.9 36.0 25.3 12.8 18.3 7.6 47.9 32.7 19.4 Indian 26.6 57.5 15.8 9.9 28.6 61.5 39.9 15.5 29.0 13.8 1.8 33.2 33.4 33.4 Pakistani 30.4 48.2 21.3 19.8 32.4 47.8 16.8 13.9 22.4 41.0 5.9 50.7 31.1 18.3 Bangladeshi 11.4 58.7 30.0 21.7 38.0 40.3 54.7 12.5 10.7 19.3 2.9 58.9 28.5 12.6 Black Caribbean 56.1 35.5 8.5 10.2 22.4 67.5 55.3 14.5 18.5 11.2 0.5 53.4 37.0 9.6 Black African 16.1 31.5 52.4 9.8 36.1 54.1 71.6 12.2 5.5 8.1 2.6 23.1 37.6 39.4 Chinese 20.2 51.8 28.0 8.1 25.3 66.6 32.5 27.3 8.9 19.5 11.8 28.7 32.9 38.4 Other 15.8 35.7 48.5 10.0 33.7 56.3 53.5 21.6 8.2 11.5 5.2 26.8 37.0 36.2 Nonwhites 29.7 43.8 26.5 13.1 30.8 56.1 44.0 16.8 17.4 17.9 3.9 38.8 34.2 27.0 Recent A8 migrants _ _ 100 33.4 46.9 19.8 16.4 27.3 19.8 22.2 14.4 12.1 55.2 32.7 Other recent migrants _ _ 100 19.2 50.0 30.7 34.4 28.6 12.3 15.0 9.6 15.5 35.3 49.2
Notes: Sample consists of working age respondents, excluding full-time students. Recent migrants relates to individuals arriving post2004 and their demographic characteristics relate to 2004-7. Low education is defined as those individuals leaving full-time education before the age of 17, medium education for those leaving between the ages of 17 and 20 and high education as those leaving at the age of at least 21.
Figure A2: Log Earnings and Recent Migrants Plot by Occupation-Experience Cells
White Native Log Earnings