Procedia Computer Science 91 ( 2016 ) 245 – 251
1877-0509 © 2016 The Authors. Published by Elsevier B.V. This is an open access article under the CC BY-NC-ND license (http://creativecommons.org/licenses/by-nc-nd/4.0/).
Peer-review under responsibility of the Organizing Committee of ITQM 2016 doi: 10.1016/j.procs.2016.07.069
ScienceDirect
Information Technology and Quantitative Management (ITQM 2016)
Application of outlier mining in insider identification based on
Boxplot method
Aihua Li*, Mengyan Feng, Yanruyu Li, Zhidong Liu
School of Management science and Engineering, Central University of Finance and Economics, Beijing, 100081, China Abstract
With the rapid development of Chinese capital market, securities and futures trading activities have become increasingly active. Insider trading, disclosure of insider information and other illegal and criminal activities are prone to happening. This paper explores the application of Boxplot in outlier mining. Moreover, we put forward the improved scheme based on the Boxplot itself by using R software to add density curve and scatter for the purpose of more intuitive. And the result shows the feasibility of the Boxplot method for outlier
© 2016 The Authors. Published by Elsevier B.V.
Selection and/or peer-review under responsibility of the organizers of ITQM 2016
Keywords: Outlier; Data mining; Boxplot; Insider Trade; Stocks
1.Introduction
With the rapid development of Chinese capital market, securities and futures trading activities have become increasingly active. Insider trading, disclosure of insider information and other illegal and criminal activities are prone to happening. Peng has a more comprehensive definition of insider trading. He thinks insider trading refers to an activity that people who get sensitive information of securities, which is confidential and has a significant impact on the prices of securities, through improper or intimate access, use this information to purchase a large number of the securities and spread this information to recommend others to conduct securities trading in the sensitive period [1]. Insider trading disrupts security market rules, which has great harm. What’s more, the serious one will break the whole balance of the capital market.
Chinese securities market is relatively young, and market discipline mechanism has not been fully formed, which lead to insider trading sometimes. In July 2008,GF Securities chairman Dongwas involved in insider trading case, becoming the first case of insider trading in China. In May 2010, Huang was involved in the
* Corresponding author. Tel.: +86-10-62288622; fax: +86-10-62288622. E-mail address: [email protected].
© 2016 The Authors. Published by Elsevier B.V. This is an open access article under the CC BY-NC-ND license (http://creativecommons.org/licenses/by-nc-nd/4.0/).
Zhongguancun Stock (000931) insider trading case, which is the highest amount of illegal income and fines of insider trading in China. In April 2011, Zhongshan Public Utilities case became the first insider trading case involved with officials. In April 2012, Shenzhen Topway Video Communication insider trading case became the case which has the largest number of involved people in China, up to 15.
A lot of researchers are looking for ways to identify insider trading behavior. Nowadays, data mining has been widely used in various industries, including the securities industry. Because data mining has been the forefront in the financial field, detecting outliers in the stock market is still in the exploratory stage. The data of insider trading does not belong to the scope of normal transaction data, so the detection of insider trading belongs to the outlier mining category, which is the focus of this paper.
2.Research Status of Outlier Mining
Barnett has made a definition of anomaly points: an anomaly point is the point that the data concentration is obviously different from others. The different measurement methods lead to the different results of the abnormal point [2]. Sometimes people are interested in outliers, because it contains some important information. Simply culling will make us lose some significant information.
Outlier mining has already been applied in the stock market. The data is basically time series, so there are many scholars focusing on outlier mining algorithm from the perspective of time series. WTMM method proposed by Struzik and Siebe is a wavelet method. It pointed out that the method was feasible in detecting the financial market of outliers in time series, but it did not mention whether it could be used in the high-frequency data stream [3]. Ane and Rangau proposed an AR-GARCH model to detect abnormal returns of Asia-Pacific stock markets [4]. Zhao proposed a method to detect the outlier of stock time series based on density and proved to be feasible and effective on SSE Composite Index [5]. Cao et.al demonstrated applicability the VSOutlier system for supporting detection of outliers in big data stream, and the system performed well when it helped analysts to identify and respond in the high volume streams of stocks [6].
Chinese scholars have also been studying the anomaly detection of the stock market. Sun et.al proposed an outlier pattern mining considered as an optimization segmentation problem by using fractal theory, from the view point of outlier affecting orderliness of data set of time series [7]. Du and Zhang presented a detection algorithm for outlier subsequence based on Local Linear Mapping (LLM) to improve the effectiveness of outlier subsequence detection algorithm for time series [8]. Du et.al proposed an algorithm for the prediction of stock data to find the abnormal data, with the introduction of Gaussian process machine learning method. And they used colony algorithm to solve the adaptive mechanism for the parameters of Gaussian process [9].
And there are also some applications of boxplot in anomaly detection. Sim et al. introduced outlier labeling with boxplot procedures, improving the feasibility of the method [10]. Dovoedo and Chakraborti studied boxplot-based outlier detection for the location-scale family and do a simulation study on the performance of the outlier detection rules [11]. However there are nearly no studies about the application of boxplot on insider trading detection.
3.Outlier Mining Based on Boxplot
3.1.The Introduction of Boxplot
Boxplots are among the most widely used exploratory data analysis (EDA) tools in statistical practice. It’s a visualization method of the degree of dispersion of the data, which is invented by the American mathematician John W. Turkey in 1969. Boxplot can intuitively reflect outliers. Boxplot outlier judgment scope is outside of
3 1.5
Q IQRand 1 1.5Q IQR. This kind of determination method seems to be random, but in fact it is a method derived from a great deal of experience, proved to be effective and valid. Usually, the empirical method of the
identification of the abnormity is 3V, which is under the condition that the data distribution should obey the normal distribution law. But in real life, most of the data do not follow the normal distribution, on the contrary, always arbitrary. The mean and standard deviation of the normal distribution may also be excessively influenced by the abnormal point, which result in the distortion of the original state of the data. So this method is invalid when it solves with the non-normal distribution data. Boxplot methods choose Quartiles and Interquartile Range as the basis of judgment, which will not be affected by outliers. So it has an advantage in outlier detection and judgment. Besides Boxplot does not require distribution assumption and data processing in advance, so it can better maintain the original data.
3.2.Boxplot Outlier Detection Model
Assume that the capacity of the sample is n. The observations areA A A1, 2, 3...An. Set the p quartile for the sample (0<p<1), denoted byAp. Here are some laws:
(1) At least nup observations are not more thanAp ; (2) At least nu (1 p) observations are more than Ap.
Method for finding the p quartile of sample is: transfer A A A1, 2, 3...An to ascending column,
(1) (2) ( )n A dA d dA ([ ] 1) ( ) ( 1) , 1 , 2 n p p n p n p A n p A A A n p u u u u = ° ® ª º u = ° ¬ ¼ ¯ (1)
If nup is not integer, then take the smallest integer greater than nup , which is[n pu ] 1. If nup is an integer, then take the average of nupand [n pu ] 1.
When p =0.5, A0.5is the median, denoted by M; when p=0.25, A0.25is the lower four quartile, denoted by 1
Q ; when p=0.75, A0.75 is upper four quartile, denoted by 3Q ; and the interquartile range is IQR ,
3 1
IQR Q Q .
When the data falls in [ 3, 3 1.5Q Q IQR]or [ 1 1.5Q IQR Q, 1], it is suspected outliers. When the data falls outside of [ 1 1.5Q IQR Q, 3 1.5 IQR], then it is extreme outliers.
4.Application of Boxplot in the Detection of Insider Trading
4.1.Characteristics of Insider Trading
Through literature, insider trading has the following characteristics that can be used as a reference of insider trading identification when we analyzed data [12-14].
Firstly, insider trading occurs often in the company's window period or sensitive period. This is because that the insider is likely to enter the market for personal gain during the company’s stock price fluctuations periods before and after the announcement.
Secondly, Insider transaction process will produce a phenomenon. Traders want to earn larger profits. A huge amount of buying and selling will cause attention of authorities, while small amount of purchase exist the problem of handling fees. So insider trading people tend to have a moderate trading volume. In these transactions, the stock prices will have a disproportionate change with trading volume.
At last, insider transactions are generally traded in batches and short-term operation through multiple accounts. The trader will use different multiple accounts to act at the same time, for the purpose of distracting regulator’s attention. Most of insider traders just want to earn the spread during the short-term stock rising
period. We need to pay attention to the inherent relevance of the multiple accounts when they trade frequently in the same period.
4.2.Case Study
This paper selects Huang’s insider trading case for the application of Boxplot. The data is the transactions between January 1st and September 31st of Zhongguancun Stock in 2007. We choose three indicators, the trading volume, daily closing price and turnover rate, as the criterion of identification of insider trading. We will integrate the data in months and then use Boxplot to detect the outliers.
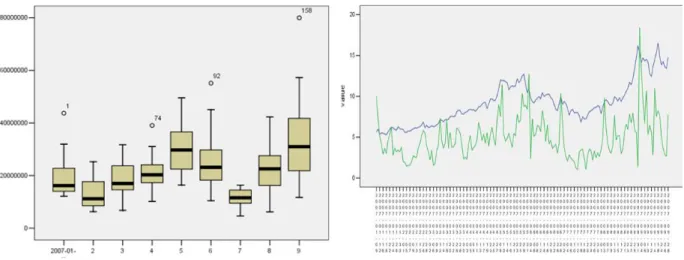
Fig. 1. Boxplot of the Daily Trading Volume Fig. 2. The Trend of Daily Closing Price and Turnover Rate. Line above represents the daily closing price, and the line below represents the daily turnover rate.
The horizontal axis represents the month, and the vertical axis is trading volume. Comparing January, April, June and September in Figure 1, there are four obvious abnormal points. Checking the sequence number in the initial data, the trading volume of January 9th, April 30th, June 1st, September 3rd are the four abnormal data. Comparing with the real situation of the case, we can ignore the outlier in January 9th, which was caused by the reform of the split share structure. While in April, the listed company tended to have asset replacement with Pengtai Company, which was not announced to public. And Huang participated in this decision-making. In July and August, Zhongguancun Company tended to carry on the rearrangement of assets with Pengtai Company, which was not announced as well. Huang directed others to purchase a total of more than 900 million shares during April 27th to June 27th. From August 13th to September 28th, he purchased an accumulative total of more than one hundred and four million shares. As well as Xu, the former chairman of Beijing Zhongguancun Science and Technology Development Company, purchased more than thirty-one million six hundred and sixty thousand shares during this time. We found the three extreme outliers in the boxplot were exactly in these periods. What’s more, observing the median of each month, there is a large increase in May and September, as well as the overall volume. Each phenomenon has shown the existence of potential insider trading.
Generally speaking, the normal stock turnover rate is between 1% and 2.5%. Some active stock can reach 3%~7%. If the turnover rate is between 7% and 10%, then the stock is strongly active. The period when the stock is strongly active should attract our attention. We can see from the Figure 2, the average turnover rate was between 3% and 7%, always changing with the price. But there were some values which were much larger
than the average. For example, the periods between April 25th and May 14th, May 21st and June 4th, June 26th and July 6th, August 1st and August 17th, August 21st and September 12th, September 14th and September 26th all had a large amplitude. From April to June and August to October, there were frequent and sharp fluctuations in turnover rate, which indicates that there were several large-scale batch operations. Furthermore, the concentrated period matches with the period of Huang case. It is worth noting that the stock price of Zhongguancun(000931) since May 29th of 12.70 yuan began to fall all the way, until July 16th fell to 6.84 yuan because of increase in stamp duty. Nevertheless this period was the most active period of insider trading of Huang. The action of purchasing such a large volume in the stock market crash deviated from the normal trading. So the possibility of the existence of insider trading is tremendous.
4.3.Boxplot optimization method
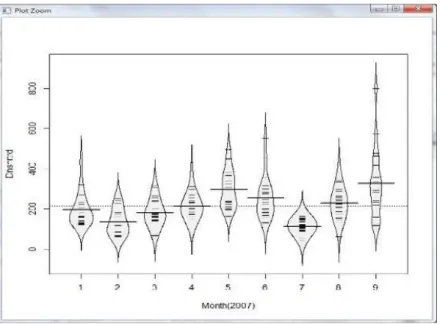
In the data processing and analysis, we found that there is a certain limitation in Boxplot. It represents central tendency, the skewness and trend of data distribution through median, quartiles and interquartile range, but we cannot know the specific characteristics of the data from the figure. From Fig.1 we can only see the monthly distribution of data, but cannot get the specific circumstances of each day from the same figure. We cannot get more valuable information, especially when the median and quartiles in each month are the same. So the authors combine the Boxplot with the density function, and add daily sample in the box using R (Fig.3).
Fig. 3. Operation Results of R by Adding Density Curve
The daily trading volume sample are added into the box. The vertical axis represents the volume of transactions, whose numbers are in ten thousands. The thick line represents the median. And the fine line represents the daily trading volume. Now we can directly see the general distribution. We can observe a month trading volume distribution to obtain which segment the transaction amount is gathered in and the abnormal transaction is.
Observing to conclude that in May and September, the trading volume was significantly greater than other months. The median was about 3 million and 3million 500 thousand shares respectively. During this period the
share price was soaring and reached the highest price, 12.14 yuan in May 23rd, 17.79 yuan in September 3rd. Transaction in May was mainly concentrated in 2 million shares per day. But there were some outliers whose trading volume was far more than 3 million shares per day. September trading volume distribution was more uniform. However there existed extreme outliers, which was far more than two points of 6 million and 8 million in May transaction. At this point, the Zhongguancun Stock (000931) had entered the final surged limit stage before the limit-up. But there was still a large number of trading phenomenon despite the risk of falling. Its motivation was doubtful. Zhongguancun Stock (000931) fell into a trough in July. The daily trading volume was nearly 1 million, which represented the public was not very optimistic about the Zhongguancun Stock (000931). While in August the trading volume began to grow and had a big deal suddenly. It indicated that someone was optimistic about the stock, and the large number of purchases pulled the stock price. Later confirmed, from August to September Zhongguancun Science and Technology Company intended to asset restructuring and backdoor listing with Pengtai Company.
5.Conclusion
On the one hand, this paper explores the application of Boxplot in outlier data mining. On the other hand, for the existing literature barely related to apply boxplot on insider trading, we do some innovative research in the field of outlier detection in insider trading. At the same time, the current studies on insider trading detection are nearly all based on the algorithm, lack of empirical research. This paper applies Boxplot on the real case, in order to test the feasibility of the method. At the end of this paper, we proposed the improvement program according to the shortcomings of the boxplot, adding density curves and scatter through R to the original figure of SPSS. From the analysis results, we need to observe the trend of the whole graph, the median position, the length of the box and the location of the outliers. Then we can predict the trend of the stock, the time points of high-frequency trading, and the volume of the trading in every segment, combining with the announcement timing and the window period to detect the insider trading. Finally, the experimental results are consistent with the facts of the case, indicating that the Boxplot in the field of insider trading is feasible and valid. Effective insider trading identification can help us prevent the occurrence of such incidents beforehand and detect the case of insider trading quickly, which can ensure the healthy and stable operation of the capital market. For further study, we will have more comparative studies with other baseline approaches of outlier mining.
Acknowledgement
This research is partially supported by the grants (71401188 and 71401194) from the National NSFC, and the CUFE-VU international research funding and Program.
References
[1] Bo Peng. Analysis on the concept, characteristics and elements of insider trading in securities. Journal Of Hunan Business College,13(1), 2006, p.64-66.
[2] Barnett V, Lewis T. Outliers in statistical data.John Wiley,1994.
[3] Struzik Z, Siebes A. Wavelet transform based multiracial formalism in outlier detection and localization for financial time series.General Information, 2002, 309, p.388-402.
[4] Ané T et al. Robust outlier detection for Asia–Pacific stock index returns. General Information, 2008, 18, p.326–343.
[5] Zhao QJ, Gan J, Che WG. Remarks on Outliers in Time Series of Stock Prices Based on Density. World Congress on Intelligent Control & Automation, 2012, p.4523 - 4526
[6] Cao L, Wang Q, Rundensteiner EA. Interactive Outlier Exploration in Big Data Streams. Proceedings of the Vldb Endowment, 2014, 7(13), p.1621-1624.
[7] Jinhua Sun, Yingjun Feng, Jian Hu. Outlier Pattern Mining of Stock Time Series with Fractal Theory. Operation Research and Management Science, 2008, 17(5), p.135-140.
[8] Hongbo Du, Zhang Ying. Outlier subsequence detection algorithm for time series based on LLM. Journal of Shenyang University of Technology, 2009, 31(3), p.328-332.
[9] Zhanwei Du et al. Stock abnormal Fluctuation Detection Algorithm Based on Adaptive Gaussian Process Machine Learning. Journal of Jilin University (Science Edition), 2012, 50(6), p.1228-1232.
[10] Sim C. H., Gan F. F.and Chang T. C.. Outlier Labeling with Boxplot Procedures. Journal of the American Statistical Association, 2005, 100(470), p.642-652.
[11] Dovoedo YH, Chakraborti S. Boxplot-Based Outlier Detection for the Location-Scale Family. Communication in Statistics- Simulation and Computation, 2015, 44(6), p.1492-1513.
[12] Chao Zhang. Characteristics Analysis and Case Studies of China’s Securities Market Insider Trading. Xiamen University, 2014. [13] Hongye Cheng. Research on Model Identification and Supervision of Insider Trading. Business, 2015(1), p.203-203.
[14] Guo Liu, Junwei Feng. Empirical Study on Stealth Trading Behaviors of Insider Traders in China’s Stock Market. Technology Economic, 2015, 34(4), p.89-94.