April 2013
Center for Benefit-Cost Studies of Education
Teachers College, Columbia University
The research reported here was supported by the Institute of Education Sciences, U.S. Department of Education, through Award Number R305U120001 to Teachers College, Columbia University. The opinions expressed are those of the authors and do not represent views of the Institute or the U.S. Department of Education.
improving early literacy:
cost-effectiveness analysis
of effective reading programs
Fiona M. Hollands
Yilin Pan
Robert Shand
Henan Cheng
Henry M. Levin
Clive R. Belfield
Michael Kieffer
A. Brooks Bowden
Barbara Hanisch-Cerda
Acknowledgements 3
Summary 4
1. Introduction 7
2. Early Literacy: Measuring the Effectiveness and Costs
of Interventions 9
2.1 Defining the Outcomes of Early Literacy Interventions 9 2.2 Selection Criteria for Early Literacy Interventions to Include
in Cost-effectiveness Analysis 10
2.3 Cost Analysis of Early Literacy Interventions 13 2.4 Comparability of Early Literacy Interventions 16 3. Cost-Effectiveness Analysis of Seven Early Literacy Interventions 20 3.1 Overview and Limitations of Cost-effectiveness Analysis 20 3.2 Kindergarten Peer-Assisted Learning Strategies 21
3.3 Stepping Stones to Literacy 26
3.4 Sound Partners 28
3.5 Fast ForWord Reading 1 31
3.6 Reading Recovery 36
3.7 Corrective Reading and Wilson Reading System 41 4. Comparing the Cost-effectiveness of Early Literacy Programs
Serving the Same Grade 50
4.1 Summary of Cost-effectiveness Results 50 4.2 Cost-effectiveness of Literacy Programs Serving
Kindergarten Students 50
4.3 Cost-effectiveness of Literacy Programs Serving First
Grade Students 51
4.4 Cost-effectiveness of Literacy Programs Serving Third
Grade Students 52
5. Conclusions 55
References 57
Appendices
Appendix I Definitions of Literacy Terms, Drawing on WWC
Definitions 62
ACKNOWLEDGEMENTS
Our ability to obtain accurate and detailed information regarding the ingredients required to implement the early literacy programs included in this study depended almost entirely on the willingness and patience of the relevant program evaluators, developers, and implementers to entertain many detailed questions. While we respect the confidentiality of our interviewees by not naming them here, we are deeply grateful for their time.
S U M M A R Y
T
his paper calculates the cost-effectiveness of seven reading programs that have been shown to be effective with respect to early literacy outcomes for students in kindergarten through third grade. Three programs serve kindergarten students: Kindergarten Peer-Assisted Learning Strategies (K-PALS), Stepping Stones to Literacy (Stepping Stones), and Sound Partners. Two of the programs primarily serve first graders: Fast ForWord Reading 1 (FFW1) and Reading Recovery. Two others serve third grade students: Corrective Reading and Wilson Reading System. All programs serve below-average or struggling readers by providing instruction that is supplementary to regular classroom instruction, except for K-PALS, which serves all readers in the regular classroom and is a partial substitute for classroom reading instruction.Effectiveness of each program in improving outcomes in alphabetics, fluency, and reading compre- hension (see Appendix I for definitions) was obtained from the What Works Clearinghouse. All seven programs showed positive impact on at least one measure of alphabetics. Three programs were also effective at improving reading fluency, and one program showed an additional positive impact on reading comprehension.
Cost data for each program were collected using the ingredients method. Program evaluators, developers and implementers were interviewed to obtain detailed information regarding the resources required to implement each program as it was evaluated. We focused on incremental costs of delivery, i.e., costs above and beyond what was already being spent on regular school programming. In one case where we could not obtain ingredients for the evaluated implementation, we costed out the ingredients required for an average implementation of the program. While our preference is to match site-level costs to site-level effectiveness data, we were only able to do this for one program as most evaluations involved small numbers of students at each site, precluding site-level impact analysis. As shown in Figure S1, personnel accounted for the most significant portion of program costs in all cases but one, FFW1, which is the only computer-based program of the seven.
Total program costs were spread over the number of students participating in the program at the study sites in order to obtain costs per student for each program. Costs per student across programs generally increased substantially with the grade of the students being served, perhaps reflecting the increasing seriousness of reading problems or the difficulty rectifying issues that were not addressed in earlier grades. Other factors affecting costs included whether the program substituted existing instruction or supplemented it; how long the intervention lasted; and whether the instructors were tutors or specially trained teachers. The range of costs was approximately $30 per student for K-PALS to over $10,000 per student for Corrective Reading.
Incremental costs per student for each program were combined with effect sizes to obtain incremental cost-effectiveness ratios. For programs that showed a positive impact on more than one literacy outcome, we split the costs across the outcomes based on percent of program delivery time spent addressing each outcome, as reported by the program developers. We found very large differences in the cost-effectiveness of the seven programs, as summarized in Table S1. For the alphabetics domain, the incremental cost-effectiveness ratios to obtain a unit increase in effect size ranged from a low of $38 for K-PALS to a high of $38,135 for Corrective Reading. For the fluency domain, the incremental cost-effectiveness ratios to obtain a unit increase in effect size ranged from a low of $165 for Sound Partners to a high of $6,364 for Corrective Reading. For each program, we conducted one or more sensitivity tests to assess the impact of different assumptions on the cost-effectiveness ratios. The majority of these involved varying the most important ingredients used in the implementation, their costs, or the number of students being served by each instructor.
The goal of cost-effectiveness analysis is to compare alternative programs for efficiency of resource use. Differences in age and reading ability of the students targeted by the seven programs limited the number of relevant comparisons. We present comparisons only among programs serving the same grade level and reading ability. At the kindergarten level, we find that Stepping Stones is more cost-effective in the alpha-betics domain than Sound Partners, but Sound Partners also has a positive impact on both fluency and reading comprehension. At the first grade level, we find that FFW1 is more cost-effective than Reading Re-covery for the alphabetics domain, but Reading ReRe-covery also has a positive impact on fluency. Finally, at the third grade level, Wilson Reading System appears to be more cost-effective than Corrective Reading for the alphabetics domain, but Corrective Reading has an additional positive impact on fluency.
One issue that remains unresolved is how to value the programs to account for impact on multiple literacy domains. We explore various alternatives but conclude that there is no satisfactory objective so-lution beyond simply comparing program impact on the ultimate goal of literacy programs: reading com-prehension. However, an individual decision-maker can assign subjective weights to the cost-effectiveness
Figure S1
Distribution of Program Costs Across Major Ingredients Categories
K-PALS Stepping Stones Sound Partners Fast ForWord Reading 1 Reading Recovery Corrective Reading Wilson Reading System
100% 50% 60% 70% 80% 90% 0% 10% 20% 30% 40%
ratios for different domains based on his/her knowledge of the literacy needs of the student population being served.
We recommend that future evaluations of reading programs include common outcome measures to facilitate comparability among programs. Studies in which two or more alternative programs are implemented with similar populations of students, and literacy outcomes are compared using the same measures, would greatly facilitate comparability not only of program effectiveness, but also of cost-effectiveness. We also suggest that cost data should be collected concurrently with effectiveness data to allow the most accurate documentation of resource requirements. Armed with data on both costs and effects of alternative literacy programs, education decision-makers can include program efficiency among the decision criteria used to select a specific program for implementation.
Table S1
Summary Characteristics and Cost-effectiveness Ratios of Effective Early Literacy Programs Programs by grade level Reading ability of target students Program duration (weeks) Total cost per student Literacy domain Effect size gain
Cost per unit increase in effect size* Kindergarten
average readers:
K-PALS** All 20 $27 Alphabetics 0.61 $38
Kindergarten struggling readers:
Stepping Stones Struggling; behavioral disorders 5 $479 Alphabetics 0.84 $570 Sound Partners 20–30th percentile 18 $791 Alphabetics 0.34 $2,093 Fluency 0.48 $165
First grade struggling readers: Fast ForWord Reading 1 Slightly below average 6 $282 Alphabetics 0.24 $601
Reading Recovery Bottom 20th percentile 12–20 $4,144 Alphabetics Fluency 0.70 1.71 $1,480 $606 Third grade struggling readers:
Corrective Reading Bottom 25th percentile 28 $10,108 Alphabetics Fluency 0.22 0.27 $38,135 $6,364 Wilson Reading System Bottom 25th percentile 28 $6,696 Alphabetics 0.33 $13,392
* Note that the cost per student is adjusted by the amount of program delivery time that addresses each literacy domain in order to calculate the cost-effectiveness ratio.
1. INTRODUCTION
Almost 40% of the elementary school day is devoted to the subjects of English, reading, and language arts, all contributing towards the development of literacy (USDOE, 1997). By comparison, only 16% of the day is spent on mathematics and about 9% each for science and social studies. With average total expenditures per student in U.S. public schools at $12,643 in 2008-2009 (NCES, 2012), spending on literacy is approximately $5,000 per student per year. The results of this substantial investment are mixed, with 33% of students in Grade 4 scoring below a basic level of proficiency in reading, as measured by National Assessment of Educational Proficiency (NAEP) tests.1 Clearly there is a need to identify and implement literacy interventions that are effective for a greater number of elementary school students, particularly struggling readers who may not be well served by the existing reading curricula in their schools.
Early investment in development of reading skills and remediation of reading difficulties is critical because early literacy is significantly associated with later academic achievement (Duncan et al., 2007; Hernandez, 2012). Indeed, Snow, Burns, and Griffin (1998) assert that many reading problems experienced by adolescents and adults arise from issues that could have been addressed in early childhood. They stress the importance of helping children overcome literacy obstacles in the primary grades or earlier. According to the Committee on the Prevention of Reading Difficulties in Young Children, all primary-grade classrooms should attend to “the alphabetic principle, reading sight words, reading words by mapping speech sounds to parts of words, achieving fluency, and comprehension” (Snow et al., 1998, p.6). This Committee recommends that effective support for struggling readers involve supplementary instruction delivered by a trained reading specialist to individual students or small groups, in close coordination with high quality instruction from the classroom teacher. Furthermore, regular communication between the elementary classroom teachers and reading specialists within a school is required to facilitate identification of students’ literacy needs, and both sets of professionals should benefit from ongoing professional development and collegial support. There are many programs and interventions that satisfy these general requirements. Schools and districts therefore face important decisions in identifying which specific programs are most effective.
Early literacy programs selected for implementation should not just be effective; given the amounts spent, these programs should also be the most cost-effective. Relative costs of the programs should be included in the criteria used in making a decision about which program to adopt. Levin (2001, 2011), Harris (2009), and others, have argued for the importance in considering both effectiveness data and costs when choosing among several alternative interventions targeting the same outcome. Tsang (1997) suggests that cost-effectiveness analysis of alternative educational interventions can inform educational reform and lead to substantial cost savings. Ross, Barkaoui, and Scott (2007) offer a similar argument that information on costs can be used to rewrite regulations and improve the efficiency of programs. Studies of cost-effectiveness have been conducted on a range of education-related topics such as teacher selection and training, educational technology, math curricula, increasing the length of the school day, peer tutoring and reduction in class size (Levin, 1995). These studies help decision-makers choose between effective programs that differ in the resources required to implement them.
Few empirical studies have been conducted on the cost-effectiveness of literacy programs (Hummel-Rossi & Ashdown, 2010). One notable exception is Simon’s (2011) cost-effectiveness analysis of four early
literacy programs: Classwide Peer Tutoring, Reading Recovery, Success for All, and Accelerated Reader. Combining effectiveness data with cost data collected retrospectively, Simon (2011) found significant differences across the four programs in costs ($500-$11,700 per student per year), effects, and cost-effectiveness ($1,400-$45,000 per unit increase in effect size for literacy outcomes). This evidence suggests a strong possibility that resources deployed to improve early literacy may be allocated more efficiently. We build on Simon’s work by tying the costs of program implementations to the effects on literacy observed as a result of those specific implementations. We are also able to investigate programs serving students in specific grade levels in elementary school and to compare programs serving the same grade.
Cost analysis by Levin, Catlin, and Elson (2007) of three adolescent reading programs also illustrates substantial variation in costs across programs and extends the analysis to site-specific variation. Costs of implementing READ 180, Questioning the Author, and Reading Apprenticeship varied significantly among sites even for the same program. For example, the cost of implementing READ 180 was as low as $285 per student at one site and as high as $1,510 per student at another site. If the program were implemented according to the developer’s recommendations, the costs should be approximately $1,100. Such differences illustrate the importance of costing out programs based on actual site-level implementation data.
In this paper, we focus on seven interventions that have been demonstrated to improve early literacy. We apply the ingredients method to calculate costs and subsequently derive cost-effectiveness ratios for the interventions. Ideally, cost-effectiveness analysis should allow us to compare the interventions and make recommendations to decision-makers as to which interventions are preferable based on economic reasoning (i.e., not accounting for politics or feasibility). However, our analysis suggests caution in making such comparisons and policy recommendations across the seven programs. As we show below, differences among the interventions and how they were studied in grade-level and reading ability of the students targeted preclude a direct comparison across all seven programs. They are not interchangeable alternatives addressing the exact same problem. Instead, we present comparisons only among programs addressing students of similar reading ability and in the same school grade. We also aim to highlight the key methodological and empirical challenges in performing cost-effectiveness analysis of literacy programs, and highlight important gaps in the existing research base, with the intention to improve future research practice.
Our analysis proceeds as follows: Section 2 describes early literacy outcomes, our selection process for the interventions included in this study, the effectiveness data we use, our methods for collecting cost data, and the comparability of these interventions; Section 3 presents the cost analysis and cost-effectiveness results for each program; Section 4 provides comparisons, summary, and discussion; and Section 5 offers some conclusions and suggestions for further research. Appendices provide definitions of terms used in the paper, the protocol used to gather evidence on ingredients used to implement each intervention, sources of national prices, and abbreviations.
2. EARLY LITERACY: MEASURING THE
EFFECTIVENESS AND COSTS OF INTERVENTIONS
2.1 Defining the Outcomes of Early Literacy Interventions
The first task in performing cost-effectiveness analysis is to identify interventions that target the same out-come and have comparable measures of effectiveness. Unfortunately, there is some disagreement about how to classify early literacy outcomes. Distinguishing literacy outcomes for our purposes is particularly challenging because these outcomes are hierarchically and causally related (e.g., Snow, Burns, & Griffin, 1998). The 2000 Report of the National Reading Panel (NICHD, 2000) defines three overarching catego-ries of outcomes: alphabetics, reading fluency, and comprehension. But these categocatego-ries are not indepen-dent of each other and are more appropriately regarded as sequential.
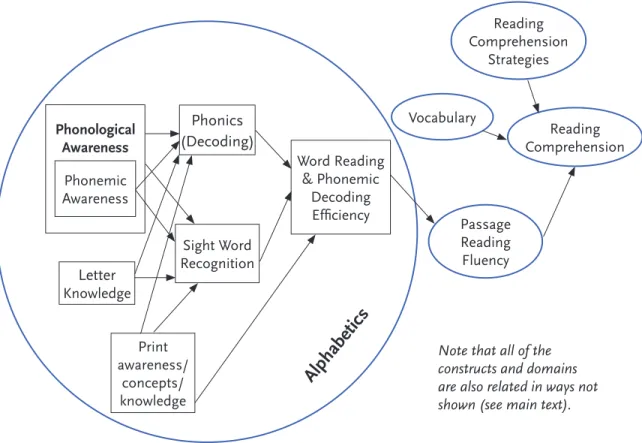
Figure 1 provides a heuristic of how these categories might be considered to relate to each other, and il-lustrates more specific outcomes within the broad categories. On this heuristic, literacy domains are repre-sented as circles and literacy constructs within domains are reprerepre-sented as squares. This heuristic is intended not as a complete model, but as a useful simplification for our purposes, given that many of the relations displayed as unidirectional are in fact considered reciprocal (e.g., vocabulary and reading comprehension;
Alphabetics
Figure 1Heuristic for the relations among proximal and distal reading domains, as informed by NICHD (2000) and the WWC classifications, with domains represented as circles and constructs within domains represented as squares.
Phonological Awareness Phonemic Awareness Letter Knowledge Phonics (Decoding) Sight Word Recognition Word Reading & Phonemic Decoding Efficiency Print awareness/ concepts/ knowledge Reading Comprehension Strategies Reading Comprehension Vocabulary Passage Reading Fluency
Note that all of the constructs and domains are also related in ways not shown (see main text).
Stanovich, 1986), many of the precursor skills are developmentally related as well (e.g., vocabulary and pho-nological awareness; Metsala & Walley, 1998), and that relations differ across development.
The What Works Clearinghouse (WWC), a national database of research reviews on the effectiveness of rigorously evaluated interventions, identifies 35 early (K-3) literacy programs that have positive or potentially positive effects for one or more of four domains: alphabetics, reading fluency, comprehension, and general reading achievement (WWC, 2012a). Within the WWC classification, alphabetics comprises a number of more narrowly defined constructs: phonemic awareness, phonological awareness, letter identification/ knowledge, print awareness, and phonics. The WWC comprehension domain comprises vocabulary development and reading comprehension. Because we obtained our effectiveness data from the WWC, for the purposes of our analysis we generally abide by the WWC classification of literacy outcomes but break out the WWC comprehension domain into vocabulary and reading comprehension “domains”. We exclude any outcomes that are not strictly reading constructs.
The seven programs we analyze are, like many reading programs, multicomponential, i.e., they each aim to address multiple aspects of literacy and target each literacy domain to varying degrees. Programs for younger children usually place greater emphasis on alphabetics, while programs for older children are more likely to address fluency or reading comprehension. One program may target only alphabetics while others may aim to address multiple literacy domains. It is therefore difficult to compare early literacy pro-grams targeted at different age groups and with different specific goals. Even when the same outcome is targeted across programs, studies of effectiveness often use different measurement instruments. The lack of consistency is problematic: decision-makers are faced with evidence from studies that do not measure effectiveness using the same metrics. Also, to the extent that effectiveness is not measured consistently, cost-effectiveness will not be either. Notwithstanding, we assume that the existing evidence base is the best available for making decisions between programs and interventions to improve literacy.
2.2 Selection Criteria for Early Literacy Interventions to Include in Cost-effectiveness Analysis
For our cost-effectiveness comparison we selected from the WWC inventory of effective early literacy programs using two criteria. First, we identified the subset of the 35 WWC-listed K-3 literacy programs that showed a statistically significant positive impact on at least one test of the phonics construct within the alphabetics domain. Phonics, “the acquisition of letter-sound correspondences and their use in reading and spelling” (NICHD, 2000), was the construct most frequently tested in programs serving K-3 students. Therefore, this selection criterion yields the maximum number of programs with a comparable impact on a literacy construct. The second criterion for inclusion of programs in our analysis was that the WWC accepted a recent evaluation of the program, published since 2005. While this criterion significantly limits the number of programs we study, the purpose of this restriction was to increase the likelihood that we could collect accurate cost data retrospectively. Asking program evaluators, developers or implementers to recall the fine details of program implementation from more than 10 years ago introduces inaccuracies that diminish the value of the cost analysis.Seven literacy programs met our two criteria: Kindergarten Peer-Assisted Learning Strategies (K-PALS); Stepping Stones to Literacy (Stepping Stones); Sound Partners, Fast ForWord Reading 1 (FFW1); Reading Recovery; Corrective Reading; and Wilson Reading System.2 Table 1 summarizes key details of each of the
2 One program that met our criteria, Success for All, was excluded because while the seven programs we selected required no significant reorganization of school operations, this program is a whole-school reform model.
Table 1
Program Details for Seven Early Literacy Programs as E
valuated Program/study characteristic K-PALS Stepping Stones Sound Partners Fast F orW ord Reading 1 Reading Recovery C orrective Reading Wilson Reading System
Grade level of students in study
K K K 1 and 2 1 3 3
Targeted students in evaluated studies
A
verage readers
Struggling readers with behavioral disorders Below average readers, 20-30th percentile Slightly below average readers
Bottom 20% of
readers
Bottom 25th percentile of readers Bottom 25th percentile of readers
Total number of students receiving intervention
Around 4,400 across 71 schools 65 across 17 schools 54 across 13 schools 103 across 3 schools 94 across 47 schools 44 across 11 schools 53 across 10 schools Duration 20 weeks 5 weeks 18 weeks 6 weeks 12-20 weeks 28 weeks 28 weeks
Point of impact testing after program start
18 weeks 5 weeks 18 weeks 5-6 weeks End of intervention and year end 28 weeks 28 weeks Dosage 35 mins/day , 72 lessons 20 mins/day , 25 lessons 30 mins/day , 4 days/week 43 mins/day , 5 days/week 30 mins/day , 5 days/week 60 mins/day , 5days/week 60 mins/day , 5days/week Delivery
Whole class with regular
teacher
, partially
replaces regular instruction 1-1 pull-out with tutor
,
supplements classroom instruction 1-1 or 1-2 pull- out with tutor
,
supplements classroom instruction 25-30 pull-out students in lab with monitor
,
supplements classroom instruction 1-1 pull-out with Reading Recovery teacher
,
supplements classroom instruction
1-3 pull-out
with C
orrective
Reading teacher
,
supplements classroom instruction 1-3 pull-out with Wilson Reading System teacher
,
supplements classroom instruction
Evaluation study used for cost- effectiveness analysis
Stein et al., 2008 Nelson, Benner ,
& Gonzales, 2005; Nelson, Epstein, Stage, & Pierce, 2005
Vadasy & Sanders, 2008 Scientific Learning C orporation, 2005 Schwartz, 2005 Torgesen et al., 2006 Torgesen et al., 2006 Note.
In some cases not all of the students receiving the intervention were included in the evaluation study sample due to missing d
ata, sampling procedures or because the
seven programs. Within the context of literacy, there are both commonalities and differences. Across the programs, three focused on kindergarten students, two on first-graders, and two on third-graders. One study focused on students of all reading levels, whereas the others focused on struggling or below-average readers. The programs – or more precisely, the versions that were evaluated – operated at different scales, ranging from 44 to 4,400 students, and were each spread across three to 71 schools. Salient for our cost analysis, the programs ranged in terms of: duration (weeks of implementation); dosage (minutes per day); and mode of delivery. These descriptions affirm that, even after restricting our choice set to programs that share similar features, there is considerable variation in literacy programs.
For each of the seven programs that met our criteria, we selected the most recent evaluation study listed by WWC to use as the basis of our cost-effectiveness analysis. It is important for cost-effectiveness analysis to match the costs associated with a specific implementation of a program with the corresponding level of effectiveness observed for that implementation. This generally precludes the use of average effect sizes obtained from multiple evaluations of the same program. In the case of Stepping Stones, two studies that
were almost identical in nature and conducted in the same year were combined.3
The effectiveness of each program in the domains of alphabetics, fluency, and reading comprehension is reported by WWC in the form of effect sizes known as Hedges’ g, “the difference between the mean outcome for the intervention group and the mean outcome for the comparison group, divided by the pooled within-group standard deviation on that outcome measure” (WWC, 2013, p.20). Table 2 summarizes the effect sizes provided by WWC intervention reports for each program. It should be noted that effect sizes are more useful for comparison purposes than for direct interpretation, as they are relative measures without units. Under a normal distribution, an effect size of 1 represents a substantial increase – movement from the 50th percentile on the underlying measurement instrument to about the 84th percentile. Table 2, column 3, shows the average annual effect size gain in literacy for different grades as reported by Hill, Bloom, Black, and Lipsey (2007), who argue that effect sizes “should be interpreted with respect to empirical benchmarks that are relevant to the intervention” (p.1). The effect size gains reported for each of the seven programs are based on studies with high quality research designs where a positive effect for at least one literacy construct
has been established.4
While all the studies from which we obtained effectiveness data employed rigorous research designs involving random or partially random assignment of students to treatment and control conditions,5 there are several reasons to be cautious in assuming that the effectiveness results observed could be replicated under typical school conditions. In four of seven cases (K-PALS, FFW1, Stepping Stones, and Sound Partners), at least one of the evaluators was also a developer of the program. In the additional case of Reading Recovery, the evaluator has been a trainer for the program and a senior administrator at the Reading Recovery Council of North America. These affiliations with the evaluated programs may introduce bias towards positive
3 Future analyses could include multiple cost-effectiveness assessments for each program, each one based on a different evalua-tion, in order to obtain a range of cost-effectiveness estimates for each intervention.
4 Six of the studies used random assignment. The evaluation study of Sound Partners uses a quasi-random assignment to guaran-tee that “each classroom was represented in the control group” and “to ensure a larger dyad-tutored total group size relative to the individual-tutored group size” (Vadasy & Sanders, 2008, p.933).
5 The WWC has established a protocol for evaluating research and it summarizes the evidence from studies that meet reasonable standards of validity, as per its WWC Procedures and Standards Handbook (2013). All of these programs were evaluated by stud-ies that use a randomized controlled trial or quasi-experimental design and meet the requirements of low or moderate attrition, comparable baseline characteristics between the treatment and the control groups in the analytic sample, and appropriate measure-ment of confounding factors. We expect the resulting estimates of effectiveness to have high internal validity.
results in a variety of ways, not least of which is that fidelity of program implementation is likely to be higher in these situations than in situations where the developer is not actively ensuring the program is delivered as intended.
Table 2
Effect Sizes Observed for Seven Literacy Programs
Program
Grade(s) served
Average annual effect size improvement in
literacy for this grade† Alphabetics Fluency
Reading comprehension
K-PALS K 1.52 0.86* nm nm
Stepping Stones K 1.52 0.84na nm nm
Sound Partners K 1.52 0.34ns 0.48* 0.41*
FFW1 1 and 2 0.97/0.60 0.24* nm nm
Reading Recovery 1 0.97 0.7* 1.71* 0.14ns
Corrective Reading 3 0.36 0.22na 0.27* 0.17ns
Wilson Reading
System 3 0.36 0.33na 0.15ns 0.17ns
Note. Effect sizes from WWC, 2007abcd, 2008, 2010, 2012b; †Hill et al., 2007.
* Statistically significant. na = this effect size is an average of two or more effect sizes at least one of which is statistically significant; ns = not significant; nm = not measured. No results reported for the vocabulary domain because none of the studies we used mea-sured outcomes in this domain.
Furthermore, several of the studies involved significant effort to measure fidelity of implementation (K-PALS, Stepping Stones, Sound Partners, Wilson Reading System, and Corrective Reading), including observations of the instructor working with students and, in some cases, provision of feedback to the in-structors to help them improve delivery. Such investments of time by observers are unrealistic in typical school situations such that these studies may not represent the implementation of programs as they are routinely delivered at scale. Compounding this issue is the fact that for all programs but K-PALS, the evalu-ation involved delivery of the program to a fairly small number of students (in the range of 50 to 100), and it is not clear that similar results could be replicated at greater scale or with different populations.
2.3 Cost Analysis of Early Literacy Interventions
The ingredients method was used to determine the costs of each program (Levin & McEwan, 2001). The purpose behind the ingredients (or resource) approach is to account for the opportunity cost of all of the resources required to implement the particular educational intervention being evaluated, irrespective of their source. By focusing on ingredients, this approach begins not with a budget, but with the details of the intervention and its resource requirements. Budgets are inadequate for accurate cost analysis for several reasons: they do not include the costs of items used in program implementation that were purchased in years prior to program operation, or that are contributed by another agency such as the state, a private institution, parents or volunteers; and they do not amortize the costs of capital items that can be spread over many years. Additionally, budgets often list items by function (e.g., administration, instruction, professional
development, training) or by “object” (e.g., teachers, substitutes, administrators), rather than by program, so that it is difficult to determine what portion of costs is attributable to which activity. Finally, budgets generally represent plans for resource allocation rather than actual expenditures made (Levin & McEwan, 2001, p.45-46).
The aim of our cost analyses is to estimate the cost of replicating the implementation of each early literacy program in order to achieve impact results similar to those observed in the relevant evaluations. Tsang (1997) emphasizes that a “competent cost analysis can inform decisionmakers about the full resource requirements of an education program, thus avoiding a significant underestimation in costs that can cause difficulties during program implementation” (p.322).
In the evaluation studies we reviewed for the seven literacy programs included in our analysis, most or all of the costs of implementing the program being evaluated were borne by the funding agency sponsoring the study, so that the program was apparently “free” to the schools. We wish to emphasize that the “cost” of a program is determined by the value of the resources that are required, not by how the program is financed. We present costs of replicating program implementation from the perspective of the typical school. We expect that, in typical situations, most of the costs of school-based early literacy programs will be borne by the school itself while some costs, for example, a district-wide literacy coach, might be funded by the school district. Small amounts might be underwritten by families in the form of volunteer time or home-based reading materials. We consider only the costs of the programs above and beyond the resources students already receive as part of their regular instruction in school, i.e., we identify the incremental costs of introducing the programs into existing school activities.
Each program we studied displaced some other instruction for the students receiving the intervention. In most cases where a few students were pulled out of the main classroom to participate in a supplementary literacy program, we determined that there were unlikely to be any significant changes in instruction in the main classroom from which they were temporarily removed. The slightly reduced class size would still likely have required the same number of personnel and use of facilities. It is possible that slightly fewer materials were utilized in the main classroom but as these are generally a tiny percentage of costs, they would not significantly impact overall costs.
One program, K-PALS, was delivered to the whole classroom by the regular classroom teacher, in the same classroom space, as a partial substitute for regular reading instruction. We assumed that this substitution neither added to nor subtracted from the costs of the teacher and facilities for instructional time. However, if we were able to determine the precise ingredients used during regular reading instruction and their costs, we would be able to assess whether K-PALS actually cost more or less than the programming it replaced. Again, most likely the differences would be in materials and equipment which account for a small proportion of most of the interventions we review. We are also not able to account for the costs of lost regular instructional time because assessments of outcomes beyond literacy were not included in the evaluations. For example, if students were regularly pulled out of science classes to participate in a reading intervention, they would probably perform less well on assessments of science achievement.
An initial list of the ingredients required to implement each program was compiled through careful review of evaluation studies listed by WWC and other publicly available articles, reports, web sites or materials for each program. A detailed interview protocol was developed for each program (based on a generic protocol we devised, see Appendix II) to elicit further information regarding the ingredients identified and to identify additional ingredients not already listed. Because personnel typically account for 70-80% of the costs of educational interventions (Levin, 1975), most of our interview questions sought to elicit details about the people involved in implementing the program, whether directly or peripherally. For example, while an evaluation report may have indicated that tutors were used to deliver a program
four times a week in one hour sessions, we collected detailed information about the qualifications and work experience of the tutors, what proportion of their work time was spent on the program, and how many hours were spent in training, preparing lessons, tracking student progress, communicating with the classroom teacher, principal, parents, and so on.
We contacted the developers and the evaluators of each program, inviting them to participate in telephone interviews to answer questions about the program ingredients. Depending on the complexity of the program and the resource details already available prior to the interviews, the interviews ranged in length from 40 minutes to 2 ½ hours. Follow up questions or clarifications were answered through brief phone calls or via email. In each case we also asked whether we could obtain identities of the schools and teachers or trainers who participated in the evaluations so that we could obtain site-level ingredients data and investigate how implementations may have varied across sites. In most cases, the evaluators’ confidentiality agreements with study participants precluded this possibility. However, we were able to interview one or more persons beyond the evaluators who were (or are) directly involved in implementations of FFW1, Corrective Reading, Wilson Reading System, and Reading Recovery.
Once the ingredients required to implement each program were specified, the next step was to associate each ingredient with a national price to make the programs directly comparable. Most prices were obtained from publicly available databases such as the National Occupational Employment and Wage Estimates by the Bureau of Labor Statistics. Appendix III provides details on our sources for national prices. In some instances, we used a specific price obtained from the program developer such as the cost of a site license for FFW1. All prices are converted to 2010 dollars for consistency across programs although a few materials and equipment items such as computers are in current dollars as price changes do not occur in line with inflation and/or 2010 prices are not easily available. All costs associated with initial training to implement a program are amortized over 3 years except for situations where we know the average tenure of the personnel receiving the training, in which case we amortize over the period of tenure. We do not amortize ongoing professional development that occurs on a regular basis. For educational facilities rental rates are not generally available as national prices, so we use total construction costs of school buildings (construction costs adjusted for cost of land, development, furnishings and equipment) and amortize over 30 years. We use a 3% interest rate for amortization, reflecting the current yield of 30 year U.S. Treasury Bonds. Using a higher interest rate (e.g., 5%) yields higher per student costs for facilities, but because in all cases facilities costs are a small percentage (up to 7%) of the total, the relative costs of the programs are not highly sensitive to the interest rate used.
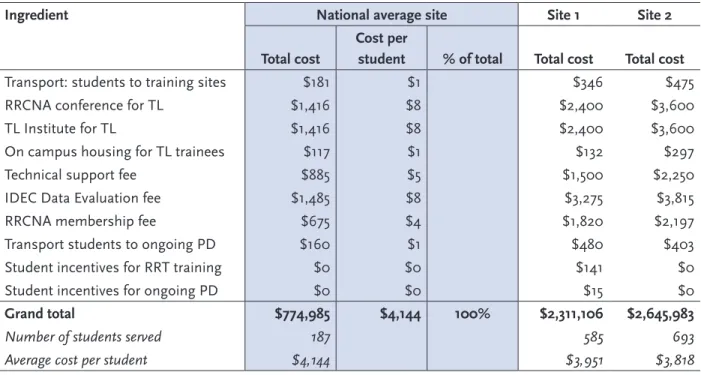
Costs for all of the programs except Reading Recovery reflect the program as evaluated in the studies we selected. Costs for Reading Recovery are based on an “average” implementation as described by the developers and evaluators of the program because we were not able to identify an interviewee who could recall enough details about the evaluated implementation and insufficient information was available in written reports.
For five of the programs (K-PALS, Stepping Stones, Sound Partners, Corrective Reading, and Wilson Reading System), significant resources were devoted towards assuring fidelity of implementation such as having trained observers watch lessons being delivered and providing feedback to the instructors. Any activities that we believe may have affected the impact of the program were included as a cost while those that were associated only with the research requirements of conducting an evaluation were not included. For example, administration of post-tests was not counted as a program cost if the purpose was simply to determine program impact. However, if the post-tests were used to determine continuation in the program we did include the associated costs. Pre-tests were counted as a cost if they were used as screening measures to determine treatment eligibility or placement.
2.4 Comparability of Early Literacy Interventions
Differences in literacy outcomes targeted
Even after applying our selection criteria to facilitate a cost-effectiveness comparison of early literacy pro-grams, we still faced a number of methodological and empirical challenges with respect to their compa-rability. First, the seven programs were each designed to improve a variety of early literacy domains and constructs, not only phonics. In fact, according to the developer of Stepping Stones, the program does not target phonics skills directly but places an emphasis on phonological and phonemic awareness, important precursor skills shown to have causal impacts on phonics (NICHD, 2000). In some of the evaluations, measures were used to assess impact on a literacy construct that the program did not aim to address, and in some cases the evaluation did not assess impact on all the constructs that were addressed. These incon-sistencies and gaps in measurement of effects are problematic when attempting to compare programs for overall impact on literacy.
Differences in the number of literacy outcomes addressed by a program should be considered when evaluating efficiency of resource use because in some cases the investment is “buying” more than one outcome. To address this issue we collected data from program developers and evaluators on the average percentage of program delivery time that was allocated to each literacy construct/domain, summarized in Table 3. We subsequently distribute costs for each program across the literacy domains targeted by the program using the proportions from Table 3. To facilitate comparability of outcomes among the programs, we aggregated the more granular literacy constructs on the survey into the four overarching
domains of alphabetics, passage reading fluency (hereafter referred to as fluency)6, vocabulary, and reading
comprehension.
The evaluator of Reading Recovery did not feel that the program goals could be parsed into individual constructs or domains because “the various criterion measures are very interrelated and just provide an indication of developing processing systems for reading and writing” (R. M. Schwartz, personal communication, February 19, 2013). While the program addresses all components of early literacy, the emphasis on each varies according to each individual student’s needs (Schwartz, 2005). WWC reports impact findings for Reading Recovery in the alphabetics, fluency, and reading comprehension domains.7 We assume, for the purposes of our cost-effectiveness calculations, that Reading Recovery targets each of the four domains of alphabetics, fluency, vocabulary, and reading comprehension equally in order to distribute program costs across the multiple outcomes. We assume that the emphasis on each of these domains will vary by individual student, but that they receive roughly equal amounts of emphasis when the instructional efforts are aggregated across children. We recognize the limitations of this assumption in that it may not perfectly capture the integration of elements in Reading Recovery. However, we concluded that it was the most reasonable approach to allow us to incorporate the information on Reading Recovery in our study. We also provide an alternate analysis in which only 10% of delivery time is attributed to the alphabetics domain to demonstrate the impact of changing this assumption on the cost-effectiveness ratio. Future research should investigate alternate approaches to parse the instructional emphasis on different domains for multicomponential literacy programs.
6 It is worth noting that we followed the WWC classification scheme in classifying the construct of word reading efficiency under the domain of alphabetics, and distinguishing this from the domain of passage reading fluency. We recognize that other research-ers may group word reading efficiency and passage reading fluency together and encourage future research to consider this pos-sibility, but we believe this is a reasonable decision in alignment with the WWC classification of outcome measures.
Table 3
Percent of Program Delivery Time Addressing Literacy Outcomes
Literacy domain Literacy construct K-PALS Stepping Stones Sound Partners FFW1 Reading Recovery C orrective Reading**
Wilson Reading System
Alphabetics Phonological/Phonemic Awareness 20% 55% 5% 15% — 2.5% 12% Phonics/Decoding 20% — 50% 10% — 55.5% 21% Sight W ord Recognition 20% — 15% 10% — — 9% W
ord Reading Fluency
15% — 10% 10% — 25% 14% Letter Identification/Knowledge — 30% 10% 5% — — 5% Print A wareness/Print C oncepts/Print Knowledge — 10% — — — — 5%
Other (Letter Sound Correspondence)
10% — — — — — —
Other (Rapid Naming)
— 5% — — — — —
Total for Alphabetics
85% 100% 90% 50% 25% 83% 66% Fluency
Passage Reading Fluency
15% — 10% 10% 25% 17% <2% Vocabulary Vocabulary — — — 18% 25% — — Reading Comprehension Reading comprehension strategies
— — — 15% 25% — 4% * Other (Spelling/Encoding) — — — 5% — — 28% *
Other (Grammatical concepts)
— — — 2% — — — — Total 100% 100% 100% 100% 100% 100% 100% Note.
Source of data was survey responses from program developers, except for Reading Recovery where we assign an equal percentage o
f time to each of the four literacy
domains. Wilson Reading System and C
orrective Reading were modified for the evaluated implementation to eliminate the comprehension strand for C
orrective Reading and the
vocabulary and comprehension components for Wilson Reading System. T
ypical implementations of these programs include more time devoted to these literacy domains. * W
e
do not show a domain for these items because they are considered to be writing concepts rather than reading concepts. **F
or C
orrective Reading the developer gave us percent
time for each of the two program levels (B1 and B2) used by the majority of students in the T
orgesen et al. (2006) study
. W
e averaged the data for the two levels assuming that an
Program Differences in Duration, Target Population, and Assessment Measures
In addition to considering the variety of literacy outcomes targeted among programs, a second concern relates to comparability across programs with different durations. While individual students in all program evaluations we relied on for effectiveness data benefited from the interventions for less than one year, treatment duration varied substantially. FFW1 and Stepping Stones were delivered over just 5-6 weeks, Reading Recovery lasted 12-20 weeks per cohort, Sound Partners lasted 18 weeks, K-PALS lasted 18-20 weeks per cohort, and both Corrective Reading and Wilson Reading System were implemented over 28 weeks. Outcomes were generally measured at the end of the intervention period, except for Reading Recovery where outcomes were measured again six months after the intervention ended for the first cohort treated. We note that a number of empirical studies either raise questions or provide evidence with respect to fade-out of effects over time, e.g., Rothstein (2010), for teacher effectiveness; Camilli, Vargas, Ryan, and Barnett (2010), and Currie (2001), for early childhood interventions. Fade-out effects may vary based on student characteristics and program design features (Currie & Thomas, 1995). None of the seven literacy programs we reviewed conduct longer term follow-up testing to investigate the fade-out effects.
A third comparability issue relates to grade spans and student abilities. While each of the seven programs was implemented with students in grades K-3, the target populations differed within this range, and generalizability of the results to other populations is uncertain. The K-PALS study targeted all students in regular kindergarten classrooms, including struggling, average, and high-achieving readers. The Stepping Stones study also targeted kindergarten students, but only those who were at risk for behavioral disorders and reading difficulties. Sound Partners targeted kindergarten students scoring between the 20th and 30th percentiles of standardized reading tests. FFW1 targeted first and second graders who were slightly below average readers, and Reading Recovery targeted the bottom 20% of readers of each first grade classroom. Corrective Reading and Wilson Reading System were both used with third grade students, scoring mostly in the bottom 25th percentile of their grade on standardized tests.
Even across these grade spans, it is debatable whether literacy gains are comparable. Hill et al. (2007) report that annual gains in reading test scores vary substantially but predictably across grades: the average reading test effect size for students progressing through kindergarten to first grade is 1.52 compared with 0.97 for Grade 1-2 students, and 0.36 for third-fourth graders. Programs targeting older students may look less effective than those targeting younger students, even if the students show a greater than typical gain in literacy. This suggests that a fair comparison of reading programs can only be made by including studies of programs addressing students in the same grade. Alternatively, if the data were available, cross-grade-level comparisons might be viable if observed gains could be compared to the expected gains for each given grade level and reading level of participants (e.g., struggling or average), in order to determine the “value-added” gain provided by each program.
A fourth concern is that the measures used to capture program impacts were not identical across studies, even for the same domain, and it is possible that some measures are more sensitive to instruction than others. For example, the studies of K-PALS and FFW1 used Rapid Letter Sounds and TOPA Letter Sounds respectively, both of which are measures that are arguably more proximal to the phonics instruction provided, while the studies of the other five programs used more distal measures. Use of proximal measures may increase the likelihood of a large effect size. Hill et al. (2007) report that while the average effect size from 389 random assignment studies of interventions targeting elementary school students is 0.33, the range extends as low as 0.07 when the measures of effectiveness are “broadly focused” standardized
tests (p.8), (analogous to a distal measure in our terms), to as high as 0.44 for specialized tests (proximal measures in our terms).
Effect sizes are also likely to be inflated when the study participants are relatively homogenous with respect to performance on the measure of outcome, in this case when reading abilities are similar (Fern & Monroe, 1996; Olejnik & Algina, 2000). If the standard deviations for the outcome measure scores are small (because students are more homogenous), the effect size will automatically appear larger than for a group of participants who score more diversely. A study focused only on struggling readers scoring below a certain percentile on a reading test is therefore prone to effect size inflation relative to a study of whole classrooms.
3. COST-EFFECTIVENESS ANALYSIS
OF SEVEN EARLY LITERACY INTERVENTIONS
3.1 Overview and Limitations of Cost-effectiveness Analysis
The primary purpose of cost-effectiveness analysis is to compare interventions in terms of efficiency of resource use in addressing a common outcome. Cost-effectiveness ratios are calculated by dividing a cost metric, for example, cost per student, by a measure of effectiveness, such as an effect size, in order to demonstrate the cost per unit of improvement in the outcome of interest. In this study we divide cost per student, adjusted for percent of program delivery time addressing each literacy domain, by the effect size (reported in Table 2) observed on measures of alphabetics, fluency, or reading comprehension. Because we consider only the costs of the programs above and beyond the resources that students already receive as part of their regular instruction in school, the ratios we report are incremental cost-effectiveness ratios.
Unfortunately, because site-level sample sizes are so small in almost all the program evaluations we use for the seven programs, it is not possible to investigate site-specific variation in cost-effectiveness, except in the case of FFW1. Levin et al. (2012), and Bowden (2013) demonstrate that cost-effectiveness ratios can vary widely for the same program being implemented at different sites. These differences may be a result of vari-ation in use of ingredients, the efficiency of their usage, prices for a given ingredient, and to differential ef-fectiveness in delivering the program to the specific population being served at each site. We were able to obtain both site-level effectiveness and site-level cost data only for FFW1. For K-PALS and Sound Partners we were able to obtain costs and effects for variations in the implementation, but not at the site level. For Reading Recovery we were able to obtain cost data for two different sites but not site-level impact data. For all programs, our interviewees were able to give us some indications of how implementation might vary across sites and we used this information to conduct sensitivity analyses to investigate how these variations might impact costs.
A further issue for our analysis created by data limitations relates to the issue of incremental cost-effectiveness. In all the studies we reviewed, students received the intervention during school time so that time was lost on other academic activities. In some cases the intervention partially replaced existing literacy instruction, while in others, students were pulled out of periods devoted to social sciences or other subjects. Ideally, evaluators should attempt to assess whether other outcomes were affected even as some literacy outcomes may have been improved. Levin (2002) analyzes comprehensive school reforms and observes that shifting resources from an unmeasured outcome to a measured outcome will likely improve results on the measured outcome, but a full accounting of the costs and effects should take into account any offsetting losses on unmeasured outcomes. In the case of the literacy programs we study, the evaluators could administer pre- and post-tests for other literacy outcomes and subject areas to determine whether the students receiving the literacy intervention performed any differently from the comparison group receiving “business as usual”. Because these assessments were not made, we assumed that the literacy effects reported for each program were additional to effects from business as usual.
While our initial intention was to compare all seven programs in a cost-effectiveness analysis, the dif-ferences noted above in age group and reading level served, outcomes measured, and duration of interven-tions suggest that more limited comparisons are prudent. For each program we first perform an individual analysis: we describe the intervention, report on its resource usage and cost of delivery, and then relate these costs to the evidence on effectiveness to derive cost-effectiveness ratios. We also perform sensitivity testing. Subsequently, we offer direct comparisons only among programs targeting same-grade students of compa-rable reading ability.
K-PALS, Stepping Stones and Sound Partners all target kindergarten students, but K-PALS stands out because it is delivered to entire classrooms of mixed ability readers as opposed to being a pull-out, small group program for struggling readers. Hence we compared the two programs for struggling readers to each other (Stepping Stones and Sound Partners) and suggest that K-PALS is not a directly comparable alter-native to these two programs. Even the comparison of Stepping Stones and Sound Partners has limitations because the former lasts 5 weeks and the latter 18 weeks.
Reading Recovery and FFW1 both target first grade students who are below-average readers, although the study of FFW1 also included some second graders. Cost-effectiveness ratios of these two programs may also be compared although FFW1 is much shorter in duration (6 weeks vs. 12-20 weeks for Reading Recovery).
Both Wilson Reading System and Corrective Reading were studied in the same evaluation. The pro-grams were implemented with third grade struggling readers for the same length of time, and using the exact same outcome measures to test for impact on literacy constructs. This situation provides the best-case scenario for application of cost-effectiveness analysis.
Boardman, Greenberg, Vining, and Weimer (2011) suggest three types of sensitivity analysis for cost-effectiveness ratios to assess robustness of the results under different assumptions: best and worst case sensitivity testing, which places extreme bounds on the results; parameter variation sensitivity testing, where the most influential variables in the model are changed; and Monte Carlo simulation, where the distributions of variables are incorporated into the model. For each program we analyze, we consider one or more sensitivity tests to evaluate the impact of alternate assumptions on the cost-effectiveness ratios we present. Because the programs are all short in duration (less than one year), there is no need to adjust costs for their time value, therefore we do not report sensitivity tests that vary the discount rate. As previously mentioned, varying the interest rate used for amortization also has little impact on costs because items that are amortized over long periods of time, such as facilities, account for only a small percentage of the program costs for the interventions we studied. The major variables and assumptions we test and report are: mode of implementation, number of students served by each program or by each instructor, and the costs of the personnel who represent the most significant expense.
3.2 Kindergarten Peer-Assisted Learning Strategies
K-PALS Program Description and Effectiveness
K-PALS is one of several iterations of Peer-Assisted Learning Strategies created by L. and D. Fuchs at the Vanderbilt Kennedy Center for Research on Human Development at Vanderbilt University. The program is used in mainstream kindergarten classrooms by the entire class. At the beginning of each session, the teacher models being a coach to the entire class, guiding the group through a phonics game or exercise. The class subsequently breaks into pairs, with each student in the pair taking turns being the “reader” and “coach.” The coach guides the reader through exercises while giving feedback and encouragement. K-PALS falls under the umbrella of a collection of peer-assisted learning programs (PALS) developed by the same researchers for improving reading and mathematics outcomes; the other PALS programs incorporate simi-lar instructional routines (e.g., pairing) but with different, age-appropriate curriculum for different grade levels of students. Other implementations of PALS, such as a program targeting reading achievement for English language learners in third through fifth grades, have been identified as having “potentially positive” effects by the WWC.
The evaluation study that we selected for our analysis was conducted by Stein et al. (2008) from 2004-2005. The program developers were among the evaluators conducting the study. The study sample included 3,171 students from 71 schools in Minnesota, South Texas, and Nashville, Tennessee. Prior to program delivery, all students in the treatment classrooms were screened using the Rapid Letter Sounds test, assigned within classrooms to “High,” “Medium” and “Low” reading ability and ranked in order of score. Classroom teachers used the ranked scores to pair students so as to create a consistent and optimal difference in achievement between students within pairs. The classroom teachers received one day of training in how to use K-PALS in their classrooms and subsequently embarked on a series of 72 lessons, 35 minutes each, delivered over 18-20 weeks. Student pairs were changed every 4-6 weeks.
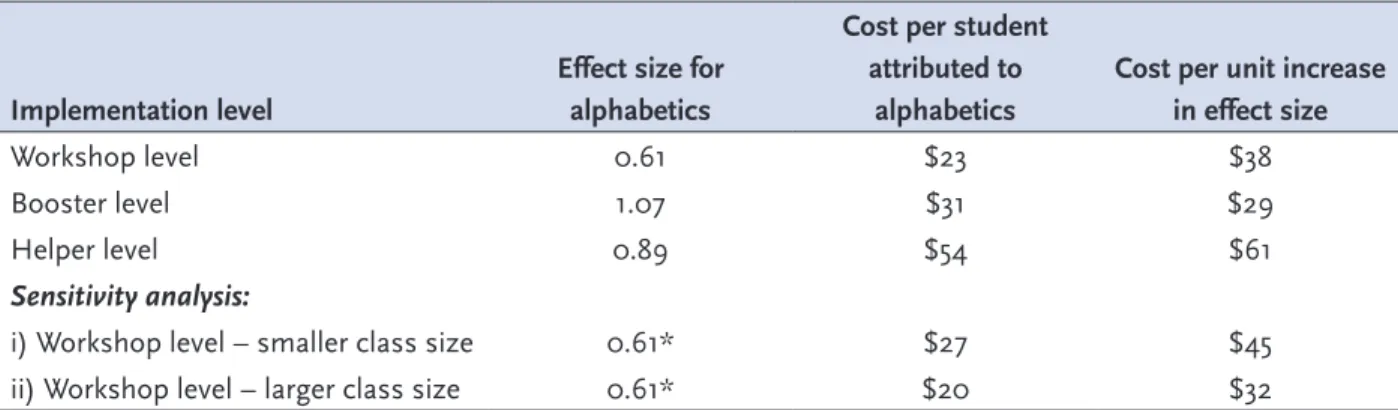
In addition to the base-case “workshop” implementation with only one day of training, two additional levels of implementation provided increasing levels of training and support for the classroom teachers in their delivery of K-PALS. At the second level, the classroom teachers received two additional training sessions, or “boosters” during the treatment period. At the third level, the teachers were provided with the additional booster training sessions and also with graduate student “helpers” in the classroom. The evaluators wanted to investigate how additional training and support might affect efficacy of the program. Throughout the two-year study, fidelity of implementation measures were employed to assess whether teachers were delivering the program as intended.
After 17 weeks of lessons, the program impact on students’ phonics skills was measured using the Rapid Letter Sounds test. As noted previously, this test may be particularly sensitive to instruction such that the large effect sizes observed for each implementation level might not be replicable if more distal measures of phonics were used. The base-case “workshop” implementation with only one day of training for the classroom teachers resulted in an effect size of 0.61 for alphabetics skills. The booster and helper levels of implementation yielded effect sizes of 1.07 and 0.89 respectively for alphabetics skills. It appears that while the booster sessions helped improve the impact of the program, the addition of a helper in the classroom did not add further to the impact, but in fact reduced it from the booster level.
K-PALS Ingredients and Costs
Through phone interviews and email exchanges with a K-PALS developer and evaluators at Vanderbilt University we created a list of the ingredients utilized in program delivery. While all three implementation levels utilized the same baseline ingredients, the booster level required additional training time and the helper level further added a graduate student. Table 4 lists the ingredients at each level of implementation, their estimated total costs for the period of the evaluation, the cost per student of each ingredient, and the percentage of total costs accounted for by each of the categories of ingredients (personnel, facilities, materi-als and equipment, and other inputs).
The program was used with entire classrooms but only the four top, four bottom and four middle scorers on the initial screening test were included in the study sample. The total number of students served by the program was not available so, in order to spread costs across all students in the K-PALS classrooms, we estimated the total number of students as follows: we used the reported proportion of sample students at each implementation level and the total number of teachers reported to estimate the number of teachers in each condition (control, workshop, booster, helper); we then assumed that each teacher taught a class of 20 students, using the midpoint of the class size range of 16-24 students reported to us by one of the program evaluators.
For the workshop level of implementation, total costs for 1,732 students across 71 schools were $46,566 and costs per student were very low at $27, with 60% being attributable to personnel. It is notable that
Table 4
Ingredients and C
osts for K-PALS
W orkshop level Booster level Helper level Ingredient Ingredient cost C
ost per student Percent of total
Ingredient
cost
C
ost per student
Percent of
total
Ingredient
cost
C
ost per student
Percent of total Personnel total $27,938 $16 60% $41,646 $25 68% $53,796 $51 79% Classroom teacher $9,648 $6 $15,156 $9 $9,796 $9 Substitute teachers $3,966 $2 $3,738 $2 $2,416 $2 Screening testers $1,440 $1 $1,374 $1 $845 $1 Project C oordinators – training $2,332 $1 $2,224 $1 $1,429 $1 Project C oordinators – implementation fidelity $10,552 $6 $10,065 $6 $6,466 $6 Principal Investigator — — $7,131 $4 $4,617 $4
Graduate assistants (providing training)
— — $1,958 $1 $1,268 $1
Project staff – training and supervising helpers
— — — — $5,939 $6
Graduate student helpers
— — — — $21,020 $20 Facilities total $497 $0 1% $1,410 $1 2% $2,283 $2 3%
Classroom for training
$497 $0 $474 $0 $305 $0
Classroom for booster
— — $935 $1 $618 $1
Classrooms for helper training and meetings
— — — — $1,361 $1
Table 4
Ingredients and C
osts for K-PALS
W orkshop level Booster level Helper level Ingredient Ingredient cost C
ost per student
Percent of
total
Ingredient
cost
C
ost per student
Percent of
total
Ingredient
cost
C
ost per student Percent of total Personnel total $27,938 $16 60% $41,646 $25 68% $53,796 $51 79% Classroom teacher $9,648 $6 $15,156 $9 $9,796 $9 Substitute teachers $3,966 $2 $3,738 $2 $2,416 $2 Screening testers $1,440 $1 $1,374 $1 $845 $1 Project C oordinators – training $2,332 $1 $2,224 $1 $1,429 $1 Project C oordinators – implementation fidelity $10,552 $6 $10,065 $6 $6,466 $6 Principal Investigator — — $7,131 $4 $4,617 $4
Graduate assistants (providing training)
— — $1,958 $1 $1,268 $1
Project staff – training and supervising helpers
— — — — $5,939 $6
Graduate student helpers
— — — — $21,020 $20 Facilities total $497 $0 1% $1,410 $1 2% $2,283 $2 3%
Classroom for training
$497 $0 $474 $0 $305 $0
Classroom for booster
— — $935 $1 $618 $1
Classrooms for helper training and meetings
— — — — $1,361 $1
Materials and equipment total
$10,301 $6 22% $9,781 $6 16% $6,297 $6 9% C
opies – Rapid Letter Sounds
$67 $0 $64 $0 $41 $0 K-PALS manual $1,190 $1 $1,122 $1 $725 $1
Large print lessons
$1,263 $1 $1,190 $1 $769 $1 DVD $17 $0 $16 $0 $10 $0
Student score sheets
$4,826 $3 $4,603 $3 $2,956 $3 Overhead projector $564 $0 $531 $0 $343 $0
Transparencies, pens, folders, stickers
$2,375 $1 $2,254 $1 $1,451 $1
Other inputs total
$7,830 $5 17% $8,647 $5 14% $5,539 $5 8% C
oordinator travel – implementation fidelity
$6,583 $4 $6,279 $4 $4,035 $4 C
oordinator travel – training
$1,247 $1 $1,189 $1 $741 $1
Local travel to booster sessions
— — $1,178 $1 $762 $1 Grand total $46,566 $27 100% $61,483 $37 100% $67,915 $64 100% Table 4 Ingredients and C
osts for K-PALS (
continued) W orkshop level Booster level Helper level Ingredient Ingredient cost C
ost per student
Percent of
total
Ingredient
cost
C
ost per student
Percent of
total
Ingredient
cost
C
ost per student Percent of total