1
Less Visited Tourism Spaces in South Africa
Professor Christian M. RogersonSchool of Tourism & Hospitality College of Business and Economics
University of Johannesburg Bunting Road Campus
Johannesburg Email: Crogerson@uj.ac.za
Abstract
Within the vibrant and expanding body of tourism scholarship around peripheral regions, there are limited geographical studies on locational issues. Notwithstanding a substantive contribution by geographers to understanding a cross-section of tourism issues the need exists to ‘re-spatialize’ our understanding of tourism patterns in peripheral areas. It is against this backdrop that the purpose of this paper is to build upon recent analyses of South Africa’s tourism space economy and investigate the location of ‘less visited tourism spaces’ in the country. Situated within an international literature on peripheral tourism this analysis reviews a range of indicators concerning less visited tourism spaces in South Africa. The focus is explicitly upon identifying the most marginal and in many respects most ‘off the tourism map’ local municipalities in South Africa as a counterpoint to previous works that identify across a range of similar indicators the most significant and leading spaces for tourism development. Overall, the paper represents a contribution both to an evolving South African scholarship on tourism geography, as well as to an expanding international literature around peripheral tourism spaces. Keywords: Tourism space economy; uneven development; peripheral spaces; less visited tourism areas
Introduction
Understanding the contours and changing dynamics of the tourism space economy is one of the challenges facing tourism geographers (Pearce, 1979; Hall & Page, 2006, 2009; Hall, 2013a). For Africa, the broad picture emerges of the unevenness of the geographical development of tourism both at the continental scale and also on the intra-national scale of analysis. In South Africa, a number of recent investigations by geographers have interrogated aspects of the national tourism space economy (Visser, 2007; Rogerson, 2014a, 2015, 2016a, 2016b). The work so far undertaken discloses a picture of an essentially core-periphery spatial structure with South Africa’s major urban areas the central hubs of the national space economy and the major beneficiaries of tourism development that has occurred particularly over the past two decades or so (Visser 2007; Visser & Hoogendoorn, 2012; Rogerson & Rogerson, 2017).
The geographical unevenness of the benefits of tourism expansion has been a matter of mounting concern for national and local policymakers in South Africa. Increasingly, tourism has increasingly been viewed by the national government, as a vehicle for addressing the vagaries of spatially uneven development (Rogerson & Nel, 2016). In several statements issued from national policy-makers in tourism, commitments are made to address the issue of the spatially imbalanced character of the tourism economy and correspondingly to promote tourism expansion in the areas of the country which currently are seen as ‘off the beaten track’ of either domestic or international travellers. One policy focus is support for the promotion of rural tourism. During 2012, the national rural tourism strategy was launched with a vision of forging a “developed rural tourism economy” (Department of Tourism, 2012). The strategy offers an explicit focus upon boosting tourism expansion and of tourism impacts in the
2
country’s least visited provinces and most undeveloped regions. Essentially, the geographically targeted regions for growth are the country’s Priority Development Districts – now increasingly referred to collectively as the distressed areas - which correspond closely (but not precisely) to the boundaries of the apartheid-created former Bantustans or Homelands (Rogerson, 2015a; Rogerson & Nel, 2016).
Recently, in a number of investigations, the contours and make-up of the tourism economy of the distressed areas has been sketched (Rogerson, 2014b, 2015a; Rogerson & Hoogendoorn, 2014; Rogerson & Nel, 2016). Taken as a whole, these investigations point to a tourism economy in the distressed areas, which is strongly dominated by visiting friends and relatives’ tourism as opposed to the more lucrative leisure or business forms of tourism. In addition, the existing works point to the overwhelming dominance of domestic as opposed to international visitors in these peripheral areas of South Africa’s tourism space economy. Building upon this body of writings the focus in this particular analysis is squarely upon identifying in greater detail the patterns and micro-geography of South Africa’s undeveloped and ‘less visited’ tourism spaces. Overall, the paper must be read as a contribution both to an evolving South African scholarship on tourism geography, as well as a modest contribution to an expanding international literature around peripheral tourism spaces.
Peripheral Tourism Spaces
Tourism development in peripheral regions and questions surrounding ‘peripheral tourism’ represent important themes in international scholarship. In a classic early contribution Christaller (1964) stated that peripheries undoubtedly are ‘places for tourism’ as tourists avoided agglomerations and centres of industry. Since the appearance of Christaller’s (1964) much-cited study, the development challenges, planning and management of tourism in peripheral regions have been significant foci of research (Buhalis, 1999; Brown et al. 2000; Moscardo, 2005; Muller, 2016). In particular, the economic, social and environmental problems around peripheral tourism have been explored in a number of different contexts (Keller, 1987; Hohl & Tisdell, 1995; Hall, 2013b; Lee et al., 2017). Carson & Carson (2017: 103) point out that tourism destinations located in geographically remote or sparsely populated regions “are subject to quite distinct development constraints, including small and fragmented local industry players, distance to markets and decision-makers, and dependence on external investors”. Indeed, with economic leakages often strong in peripheral tourism development and weak local multipliers Chaperon & Bramwell (2013) argue that the concept of dependency is valuable for providing insights into the relationships between core regions and peripheral tourism spaces. In Scandinavia the special importance of small firms in remote peripheral tourism development is highlighted most notably by Brouder (2013).Lifestyle entrepreneurs also can assume a significant role in the evolution of certain peripheral tourism destinations (Johannesson & Lund, 2017). Overall, it is evident that tourism trajectories in remote peripheral areas are “likely to evolve in different ways compared with destinations in urban or even other (less remote) peripheral areas that are within easy access from major population centres” (Carson & Carson, 2017: 103).
Economic restructuring and adjustments triggered by globalization often stimulate attempts by localities to broaden their economic base by embracing tourism either in circumstances of agricultural decline or resource base depletion (Buhalis, 1999; Hall et al., 2011; Bohlin et al., 2016). In many marginalized, peripheral or rural areas tourism is viewed increasingly as a critical sectoral driver for assisting local economic development, employment growth and welfare enhancement (Müller & Jansson, 2007; Brouder, 2013; Bohlin et al., 2016). Tourism expansion is considered to be one pathway by which marginal regions and localities potentially
3
can overcome stagnation or decline and rejuvenate themselves (Hall et al., 2011; Brouder, 2012a, 2012b; Lund & Johannesson, 2014). Innovation is of critical importance for growing the competitiveness of peripheral tourism areas as ‘post-productive’ spaces (Brouder, 2013; Carson et al. 2014). As Carson and Carson (2017: 106) point out tourism in remote areas mainly is “introduced as a new economic activity at times when traditional resource industries are declining and economic diversification and rejuvenation are urgently required”. Across the European Union, tourism promotion in peripheral areas has been actively supported in order to galvanize the economic restructuring of marginal or declining rural areas (Wanhill, 1997; Saarinen, 2003, 2007; Pavilanskas, 2010-11; Bohlin et al., 2016). Likewise, in the case of Brazil, recent attention has been given to the role of tax incentives as a catalyst for tourism development in that country’s peripheral areas especially the SUDENE region (Garsous et al., 2017).
Arguably, for marginal areas tourism, if suitably planned, this can be a new economic base or staple. Indeed, insights from Staples theory, have been used to advance understanding of remote tourism area development in the case of Australia (Carson & Carson, 2017).Nevertheless, for Brouder (2013) tourism development often is simply a last economic resort for many peripheral areas “by selling the only thing that they may have of appeal to people in the core – the idea of ‘wilderness’” (Brouder, 2013: 15). In a useful contribution, Atkinson (2016: 199) draws our attention to the steady growth of tourism in arid areas across several regions of the world “due to a post-modern fascination with remoteness, barrenness, silence and solitude”. Both the works of Muller & Jansson (2007) and of Saarinen (2007, 2014) show that in many rural places tourism has been selected or emerged through externally-driven processes as a major replacement activity to be stimulated through leveraging the asset of pristine environments. This phenomenon has been interrogated in an array of research investigations which have appeared over recent years variously about peripheral spaces in Australia, Canada, Finland, Iceland, New Zealand, USA and Sweden (Keller, 1987; Hall, 2007; Müller & Jansson, 2007; Hall et al., 2011; Brouder, 2012a, 2012b, 2013; Huijbens et al., 2014; Lund & Johannesson, 2014; Bohlin et al., 2016; Carson & Carson, 2017; Johannesson & Lund, 2017). Buhalis (1999) and Jewell et al. (2004) caution, however, that many peripheral regions enter into the business of tourism promotion without a full appreciation of the sector’s development and management challenges a situation which frequently results in disappointing outcomes.
Tourism development in peripheral areas is considered to be both an opportunity and a threat, particularly in remote wilderness locations (Lee et al., 2017). Across the peripheral regions of developed countries, the promotion of tourism in regional development continues to be widespread albeit “with a more considered approach than previously” (Brouder, 2012a: 333). The policy focus progressively is shifting towards seeing tourism as one element for local and regional revival and its intersection with other (non-tourism) sectoral development initiatives (Saarinen, 2003, 2007, 2014). As Brouder (2013) stresses, the opportunities for peripheral localities to realise and maximise local economic potential from tourism may be curtailed because of external control of key decisions beyond the control of communities made by governments or private investors as well as urban consumer preferences (Brouder, 2013). In Austria the policy consensus is that in peripheral areas of the country tourism development should be anchored upon three basic principles namely environmental soundness, local value-added and social acceptance (Hummelbrunner & Miglbauer, 1994).
Another different strand of writings on peripheral tourism recently has emerged. This body of work draws attention to the development of tourism in ‘ordinary places’ through a refocusing on local spaces. Condevaux et al. (2016: 6) view ordinary places as those including small and medium-sized towns with no established tradition of tourism, and which “seek in tourism a new way of developing or of economic and territorial relabelling”. Such ordinary places are deemed
4
as “non-tourism” localities as they have not been identified or recognised as tourism areas and would include rural areas without coasts, mountains or obvious leisure tourism assets. These ordinary places are viewed as “becoming synonymous with ‘non-tourist place’ in the sense that there is nothing remarkable about it that makes it attractive” (Condevaux et al. 2016: 7). It is argued that the growth of tourism in these ordinary spaces can occur either through a logic of inventing a tourism area based on ‘ordinary-ness’ or through a process of diffusion from existing tourism areas towards local ordinary areas. Tourism in ordinary places thus is a component of what is also referred to as ‘off the beaten track’ travels (Delaplace & Gravari-Barbas, 2016). In his seminal study of tourism area life cycles Butler (1980) indicated that all places are potential tourism destinations. Within the vibrant and expanding body of tourism scholarship around peripheral regions one recent important study by Müller (2016) underscores the limited volume of geographical studies on locational issues. Notwithstanding a substantive contribution by geographers to understanding a range of tourism issues (Hall & Page, 2009) the need to ‘re-spatialize’ our understanding of tourism in peripheral areas is identified because of the limited extant scientific literature on the actual location of tourism. It is against this backdrop that the task in this paper is to extend Müller’s (2016) work by investigating in detail the spatial patterns of ‘less visited tourism spaces’ as a contribution to a knowledge gap about locational issues pertaining to peripheral tourism.
Methodology
In South Africa the availability of official sub-national data for economic development planning is limited in a parallel with the situation of many other African countries (Rogerson, 2013). Accordingly, for sub-national economic planning in the country, increased reliance is placed upon the local economic research data and modelling frameworks which have been developed by both international and local private sector research organizations, most importantly those of IHS Global Insight and Quantec. The research data-bases and outputs of these two private sector organisations are utilised widely by both national and local governments across South Africa to inform public policy making and local development planning interventions. For the tourism sector in South Africa, the only official data available to monitor the economic contribution of tourism at a sub-national level is at the scale of the country’s nine provinces. For a more detailed spatial analysis, researchers must turn to the unpublished data base provided by IHS Global Insight. This South African tourism data base represents a subset of the IHS Global Insight Regional eXplorer which is a consolidated platform of integrated data bases that provides at present the most useful data at sub-national scale, including down to municipal (and for major cities even at administrative region) level (IHS Global Insight, 2015). Data is collated regularly from a wide range of sources (official and non-government) with the primary data reworked to ensure consistency across variables and by applying national and sub-national verification tests in order to ensure that the model is consistent for measuring business activity (IHS Global Insight, 2015).
The local tourism data base of Global Insight is especially rich as it offers details of the tourism performance of all local municipal authorities in the country in respect of inter alia, the number of tourism trips differentiated by primary purpose of trip; bednights by origin of tourist (domestic or international); indicators of tourism spend; and of the contribution of tourism to local gross domestic product. From this data base information was extracted for this analysis for all 226 local municipalities and the eight metropolitan municipalities (City of Cape Town, eThekwini, Ekurhuleni, City of Johannesburg, Nelson Mandela Bay, City of Tshwane, Mangaung, and Buffalo City) in the country in order to track the least visited spaces of the country. The group of 44 District Municipalities were not included for analysis as these encompass the non-metropolitan local authorities. The data relates to 2015. Using Excel the lowest ranked 30 local municipalities were isolated across a range of different indicators to provide the basis of
5
this study of South Africa’s least visited tourism spaces. No previous study of this kind has been undertaken for South Africa. Indeed, the focus in this exploratory analysis is thus explicitly upon identifying the most marginal and in many respects ‘off the tourism map’ local municipalities in South Africa as a counterpoint to several works that identify across a range of similar indicators the most significant and leading spaces for tourism development in South Africa (see Rogerson, 2013, 2014a; Rogerson & Rogerson, 2017).
Results
Where are South Africa’s least visited and most marginal tourism spaces? In order to answer this question the bottom ranked 30 local municipalities of the total of 234 municipalities are identified across a range of different indicators relating to total tourism spend, total trips and total bednights and then unpacked further by origin of trips, whether domestic or international, and finally differentiated by different purpose of trips looking at the three most important components namely, leisure, business or visiting friends and relatives. The data relate to the available data from IHS Global Insight for 2015.
6 Table 1: Total Spend
Source: Based on Unpublished Global Insight data
Table 2: Total Tourism Trips (includes Leisure, Business, VFR and Other)
Local Municipality Total %National
KZN285 Mthonjaneni 18137 0.00044594
KZN211 Vulamehlo 18077 0.00044446
NC092 Dikgatlong 17465 0.00042941
NC078 Siyancuma 15954 0.00039226
Local Municipality R1000 Current
Prices
%National
EC135 Intsika Yethu 67797 0.0002862
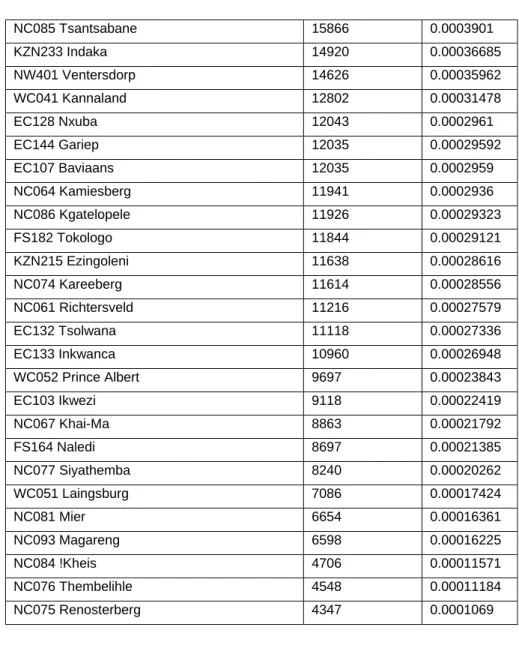
EC444 Ntabankulu 64099 0.0002706 NC066 Karoo Hoogland 62249 0.0002628 NC081 Mier 59952 0.0002531 NC092 Dikgatlong 58354 0.0002464 EC144 Gariep 55879 0.0002359 NC064 Kamiesberg 53819 0.0002272 KZN215 Ezingoleni 53455 0.0002257 NC085 Tsantsabane 52111 0.00022 NC061 Richtersveld 51619 0.0002179 NC074 Kareeberg 50923 0.000215 NW393 Mamusa 48601 0.0002052 KZN253 Emadlangeni 46265 0.0001953 EC132 Tsolwana 45807 0.0001934 FS183 Tswelopele 45096 0.0001904 WC051 Laingsburg 44424 0.0001875 NW401 Ventersdorp 44341 0.0001872 EC103 Ikwezi 39436 0.0001665 EC128 Nxuba 38697 0.0001634 KZN254 Dannhauser 38450 0.0001623 NC086 Kgatelopele 37944 0.0001602 FS164 Naledi 32250 0.0001362 NC077 Siyathemba 32230 0.0001361 EC133 Inkwanca 26415 0.0001115 FS182 Tokologo 23957 0.0001011 NC076 Thembelihle 19271 >0.0001 NC067 Khai-Ma 19218 >0.0001 NC075 Renosterberg 18990 >0.0001 NC093 Magareng 17621 >0.0001 NC084 !Kheis 17132 >0.0001
7 NC085 Tsantsabane 15866 0.0003901 KZN233 Indaka 14920 0.00036685 NW401 Ventersdorp 14626 0.00035962 WC041 Kannaland 12802 0.00031478 EC128 Nxuba 12043 0.0002961 EC144 Gariep 12035 0.00029592 EC107 Baviaans 12035 0.0002959 NC064 Kamiesberg 11941 0.0002936 NC086 Kgatelopele 11926 0.00029323 FS182 Tokologo 11844 0.00029121 KZN215 Ezingoleni 11638 0.00028616 NC074 Kareeberg 11614 0.00028556 NC061 Richtersveld 11216 0.00027579 EC132 Tsolwana 11118 0.00027336 EC133 Inkwanca 10960 0.00026948 WC052 Prince Albert 9697 0.00023843 EC103 Ikwezi 9118 0.00022419 NC067 Khai-Ma 8863 0.00021792 FS164 Naledi 8697 0.00021385 NC077 Siyathemba 8240 0.00020262 WC051 Laingsburg 7086 0.00017424 NC081 Mier 6654 0.00016361 NC093 Magareng 6598 0.00016225 NC084 !Kheis 4706 0.00011571 NC076 Thembelihle 4548 0.00011184 NC075 Renosterberg 4347 0.0001069
Source: Based on Unpublished Global Insight data
Table 3: Total Bednights (includes Domestic and International)
Local Municipality Total %National
NC092 Dikgatlong 15778 0.00048958 FS183 Tswelopele 15168 0.00047064 KZN233 Indaka 14051 0.00043599 NC085 Tsantsabane 13782 0.00042764 NC078 Siyancuma 13194 0.00040939 FS196 Mantsopa 13142 0.00040778 NW401 Ventersdorp 12634 0.00039202 EC128 Nxuba 11255 0.00034922 EC133 Inkwanca 10533 0.00032682 EC132 Tsolwana 10364 0.00032158 FS182 Tokologo 10209 0.00031678 KZN215 Ezingoleni 9902 0.00030725
8 EC107 Baviaans 9692 0.00030074 NC064 Kamiesberg 9523 0.00029548 EC144 Gariep 9353 0.00029023 NC086 Kgatelopele 9297 0.00028849 NC061 Richtersveld 9164 0.00028436 EC103 Ikwezi 8764 0.00027194 NC067 Khai-Ma 8454 0.00026232 NC074 Kareeberg 8277 0.00025685 WC041 Kannaland 7184 0.00022293 NC077 Siyathemba 6913 0.00021452 WC052 Prince Albert 6693 0.00020769 NC093 Magareng 6154 0.00019097 FS164 Naledi 5933 0.0001841 WC051 Laingsburg 5420 0.00016819 NC081 Mier 4406 0.00013671 NC084 !Kheis 3965 0.00012305 NC076 Thembelihle 3937 0.00012218 NC075 Renosterberg 3496 0.0001085
Source: Based on Unpublished Global Insight data
Tables 1, 2 and 3 provide the macro-scale indicators which monitor respectively the lowest ranked 30 municipalities in relation to total tourism spend, total tourism trips and total bednights. For each indicator the proportionate contribution of each local municipality to the national total is also provided. These three tables provide the broadest picture of South Africa’s least significant tourism spaces. Table 1 reveals the marginalization of the 30 least important local municipalities in terms of estimates of tourism spend. Taken together these 30 most marginal spaces account for less than 1 percent of national tourism spend. At the bottom of the group of 30 local municipalities with the lowest amount of tourism spend are the five Northern Cape municipalities of Kheis, Magareng, Renosterberg, Khai-Ma and Thembelihle. Examining the list of 30 local municipalities with the lowest tourism spend the largest share – nearly a half (14 in total) – are from Northern Cape. The remainder include seven local municipalities in Eastern Cape, three each from Free State and KwaZulu-Natal, two from North West and one local municipality – Laingsburg – in the Western Cape. No local municipalities from Gauteng, Limpopo or Mpumalanga provinces fall into the lowest ranking on the basis of tourism spend.
Tables 2 and 3 present respectively the bottom list of ranked local municipalities in respect of Total Tourism Trips and Total Bednights. The category of Total Tourism Trips includes all the four categories of purposes of trips, namely business, leisure, visiting, friends and relatives (VFR) and other, which mainly incorporates health and religious travel. In total 11 local municipalities record in 2015 an estimated total of less than 10 000 tourism trips and three local municipalities based in Northern Cape have less than 5000 trips. Once again, as a whole, the most marginal tourism spaces of South Africa as shown on Table 2 in terms of total visits are headed by the cluster of Northern Cape local municipalities. The Northern Cape accounts for seven of the ten most marginal local municipalities and 14 of the bottom ranked 30 local municipalities. Of the rest, 6 of the lowest 30 municipalities are in Eastern Cape, four in KwaZulu-Natal, three in Western Cape, two in Free State and one in North West. As with the category of Total Tourism spend no local municipalities are found in the bottom 30 local municipalities from the three provinces of Gauteng, Limpopo and Mpumalanga. A similar set of results are evident when examining data for the category of total bednights, which includes both domestic and international travel (Table 3). The three Northern Cape local municipalities
9
of !Kheis, Thembelihle and Renosterberg record the worst performance on both indicators. At the provincial scale of the lowest ranked 30 municipalities 14 are from Northern Cape, six from Eastern Cape, four from Free State, three from Western Cape, two from KwaZulu-Natal and one (Ventersdorp) from North West. As the total trip and bednight data is weighted nationally by the category of VFR travel Tables 2 and 3 indicate certain minor differences to the Total Spend data. One observation is that the two Western Cape local municipalities of Prince Albert and Kannaland are ranked in the bottom 30 municipalities for both Total Trips and Bednights but not for Total Spend. This suggests that the tourists that visit these particular local municipalities are higher spend than for example those either to the Northern Cape municipality of Karoo Hoogland or Mamusa in North West which both are ranked in the lowest tier for Tourism Spend but do not appear in the bottom 30 ranked local municipalities for either Total Trips or Bednights.
Table 4: International Trips
Local Municipality Total %National
KZN215 Ezingoleni 1736 0.00020566 KZN274 Hlabisa 1712 0.00020287 NC092 Dikgatlong 1686 0.00019973 WC051 Laingsburg 1665 0.00019731 EC442 Umzimvubu 1659 0.00019652 FS182 Tokologo 1634 0.00019358 EC137 Engcobo 1632 0.00019335 KZN214 uMuziwabantu 1587 0.00018804 KZN236 Imbabazane 1554 0.00018413
EC135 Intsika Yethu 1512 0.00017918
EC136 Emalahleni 1376 0.00016309 NC077 Siyathemba 1327 0.00015719 KZN294 Maphumulo 1247 0.00014775 EC444 Ntabankulu 1243 0.00014731 KZN253 Emadlangeni 1180 0.00013986 KZN283 Ntambanana 1177 0.00013941 EC126 Ngqushwa 1094 0.00012968 KZN233 Indaka 868 0.00010292 NC075 Renosterberg 851 0.00010081 EC138 Sakhisizwe 846 0.00010029 KZN211 Vulamehlo 830 >0.0001 KZN254 Dannhauser 828 >0.0001 EC128 Nxuba 787 >0.0001 EC132 Tsolwana 754 >0.0001 NC084 !Kheis 740 >0.0001 NC076 Thembelihle 611 >0.0001 NC093 Magareng 444 >0.0001 EC133 Inkwanca 427 >0.0001 NC067 Khai-Ma 408 >0.0001 EC103 Ikwezi 353 >0.0001
10 Table 5: Domestic Trips
Local Municipality Total %National
NC092 Dikgatlong 15778 0.00048958 FS183 Tswelopele 15168 0.00047064 KZN233 Indaka 14051 0.00043599 NC085 Tsantsabane 13782 0.00042764 NC078 Siyancuma 13194 0.00040939 FS196 Mantsopa 13142 0.00040778 NW401 Ventersdorp 12634 0.00039202 EC128 Nxuba 11255 0.00034922 EC133 Inkwanca 10533 0.00032682 EC132 Tsolwana 10364 0.00032158 FS182 Tokologo 10209 0.00031678 KZN215 Ezingoleni 9902 0.00030725 EC107 Baviaans 9692 0.00030074 NC064 Kamiesberg 9523 0.00029548 EC144 Gariep 9353 0.00029023 NC086 Kgatelopele 9297 0.00028849 NC061 Richtersveld 9164 0.00028436 EC103 Ikwezi 8764 0.00027194 NC067 Khai-Ma 8454 0.00026232 NC074 Kareeberg 8277 0.00025685 WC041 Kannaland 7184 0.00022293 NC077 Siyathemba 6913 0.00021452 WC052 Prince Albert 6693 0.00020769 NC093 Magareng 6154 0.00019097 FS164 Naledi 5933 0.0001841 WC051 Laingsburg 5420 0.00016819 NC081 Mier 4406 0.00013671 NC084 !Kheis 3965 0.00012305 NC076 Thembelihle 3937 0.00012218 NC075 Renosterberg 3496 0.0001085
Source: Based on Unpublished Global Insight data
Tables 4 and 5 seek to shed light on the different spatial patterns of the most marginal spaces as defined by both international and domestic trips. Given that the overall geography of international tourism shows distinct differences to that of domestic tourism it is to be expected that the rankings of the most marginal spaces would also exhibit certain differences. Table 4 shows the lowest ranked local municipalities for international tourism. In total 13 local municipalities record less than 1000 international trips with the least visited being Ikwezi and Inkwanca in Eastern Cape and Khai-Ma, Magareng and Thembelihle in Northern Cape. Overall, the number of Northern Cape local municipalities which are ranked in the listing of bottom 30 municipalities for international trips is much less marked than for Total Trips because of the cross-border travel, mainly from Namibia. Of the 30 least visited spaces by international tourists 11 local municipalities are in Eastern Cape and KwaZulu-Natal, 6 in Northern Cape and one each in Western Cape (Laingsburg) and Free State (Tokologo) provinces. Turning attention to the patterns of visitation for domestic tourism a different profile
11
emerges. At the individual local municipality level at the bottom of the list are a group of four Northern Cape municipalities, namely Renosterberg, Thembelihle, !Kheis and Mier, and Laingsburg in Western Cape. At the provincial level of analysis a total of 14 Northern Cape local municipalities appear in the bottom 30; the remainder are from Eastern Cape (six), Free State (four), Western Cape (three), KwaZulu-Natal (two) and North West (one). Attention turns now to unpack the least visited spaces of South Africa in terms of purpose of travel. Analysis is undertaken of the patterns for leisure (Table 6), business (Table 7) and VFR travel (Table 8). In terms of leisure trips 18 local municipalities record a total of less than 1000 trips for leisure purposes. The least visited spaces for leisure purposes in South Africa are headed by three KwaZulu-Natal local municipalities, namely Maphumulo, Dannhauser and Emadlangeni. Of the bottom ten least visited local municipalities for leisure half are found in KwaZulu-Natal. For the group of 30 local municipalities that all receive less than 1500 leisure trips a total of 13 are in KwaZulu-Natal, eight in Northern Cape, three in North West, two in Free State and Eastern Cape and one each in Gauteng (Westonaria) and Limpopo (Fetakgomo) provinces. No local municipality in Western Cape appears in the list of least visited local municipalities for leisure travel purposes. Business travel in South Africa is highly focussed on the major metropolitan centres which are the core business hubs in the country (Rogerson, 2015b). The least visited business spaces are a signifier of low levels of economic activity in the local municipality as a whole. The worst performing individual local municipalities are Ikwezi and Ntabankulu in Eastern Cape and Maphumulo in KwaZulu-Natal. For business trips of the 30 lowest ranked local municipalities 13 fall in KwaZulu-Natal, eight in Eastern Cape, six in Northern Cape, and one each in Limpopo (Aganang), North West (Ventersdorp) and Free State (Tokologo) provinces. The category of VFR travel represents the largest group of tourists and also exhibits the most distinctive geography of all the major categories of tourism in South Africa. It is a category of travel that has strong associations with the distressed areas and especially the former Homeland areas created under apartheid. One important influence impacting upon VFR travel is the actual population of particular municipalities. It is not surprising therefore to find the listing of the least visited municipalities for VFR travel linked to remote and sparsely settled rural areas. Of the ten least visited local municipalities for VFR the list is led by Mier, Thembelihle and Renosterberg as well as two Karoo municipalities in the Western Cape, namely Prince Albert and Laingsburg. Overall, of the 30 lowest ranked municipalities for VFR travel 14 are found in Northern Cape, six in Eastern Cape, five in Western Cape, three in KwaZulu-Natal and two in Free State.
Table 6: Leisure Trips
Local Municipality Total %National
KZN281 uMfolozi 1486 0.00019844 GT483 Westonaria 1459 0.00019479 NC067 Khai-Ma 1402 0.0001872 KZN244 Msinga 1387 0.00018525 NC092 Dikgatlong 1347 0.00017983 KZN227 Richmond 1343 0.00017932 NW393 Mamusa 1197 0.00015982 NC085 Tsantsabane 1167 0.00015585 KZN233 Indaka 1148 0.00015337
12 EC444 Ntabankulu 1054 0.00014079 LIM474 Fetakgomo 1023 0.00013668 NW381 Ratlou 1020 0.00013627 EC133 Inkwanca 934 0.00012472 KZN245 Umvoti 933 0.00012458 NC075 Renosterberg 897 0.00011982 KZN283 Ntambanana 851 0.0001137 KZN286 Nkandla 828 0.00011065 NC086 Kgatelopele 827 0.00011046 FS164 Naledi 816 0.00010902 KZN293 Ndwedwe 777 0.00010382 NW401 Ventersdorp 768 0.00010255 NC076 Thembelihle 709 >0.0001 KZN291 Mandeni 661 >0.0001 NC084 !Kheis 566 >0.0001 FS182 Tokologo 546 >0.0001 KZN242 Nqutu 484 >0.0001 NC093 Magareng 407 >0.0001 KZN253 Emadlangeni 406 >0.0001 KZN254 Dannhauser 337 >0.0001 KZN294 Maphumulo 219 >0.0001
Source: Based on Unpublished Global Insight data Table 7: Business Trips
Local Municipality Total %National
LIM352 Aganang 853 0.0001841 EC107 Baviaans 846 0.0001825 EC156 Mhlontlo 834 0.00018 EC141 Elundini 787 0.0001698 KZN214 uMuziwabantu 778 0.0001677 EC138 Sakhisizwe 765 0.0001651 KZN245 Umvoti 763 0.0001646 EC136 Emalahleni 754 0.0001626 KZN293 Ndwedwe 740 0.0001597 KZN435 Umzimkhulu 735 0.0001585 NC064 Kamiesberg 730 0.0001575 NC075 Renosterberg 725 0.0001564 KZN244 Msinga 721 0.0001556 NC084 !Kheis 718 0.0001548 NW401 Ventersdorp 695 0.0001499 NC061 Richtersveld 657 0.0001417 KZN211 Vulamehlo 571 0.0001232 KZN242 Nqutu 546 0.0001178 KZN215 Ezingoleni 546 0.0001178 KZN434 Ubuhlebezwe 521 0.0001124
13 KZN227 Richmond 456 >0.0001 FS182 Tokologo 411 >0.0001 EC133 Inkwanca 407 >0.0001 KZN254 Dannhauser 403 >0.0001 NC093 Magareng 358 >0.0001 KZN253 Emadlangeni 259 >0.0001 NC067 Khai-Ma 227 >0.0001 EC444 Ntabankulu 195 >0.0001 KZN294 Maphumulo 195 >0.0001 EC103 Ikwezi 192 >0.0001
Source: Based on Unpublished Global Insight data Table 8: VFR Trips
Local Municipality Total %National
KZN233 Indaka 11398 0.000457 NC073 Emthanjeni 11177 0.000448 KZN285 Mthonjaneni 11132 0.000446 NC085 Tsantsabane 11109 0.000445 FS182 Tokologo 9933 0.000398 WC034 Swellendam 9431 0.000378 NC078 Siyancuma 9391 0.000376 WC042 Hessequa 9143 0.000366 EC133 Inkwanca 8660 0.000347 EC128 Nxuba 7535 0.000302 NC086 Kgatelopele 7393 0.000296 NC067 Khai-Ma 7151 0.000286 NC061 Richtersveld 6842 0.000274 EC103 Ikwezi 6834 0.000274 NC064 Kamiesberg 6717 0.000269 EC132 Tsolwana 6572 0.000263 KZN215 Ezingoleni 6212 0.000249 NC074 Kareeberg 6097 0.000244 FS164 Naledi 5963 0.000239 EC144 Gariep 5945 0.000238 EC107 Baviaans 5352 0.000214 NC093 Magareng 4899 0.000196 NC077 Siyathemba 4790 0.000192 NC084 !Kheis 2934 0.000118 WC041 Kannaland 2845 0.000114 NC076 Thembelihle 2604 0.000104 NC075 Renosterberg 2558 0.000102 WC052 Prince Albert 2338 >0.0001 WC051 Laingsburg 2303 >0.0001 NC081 Mier 1831 >0.0001
14
Conclusion
Peripheral spaces of national tourism economies are important regions for research by tourism scholars. Currently, the international literature on peripheral tourism is mainly dominated by Northern works, which investigate either the challenges of tourism development in rural or wilderness areas, or of the role of tourism as potential catalyst for reviving the economic prospects of lagging regions. Studies of peripheral tourism spaces in the global South are not prominent in the extant literature.
Within specifically tourism geographical writings on peripheral spaces, an investigatory void identified by Müller (2016) surrounds locational issues. This paper has sought to address the neglect of locational issues by investigating the least visited tourism spaces of South Africa using municipal level data. This exploratory analysis casts research attention upon tourism (un-) development in a group of local municipalities that have barely received a mention so far in the growing stream of writings on South African tourism. The key findings in this analysis are of the identification of clusters of less visited spaces particularly in remote, rural areas of the Northern Cape, parts of Eastern Cape and KwaZulu-Natal provinces. This broad picture must be elaborated upon, however, by the recognition of particular differences that emerge in terms of least visited spaces, both for domestic and international visits and especially so for the different purpose of travel. More specific, local level research is required to understand the specific underpinnings and detailed geography of the country’s ‘off the map’ tourism spaces.
Acknowledgements
Thanks to Jonathan Research for conducting the data analysis and to University of Johannesburg for research funding. Teddy and Skye Norfolk are credited for their useful additional inputs.
References
Atkinson, D. (2016). Is South Africa’s Great Karoo Region Becoming A Tourist Destination? Journal of Arid Environments, 127, 199-210.
Bohlin, M., Brandt, D., & Elbe, J. (2016). Tourism As a Vehicle for Regional Development in Peripheral Areas – Myth or Reality?: A Longitudinal Case Study of Swedish Regions. European Planning Studies, 24 (10), 1788-1805.
Brouder, P. (2012a). Tourism Development Against the Odds: The Tenacity of Tourism in Rural Areas. Tourism Planning and Development 9, 333-337.
Brouder, P. (2012b). Creative Outposts: Tourism’s Place in Rural Innovation. Tourism Planning and Development 9, 383-396.
Brouder, P. (2013). Tourism Development in Peripheral Areas: Processes of Local Innovation and Change in Northern Sweden. PhD thesis, Department of Tourism Studies and Geography, Mid-Sweden University, Ostersund.
Brown, F., Hall, D.D. & Hall, D.R. (2000). Tourism in Peripheral Areas: Case Studies. Bristol: Channel View.
Buhalis, D. (1999). Limits of Tourism Development in Peripheral Destinations: Problems and Challenges. Tourism Management, 20, 183-185.
Butler, R.W. (1980). The Concept of a Tourist Area Cycle of Evolution. Canadian Geographer, 24, 5-12.
15
Carson, D.A. & Carson, D.B. (2017). Path Dependence in Remote Area Tourism Development: Why Institutional Legacies Matter. In P. Brouder, S.A Clave, A. Gill & D. Ioannides (eds). Tourism Destination Evolution, London, Routledge, 103-122.
Carson, D.A., Carson, D.B. & Hodge, H. (2014). Understanding Local Innovation Systems in Peripheral Tourism Destinations. Tourism Geographies, 16, 457-473.
Chaperon, S. & Bramwell, B. (2013). Dependency and Agency in Peripheral Tourism Development. Annals of Tourism Research 40, 132-154.
Christaller, W. (1964). Some Considerations of Tourism Location in Europe. Papers in Regional Science, 12 (1), 95-105.
Condevaux, A., Djament-Tran, G., & Gravari-Barbas, M. (2016). Before and After tourism(s) – The Trajectories of Tourist Destinations and The Role of Actors Involved in “Off-the-Beaten Track” Tourism: A Literature Review. Via@Tourism Review, 1 (9), 2-27.
Delaplace, M. & Gravari-Barbas, M. (2016). On the Margins of Tourism: Utopias and Realities of Off the Beaten Track Tourism. Via@Tourism Review, 1 (9), 2-8.
Department of Tourism (2012). Rural Tourism Strategy. Pretoria: National Department of Tourism.
Garsous, G., Corderi, D., Velasco, M. & Colombo, A. (2017). Tax Incentives and Job Creation in the Tourism Sector of Brazil’s SUDENE Area. World Development, 96, 87-101.
Hall, C.M. (2007). North-South Perspectives on Tourism, Regional Development and Peripheral Areas. In Muller, D.K. & Jansson, B., (Eds.), Tourism in Peripheries: Perspectives from the Far North and South. Wallingford: CABI.
Hall, C.M. (2013a). Framing Tourism Geography: Notes From the Underground. Annals of Tourism Research, 43, 601-623.
Hall, C.M. (2013b). Vanishing Peripheries: Does Tourism Consume Places? Tourism Recreation Research 38 (1), 72-77.
Hall, C.M. & Page, S.J. (2006). The Geography of Tourism and Recreation: Environment, Place and Space. London: Routledge.
Hall, C.M. & Page, S.J. (2009). Progress in Tourism Management: From the Geography of Tourism to Geographies of Tourism – A Review. Tourism Management, 30, 3-16.
Hall, C.M., Hultman, J. & Gossling, S. (2011). Tourism Mobility, Locality and Sustainable Rural Development. In D.V.L. Macleod & S.A. Gillespie (Eds.), Sustainable Tourism in Rural Europe: Approaches to Development. London: Routledge.
Hohl, A.E. & Tisdell, C.A. (1995). Peripheral Tourism: Development and Management. Annals of Tourism Research 22 (3), 517-534.
Huijbens, E.H., Johannesson, H. & Johannesson, G.T. (2014). Clusters Without Content?: Icelandic National and Regional Tourism Policy. Scandinavian Journal of Public Administration, 18, 63-85.
Hummelbrunner, R. & Miglbauer, E. (1994). Tourism Promotion and Potential in Peripheral Areas: The Austrian Case. Journal of Sustainable Tourism, 2 (1-2), 41-50.
IHS Global Insight (2015) Regional eXplorer. Available at www.ihsglobalinsight.co.za/products/ReX/ [Accessed 10 July 2015].
16
Jewell, B., Blackman, A., Kuilboer, A., Hyvonen, T., Moscardo, G. & Foster, F. (2004). Factors Contributing to Successful Tourism Development in Peripheral Regions. Journal of Tourism Studies, 15, 59-70.
Johannesson, G.T. & Lund, K.A. (2017).Creative connections?: Tourists, Entrepreneurs and Destination Dynamics. Scandinavian Journal of Hospitality and Tourism DOI 10.1080/1502221050.2017.1340459
Keller, C.P. (1987). Stages of Peripheral Tourism Development – Canada’s Northwest Territories. Tourism Management, 8, 20-32.
Lee, Y., Weaver, D. & Prebensen, N.K. eds. (2017). Arctic Tourism Experiences: Production, Consumption and Sustainability.Wallingford: CABI Publishing.
Lund, K.A. & Johannesson, G. (2014) Moving Places: Multiple Temporalities of a Peripheral Tourist Destination. Scandinavian Journal of Hospitality and Tourism, 14 (4), 441-459.
Moscardo, G. (2005). Peripheral Tourism Development: Challenges, Issues and Success Factors. Tourism Recreation Research, 30 (1), 27-43.
Müller , D. (2016). On the Location of Tourism: An Outlook from Europe’s Northern
Periphery. In M. Mayer & H. Job (eds.), Naturtourismus: Chancen und Herausforderungen, Mannheim: Meta GIS Systems, 113-124.
Müller, D.K. & Jansson, B. (2007). The Difficult Business of Making Pleasure Peripheries Prosperous: Perspectives on Space, Place and Environment. In Müller, D.K. & Jansson, B., (Eds.), Tourism in Peripheries: Perspectives from the Far North and South. Wallingford: CABI. Pavilanskas, R. (2010-11). Tourism Serendipity: Case Study of a Peripheral Tourism Region in Rambynas Regional Park. Annales Geographicae, 43-44, 158-165
Pearce, D.G. (1979). Towards a Geography of Tourism. Annals of Tourism Research, 7, 245-272.
Rogerson, C.M. (2013). Tourism and Local Development in South Africa: Challenging Local Governments. African Journal for Physical, Health Education, Recreation and Dance 19 (Supplement 2), 9-23.
Rogerson, C.M. (2014a). The Uneven Geography of Tourism in South Africa. African Journal of Hospitality, Tourism and Leisure, 3 (1), 1-15.
Rogerson, C.M. (2014b). Rethinking Slum Tourism: Tourism in South Africa’s Rural Slumlands. Bulletin of Geography: Socio-Economic Series, 26, 19-34.
Rogerson, C.M. (2015). Tourism and Regional Development: The Case of South Africa’s ‘Distressed Areas’. Development Southern Africa, 32, 277-291.
Rogerson, C.M. (2015b). The Uneven Geography of Business Tourism in South Africa. South African Geographical Journal, 97 (2), 183-202.
Rogerson, C.M. (2016a). Secondary Cities and Tourism: The South African Record. African Journal of Hospitality, Tourism and Leisure, 5 (2), 1-12.
Rogerson, C.M. (2016b). Outside the Cities: Tourism Pathways in South Africa’s Small Towns and Rural Areas. African Journal of Hospitality, Tourism and Leisure, 5 (3), 1-16.
Rogerson, C.M. & Hoogendoorn, G. (2014). VFR Travel and Second Homes Tourism: The Missing Link?: The Case of South Africa. Tourism Review International, 18 (3), 167-178.
17
Rogerson, C.M. & Nel, E.L. (2016). Redressing Inequality in South Africa: The Spatial Targeting of Distressed Areas. Local Economy, 31 (1-2), 28-41.
Rogerson, C.M. & Rogerson, J.M. (2017). City Tourism in South Africa: Diversity and Change. Tourism Review International, 21 (2), in press.
Saarinen, J. (2003). The Regional Economics of Tourism in Northern Finland: The Socioeconomic Implications of Recent Tourism Development and Future Possibilities for Regional Development. Scandinavian Journal of Hospitality and Tourism, 3 (2), 91-113. Saarinen, J. (2007). Tourism in Peripheries: The Role of Tourism in Regional Development in Northern Finland. In Muller, D.K. & Jansson, B. (Eds.), Tourism in Peripheries: Perspectives from the Far North and South. Wallingford: CABI.
Saarinen, J. (2014). Critical Sustainability: Setting the Limits to Growth and Responsibility in Tourism. Sustainability, 6, 1-17.
Visser, G. (2007). Geography of Tourism. In R. George (ed,). Managing Tourism in South Africa, Cape Town: Oxford University Press, 34-52.
Visser, G. & Hoogendoorn, G. (2012). Uneven Tourism Development in South Africa: Another Ongoing Struggle. Africa Insight, 42 (2), 66-75.
Wanhill, S. (1997). Peripheral Area Tourism: A European Perspective. Progress in Tourism and Hospitality Research, 3 (1), 47-70.