MPRA
Munich Personal RePEc Archive
Sickness Absence: a Pan-European Study
Ilias Livanos and Alexandros Zangelidis
May 2010
Online at
http://mpra.ub.uni-muenchen.de/22627/
SICKNESS ABSENCE:APAN-EUROPEAN STUDY
Ilias Livanos♦ and Alexandros Zangelidis♠
Abstract
This study, using the EU-LFS, examines the determinants of sickness absence in 26 EU countries. The analysis highlights the importance of demographic and workplace characteristics and of institutional and societal conditions. Female workers aged 26-35 exhibit higher absenteeism, possibly reflecting the level of high household labour pressure. Increased job insecurity, captured by temporary contracts, and labour market uncertainty, reflected in higher unemployment rates, have a negative effect on absenteeism. Finally, individual sickness absence is lower in countries with higher proportion of dependent/out of the labour market individuals, probably because of the increasing pressure labour active people may experience.
Keywords: Absenteeism, sickness, EU, Labour Force Survey JEL Classification: J22, J28, J32
Acknowledgements
The European Union’s labour Force Survey is available from EUROSTAT. The views expressed in this article are of the authors and any remaining errors remain their responsibility.
♦Institute for Employment Research, University of Warwick, Coventry, CV4 7AL, UK. Email: I.Livanos@warwick.ac.uk ♠Economics, Business School, University of Aberdeen, Aberdeen, AB24 3QY, UK. Email: a.zangelidis@abdn.ac.uk
[1]
SICKNESS ABSENCE:APAN-EUROPEAN STUDY
1. Introduction
The incidence and the level of sickness absence in the workplace is an important labour market phenomenon that warrants close examination. Understanding the patterns that govern work absence can be valuable for several reasons as it entails significant social and economic costs. A large part of the literature is motivated around the costs of absenteeism and its effect on national output and economic growth. The extent of this phenomenon and the effect it may have on the welfare state of the European Union is reflected in the magnitude of the sickness absence. For example, in 1996 Spanish workers missed around 260.73 million hours of work due to illness, an equivalent of removing 154,540 people from the labour force for a year. In Sweden the average number of sickness leave days per worker per year rose from 17 in 1995 to 32 in 2002. In Norway the average annual sick days per worker increased also from 18 in 2000 to 20 through the first half of 2002. While in the Netherlands average annual sick days per worker rose from 18 in 1995 to 20 in 2000. It is estimated that the economic burden in the EU generated by illness of workers represented between 1.5 and 4 percent of GDP, depending on the Member State (Gründemann and Vuuren, 1997). It has been documented (Brown, 1994) that absenteeism causes loss of working days as much as unemployment and strikes. At European level low levels of labour utilisation has often been held responsible for the weak growth performance of many European countries (OECD, 2003).
In addition, sickness absence is regarded as a labour market behaviour and as such it is expected to be affected by the labour market conditions. The ageing population trend in the EU demographics, the increased pressure on pensions with the exit of the baby-boomers to retirement, and the legislative changes that aim to increase the statutory pensionable age in various EU countries, along with the increased labour market flexibility, sketch a gloomy picture of the European labour markets. In light of these developments, the study of the sickness absenteeism as an individual labour market behaviour gains great importance. This study aims to highlight the trends of absenteeism in the EU and to examine the main factors that determine the level of individual sickness absence in EU, using the European Union’s Labour Force Survey (EU-LFS) micro-data for 26 EU countries. Particular attention is granted on gender differences and the role individual features and characteristics of the employment contract have on those disparities. Also, the cross-country variation in the data enables the authors to identify and highlight the importance of institutional and societal differences and to draw the attention to related policy issues. This study
[2]
contributes to the absenteeism literature in several ways. To the authors knowledge this is the first investigation of sickness absence at a pan-European level covering 26 European countries. Furthermore, it uses data from a single source, the EU-LFS. The harmonisation of the variables and definitions used in the EU-LFS makes the dataset one of the most important official micro databases for comparative social research in Europe. Also, the homogeneity of the country sample with regard to the institutional framework provides a more convincing ground to make meaningful comparisons and assessments regarding the importance of the macroeconomic environment and the institutional arrangements on individual absenteeism. Although, there are other cross-country studies in the literature (e.g. Drago and Wooden,
1992; Bliksvär and Helliesen, 1997; Barmby et al., 2002; Frick and Malo, 2008), none of them has all
three sample characteristics outlined above: (1) country coverage, (2) data harmonisation and (3) homogeneity of sample.
The analysis highlights the importance both of demographic and workplace characteristics and of institutional and societal conditions. Female workers aged 26-35 exhibit higher absenteeism, possibly reflecting the level of pressure from their household and childcare responsibilities. Increased job insecurity, captured by temporary contracts, and labour market uncertainty, reflected in higher unemployment rates, have a negative effect on absenteeism. Finally, individual sickness absence is lower in countries with higher proportion of dependent/out of the labour market individuals, probably because of the increasing pressure the labour active people may experience to produce.
The remaining of this paper is organised as follows. Section 2 discusses the main factors affecting absenteeism. Section 3 introduces the datasets and methods utilised in our investigation. Section 4 shows descriptive statistics and trends on absenteeism. Section 5 presents the empirical results of the regression analysis, and Section 6 concludes the discussion with a summary and some policy recommendations. 2. Determinants of Absenteeism
The incidence of absenteeism is affected by various factors, which as Audas and Treble (2002) argue cannot be included in a single flexible theory. This section discusses the main factors encountered in the literature. The predominant explanation of absenteeism in the literature of economics is based on the traditional labour-leisure framework. This framework, which presumes imperfect labour markets, suggests that if standards hours of work exceed workers’ preferred hours of work, then there is potential utility gain from absence. Of course, this does not exclude that there might be costs from absence, such as lack of sick
[3]
leave allowance. The following predictions can be made following this framework (Dragon and Wooden, 1992): 1) the impact of an increase in wages is unclear since on the one hand it might rise absence due to the income effect, and on the other hand it might decline in response to substitution effect; 2) an increase in the usual hours of work will increase absence; 3) an increase in non-labour income increases absence as a pure income effect; and 4) increased penalties for absence (e.g. reduction of the paid sick-leave days) will reduce absence.
A large number of studies examining its cyclical properties document an inverse relationship between absenteeism and unemployment (Leigh, 1985; Shapiro and Stiglitz, 1984), and suggest that it is a pro-cyclical phenomenon. In other words, all empirical studies point to a positive relationship between business cycle and absenteeism. There are two main paths leading to this conclusion; one demand and one supply driven. The demand driven path, called ‘employer selection’ (Leigh, 1985) suggests that demand for reliable employees is at its peak at times that the economic conditions are at their worst. On the other hand, at strong economic conditions employers’ attention is focused on meeting consumer demands (Markham, 1985). What this serves to suggest is that firms during recessions are keener to lay-off absence-prone workers, thus these workers would be the first to lose their jobs during economic downturns. The supply driven path, called ‘worker disciplinary effect’ (Shapiro and Stiglitz, 1984) is based on the concept that the costs of being fired are positively related to the levels of unemployment. In particular, the higher the levels of unemployment are, the higher would be the period that someone might remain unemployed without income in the case of a lay off. Therefore, the threat of being fired is positively related to unemployment, and unemployment is negatively related to absenteeism. On a related matter, Boone and van Ours (2006) find a pro-cyclical variation in the reported workplace accidents. They argue that reporting an accident has an adverse effect on the worker’s reputation and raises the probability of a lay-off. Therefore, workers are less likely to report an accident when unemployment is high, because in economic downturn the cost of being fired is higher as employment opportunities are limited. On the contrary, the reporting rate of workplace accidents is higher when the unemployment rate is lower. From the work discipline model the following predictions could also be made (Dragon and Wooden, 1992): 1) absence will decrease as wages or working conditions increase; 2) absence will increase as non-labour income increases; and 3) absence will increase as alternative employment opportunities improve.
In addition, there are also a number of institutional factors that have been found to affect individual absenteeism. Such factors include: generosity of sickness benefits; and employment protection. To start
[4]
with, the existence of sickness benefits is likely to act as an incentive for workers to be absence from work. Of course, this is subject to the assumption that employees might decide to stay away from work for leisure rather than actual sickness. Nevertheless, this might also affect the threshold of sickness that each employee sets for absenteeism. This positive relationship between absenteeism and sickness benefits has been confirmed by various studies (e.g. Dunn and Youngblood, 1986; Puhani and Sonderhof, 2010). Employment protection also affects employees’ effort choices. In particular, the existence of high firings costs might increase the incentives of workers to stay away from work. On the other hand, in instances that hiring and firing is easy workers might be reluctant to be absent. At an empirical level, employment protection is often measured on the basis of the type of contract; fixed-term or permanent. For instance, Engellandt and Riphahn (2005) find that employees on a fixed-contract basis have a lower probability of absenteeism than those in permanent contracts. However, the above relationships are empirical phenomena and there are instances that these are not found to exist (Frick and Malo, 2008).
Finally, demographic characteristics are also found to be significant determinants of absenteeism (Drago and Wooden, 1992). In general, absenteeism is observed at a higher level among: females; singles; blue collar workers; low educated employees, as well as those working shifts and those having tenure contracts. Finally, absenteeism is positively related to age.
3. Empirical Method and Data
This study makes use of a pooled micro-level dataset from the European Union’s Labour Force Survey
(LFS) covering 26 European Union countries1. For the purpose of the descriptive analysis data from all
four quarters for the years 2004-2006 are used, while in the regression analysis, and for computational reasons, the focus is on the most recent year, 2006. The LFS is a household sample-survey that is designed to obtain labour market information on individuals residing in a particular country. Thus, people who work in a country but reside in a different one (which is quite often in small countries, i.e. Luxemburg) are excluded from the analysis. The LFS collects information on eight broad areas. These include: general demographic characteristics, the labour market status of individuals, information on the first job (if in employment), information on flexible working patterns (if in employment), information on the second job (if in multiple-job holding), information of previous employment (if any), methods for looking for a job (if unemployed), and information on the education of the individual. This study is particularly interested
1 Austria, Belgium, Bulgaria, Cyprus, Czech Republic, Denmark, Estonia, Finland, France, Germany, Greece, Hungary, Ireland, Italy, Latvia, Lithuania, the Netherlands, Norway, Poland, Portugal, Romania, Slovakia, Slovenia, Spain, Sweden, and the UK.
[5]
on data covering those who are in employment and focuses on questions regarding sick absence from the main job. In particular, the EU-LFS asks individuals, whose hours of work during the week of the survey were different to their usual hours of work, to provide the main reason that such happened. Those who reply that this is due to individuals’ own illness, injury or temporary disability are considered to be in sick absence.
The LFS is conducted at a quarterly basis in each EU member state, and in particular by the individual National Statistical Services. The sample of the survey varies across the members states. Even though it is difficult to achieve perfect comparability among countries, the level of comparability of the LFS is quite high due to; the collection of the same information, the use of common definitions and classifications, and the centralized co-ordination by Eurostat. The harmonisation of the variables and definitions in the countries’ LFS makes the EU-LFS one of the most important official micro databases for comparative social research in Europe. The LFS as any sample survey is subject to sampling errors as well as other errors such as mistakes by the interviewers, miscoding, unwillingness to provide valid information etc. Nevertheless, the reliability of the LFS is assured by the sample size and the sampling methods adopted. For a full description of the LFS data see European Commission (2006).
In the literature various alternative methods are proposed to measure both the incidence and duration of
sickness absence. In this study we follow the methodology developed by Barmby et al. (1999) and
employed in several other studies (Barmby et al., 2002, 2004; Ercolani, 2006) where sickness absence ( )
is measured as the ratio of the hours reported absent due to illness ( ) to contracted hours ( ) in the
reference week ( ),
∑ ∑
The EU-LFS collects information on both the usual hours worked per week ( ) and actual hours worked
( ) in during the reference week (the last full week before the interview week). If there is a difference
between actual and usual hours worked, then individuals are asked to provide the main reason for that. Only absences that are due to individuals’ own illness, injury or temporary disability are considered as sickness absence. Therefore, absence hours are measured as
[6]
where 1 if the absence is due to illness, and 0 otherwise. Furthermore, in line with Barmby et
al. (2002), and due to the lack of specific information on contracts, contracted hours are measured by
actual hours worked if there is no sickness absence in the reference week and by usual hours if the individual was absent due to illness
1
4. Trends in Sickness Absence
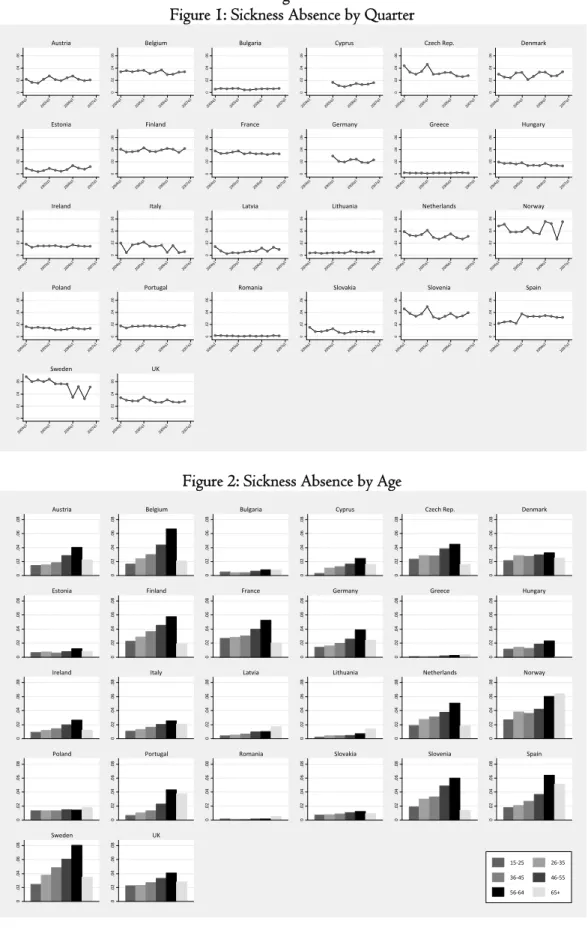
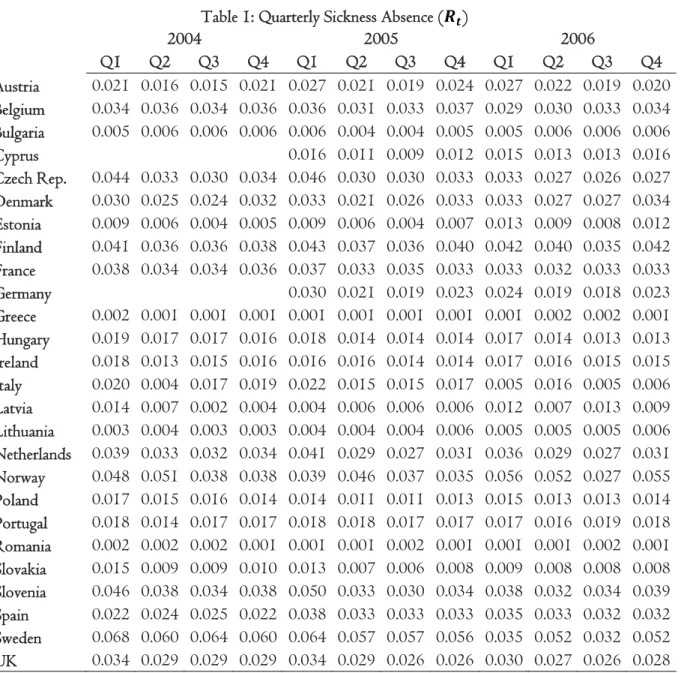
The distribution of sickness absence by country, season, age, gender, tenure, industry and occupation are plotted in figures and presented here in order to highlight some overall patterns that govern the incidence of absenteeism across the 26 European countries. The quarterly sickness absence rate ( ) for each of these
countries for the years 2004-2006 is provided in Table 1 and the figures are plotted in Figure 12.
Regarding, the overall patterns of international absenteeism, one can observe that there is variation in the sickness absence ratio across the European countries. On one end of the spectrum are the Scandinavian countries with sickness absence rate above 4%, and on the other end one finds many Eastern European and Balkan countries, like Bulgaria, Estonia, Greece, Latvia, Lithuania, Romania, and Slovakia with sickness absence rate below 1%. Labour supply characteristics, insurance provisions and labour market institutions may shed some light over these differences as suggested by Bonato and Lusinyan (2004). Higher labour market participation, and particularly female labour market participation, and more generous sickness and unemployment insurance systems are associated with higher levels of sickness absence.
[Table 1 here]
Another interesting pattern one can observe is the seasonal variation of sickness absence within countries. Particularly, in the winter and autumn months (first and fourth quarter) absence rates are higher than in the spring and summer months (second and third quarter). This is more evident in Austria, Denmark, Estonia, Germany, Netherlands, Slovenia and the UK.
[7]
[Figure 1 here]
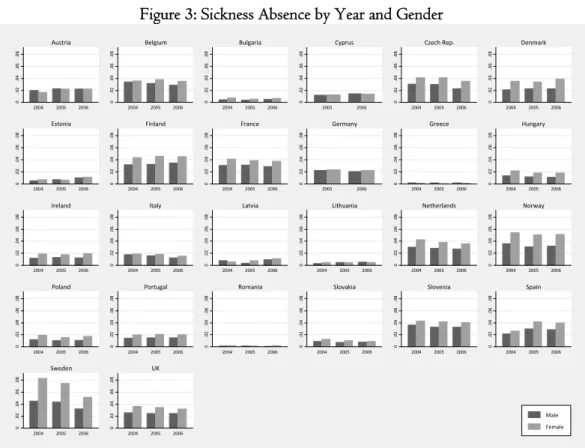
In almost all countries, sickness absence increases monotonically with age up to the age of retirement (Figure 2). A pattern that may be explained partly by the positive correlation between age and illness. Interestingly, the 65 and over age group exhibits notably lower absence rate. One plausible explanation may be that on average it is those with good health who remain in the labour market after the retirement age. As Ercolani (2006) argues, the individuals who have low propensity for illness and a high propensity for attendance are more likely to work beyond the statutory retirement age and their low propensity for absence becomes more evident when observing only the post-retirement sample of workers.
[Figure 2 here]
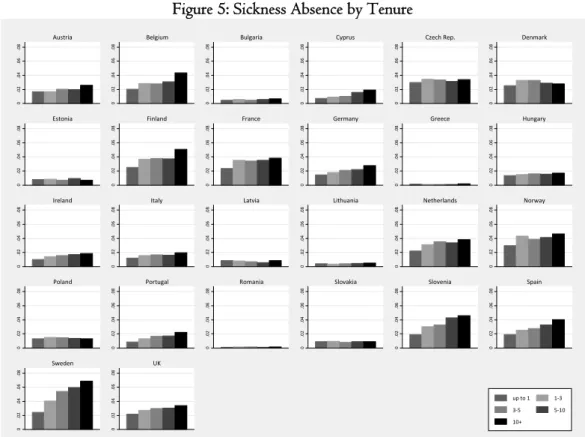
As shown in Figure 3, women workers almost universally exhibit higher sickness absence than men. A plausible explanation may be that their increased household responsibilities and childbearing role have a detrimental effect on their health. The observed gender patterns are also verified when examining the absence rate between male and female workers by age cohorts (Figure 4), where again women exhibit greater sickness absence than men, particularly when they are at the family-forming stage of 26-35 years-old (evident in Czech Rep., Denmark, France, Hungary, Ireland, the Netherlands, Norway and Slovenia).
[Figures 3 & 4 here]
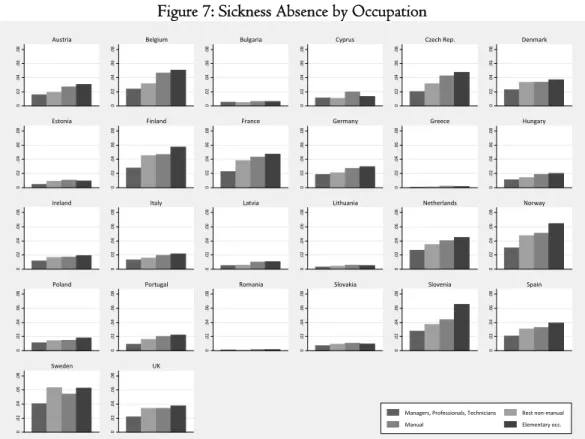
In Figure 5 the sickness absence rates are presented by tenure for all 26 countries. In most countries, absence increases almost monotonically with job-tenure. Seniority may be accompanied with increased job responsibilities; therefore individuals may experience higher levels of stress and job-related pressure that
may have a detrimental effect on health. Furthermore, as Barmby et al. (2002) argue this may also be due
to a job security effect or an age effect. According to the former, employees with longer accumulated job tenure may regard their jobs as more secure, therefore exhibit higher absenteeism compared to junior counterparts. Also, tenure is positively correlated with age, and, as become apparent in Figure 2, sickness absence increases with age.
[8]
The sector breakdown between agriculture, industry (manufacturing) and services in Figure 6 reveals that there are notable differences however there is variation in the observed patterns across countries to make overall conclusive comments. Finally, the absence rates by occupational groups in Figure 7 suggest that sickness absence is higher in occupations that have a lower degree of responsibility in the workplace and that may be more physically demanding.
[Figures 6 & 7 here] 5. Regression Analysis
The discussion above outlined some important patterns that govern the level of sickness absence. These patterns are further explored in this section where an individuals’ sickness absence equation is estimated using regression analysis. Although estimating a sickness absence equation separately for each country may reveal interesting cross-country differences, these trends are already identified in section 4. The interest here is to utilise the institutional and societal differences across countries in order to highlight their importance in determining absenteeism and to draw attention to related policy issues. While the within-country across time variation in the corresponding macro variables of interest is not sufficient to enable the authors to identify their effect on absenteeism, their cross-country variance is large enough to allow that. Therefore for the purpose of the regression analysis, the sickness absence model is estimated on a pooled country sample, where the sample is restricted in year 2006 and to those countries that recorded a sickness
absence rate ( ) of no less than one percent3.
The dependent variable here is based on the individual’s absence ⁄ , where are the hours
reported absent due to illness and the contracted hours in the reference week. In order to estimate the determinants of the proportion of contracted hours lost due to sickness absence, a log-odds transformation
is employed4 in which the proportion becomes ln ⁄ 1 . To include the extreme values of
zero and one, following convention, a very small number (arbitrarily set at 0.00001) is added to them. The advantage of this log-odds transformation is that it ensures that predictions of remain within the
3 As a result of this restriction, seven countries (Bulgaria, Estonia, Greece, Latvia, Lithuania, Romania and Slovakia) are excluded. Earlier versions of this study did not impose this restriction. In that case, the overall trends share similarities with the results presented here, but the significance of the findings was weaker.
4 This is a methodology commonly employed in the labour absence literature (Allen, 1981; Kenyon and Dawkins, 1989; Drago and Wooden, 1992; Barmby et al., 2002; Heywood and Jirjahn, 2004; Heywood et al., 2008).
[9]
original zero-one range, while the transformed values range from minus infinity to positive infinity. The absence rate equation can then be written as
ln ⁄ 1 ′
where 5 is the vector of coefficients, and is the vector of independent explanatory variables that
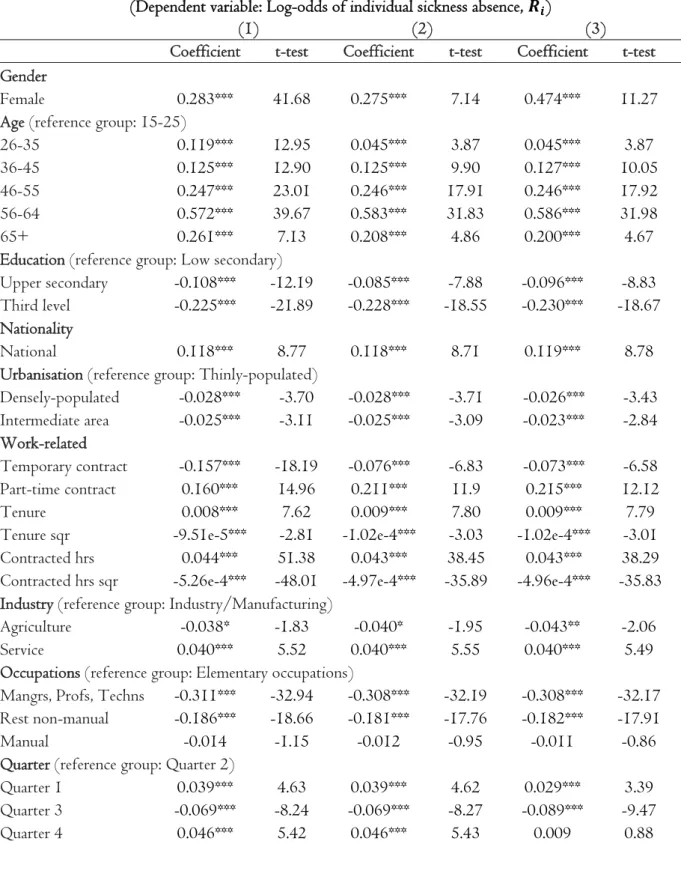
contains personal characteristics, work-related attributes, regional and seasonal information. [Table 2 here]
The estimates overall verify the patterns observed in the figures above (Table 2). In line with other evidence in the literature, female workers have significantly higher sickness absence. Absence rate increases monotonically with age up to the retirement. The rate is significantly lower for those who remain in the labour market post-retirement; a finding that may be driven by the lower propensity of sickness of that selected sample. Individuals with lower levels of education appear to have higher sickness absence.
Nationals, citizens of the country of residence6, are estimated to have higher propensity to sickness. In part
this may be explained by the fact that the nationals may have higher level of familiarity with the structure of the labour market, a better knowledge of their statutory rights and may also be more eligible than non-nationals to receive sickness benefits.
Individuals in more rural areas exhibit higher propensity to sickness, maybe because they are involved in more labour intensive activities. Furthermore, individuals in temporary contracts, who enjoy lower overall employment protection and job security, are less sickness prone compared to those in permanent contracts. The opposite is true for those in part-time employment, where their absence rate is significantly higher compared to those in full-time employment. If individuals with high propensity to sickness are more likely to have a part-time employment, then the link between absence rate and type of contract may be explained by unobserved characteristics selection effect. The estimates also reveal a link between tenure and sickness. Sickness absence rate is modelled as a quadratic function of tenure, suggesting an inverse “U-shaped”
5 The marginal effect of on can be derived by ∆ 1 ∆ , where the coefficient of interest is multiplied by the mean and its inverse.
6 Citizenship in the EU-LFS is defined as the particular legal bond between an individual and his/her State acquired by birth or naturalisation, whether by declaration, option, marriage or other means according to national legislation. It corresponds to the country issuing the passport.
[10]
profile. In addition, the rate of sickness absence appears to increase with contracted hours of work and then falls again. If sickness absence is regarded as a mechanism to adjust labour supply, then one would expect the absence rate to increase monotonically with the level of contracted hours. A candidate explanation of
the downward slopping segment offered by Barmby et al. (2004) is that it may be driven by unobserved
individual characteristics, since it is the people with low propensity to sickness that may choose to work longer hours. Those employed in the service sector appear to have higher absence rate, compared to their counterparts in the industry/manufacturing sector. In addition, white-collar workers exhibit lower propensity to absence compared to blue-collar workers. Finally, the sickness absence is found to exhibit seasonal cyclicality, with low rates during the second and third quarter and high rates in the first and fourth quarter.
In order to further explore the gender differences in the sickness absence, the basic model is re-estimated with the inclusion of interaction terms between the female dummy variable and controls for age, education, temporary contract, part-time contract, and contracted hours (specification 2). The gender-age interaction terms suggest that it is the 26-35 age-cohort of female workers that actually exhibits the higher sickness absence. A possible explanation may be that it is during this stage in their life that women form their families and have children that may adversely affect their health. For the other age cohorts no significant differences are estimated between men and women. Regarding the gender-education differences, the estimates highlight that it is the female workers with upper secondary education that exhibit lower sickness absence rate. A finding that may reflect a more career-oriented behaviour and higher commitment to the labour market. No other significant gender differences are observed among the other educational groups. Women with temporary or part-time contracts exhibit lower sickness absence compared to men in similar contractual agreements. If female workers choose part-time or temporary jobs in order to maintain some flexibility and achieve the preferred work-life balance, then absenteeism, as a labour adjusting mechanism, is expected to be lower. Finally, the contracted-hours sickness absence profile is calculated to be steeper for the female workers compared to male workers.
Although part of the cross-country institutional and societal effects may be captured by the country dummy variables, this is not very informative as it does not directly relate to specific labour market conditions. For that reason, the sickness absence model is re-estimated with the inclusion of five additional variables that may capture aspects of the institutional and societal framework (specification 3). The extra
[11]
variables considered are: (1) dependency ratio, (2) lagged quarterly unemployment rate, (3) life expectancy, (4) statutory retirement age, and (5) female labour market participation.
Starting with the dependency ratio7, this is an age-population ratio of those typically not in the labour
force (aged 0-14 and over 65) and those in the labour force (aged 15-64). The finding suggests that the higher the dependency ratio, the lower the sickness absence ratio. A large dependency ratio can be considered to impose pressure to employed people to produce/provide to their households and the greater economy, and thus may deter individuals from becoming absent from work. Lagged quarterly
unemployment rate8 is used in order to capture the cyclicality of absenteeism. In line with the literature
(Leigh, 1985; Shapiro and Stiglitz, 1984), the findings show an inverse relationship between absenteeism and unemployment, suggesting that the sickness absence is pro-cyclical. A demand-side scenario would suggest that accident-prone individuals are being laid off during periods of economic downturn, whereas selection criteria are relaxed during periods of economic expansion in order to meet the increasing demand. A supply-side story would focus on the reputation effect of sickness absence and the associated increased probability of a lay off. In that case, when employment opportunities are limited, unemployment acting as a discipline mechanism, results to a lower incidence of sickness absence.
Life expectancy9, a proxy for the quality of health services and an indicator of population health and overall
well-being, as expected, is estimated to be associated with lower rates of sickness absence. This serves to indicate that improving healthcare systems across Europe may lead to lower rates from absence from work.
Turning to the statutory retirement age10 the findings suggest that the higher the pensionable age (i.e. the
more time individuals are required to spend in the labour market), the higher chances of absenteeism. In light of the recent trends regarding the extension of the statutory pensionable age, this finding highlights the detrimental effect that prolonging the exit to retirement may have on health and well-being. Finally,
wider female labour market participation rate11 is found to have a positive effect on the sickness absence
rate. One interpretation suggested in the literature (Bliksvär and Helliesen, 1997) is that in labour markets with low female participation rates, the women who are engaged in the workforce are less absent-prone and
7 Source: United Nations, Department of Economic and Social Affairs, Population Division, World Population Prospects: The 2004 Revision Population Database, available at http://esa.un.org/unpp.
8 Source: EUROSTAT.
9 Source: EUROSTAT based on EU-SILC 2005, Italy figures for life expectancy at birth in 2005 are estimates based on the European Health Expectancy Monitoring Unit (EHEMU).
10 Source: United Nations, Department of Economic and Social Affairs, Population Division, World Population Prospects: The 2004 Revision Population Database , available at http://esa.un.org/unpp
[12]
more career-oriented. However, when considering the interaction effect between female and female labour market participation (results not reported here), the findings did not reveal any gender differences. An alternative explanation may be that the increased female labour market participation affects the division of household labour that consequently may be reflected in the sickness absence incidences of both male and female individuals.
6. Concluding Remarks
Absenteeism is a complex labour market behaviour, predominantly regarded and studied as a labour supply decision. A number of studies in the literature have also highlight the importance of institutional arrangements and the pro-cyclical nature of absenteeism, with the recorded incidence of sickness absence being lower in periods of economic downturn. This study, using the EU-LFS, examines the main factors that explain the levels of recorded sickness absence rate in EU countries. The novelty of this research, compared to other cross-country studies, lies on three features: (1) country coverage, (2) data harmonisation and (3) homogeneity of sample. To the authors’ knowledge, no other existing study shares all three characteristics. The utilisation of the EU-LFS enables the authors to address the issue at an individual level and therefore explore the role of demographic and workplace characteristics, while the multinational dimension of the dataset permits the identification of institutional and societal differences that may be important in explaining the different patterns observed in the sickness absence behaviour. Many important findings emerge from the analysis that have direct policy implications. Female individuals, specifically those in the 26-35 age cohort, exhibit higher sickness absence rates, compared to other female and all male workers. If this is driven by the increased household and childbearing responsibilities they may have, then the introduction of family-friendly policies such as flexible leave, childcare support and school term-time leave may provide support and ease some of the pressure that this part of the labour workforce experiences. In addition, the dependency ratio, an age-population ratio of those not in the labour force and those in the labour force, is estimated to be negatively related to the reported sickness absence ratio, as a result probably of the pressure employed people experience to provide to their households. In light of the ageing population trend in the EU and the exit of the baby boomers to retirement, the dependency ratio is likely to worsen having direct implications on the labour market active part of the population. Policy makers need to consider these demographic trends and design policies that will alleviate the increasing pressure the working population may feel. Finally, the findings highlight the effect of job insecurity, as captured by temporary employment contracts, and labour market uncertainty, reflected in the
[13]
unemployment rate, on the level of sickness absence. Recorded absenteeism is lower among individuals with temporary contracts and in periods of high unemployment, highlighting the relative pressure individuals may feel either due to lack of job stability or due to the economic downturn. The increased labour market flexibility in the European labour markets and the current economic recession warrant labour market policies that will identify those vulnerable groups, and safeguard their income, employment and health.
References
Allen, S. (1981). Compensation, Safety, and Absenteeism: Evidence from the Paper Industry. Industrial
and Labor Relations Review, 34, 207–218.
Audas, R., and J. Treble. (2001). “Household Work and Market Work: Towards a New Theory of
Worker Absenteeism.” In The Expansion of Economics Towards a More Inclusive Social Science,
edited by S. Grossbard-Schechtman and C. Clague, 140–161.
Barmby, T.A., M.G. Ercolani, and J.G. Treble (1999). Sickness Absence in Britain: New Quarterly and
Annual Series from the GHS and the LFS 1971-1997. Labour Market Trends, August, 405-415.
Barmby, T.A., M.G. Ercolani, and J.G. Treble (2002). Sickness Absence: An International Comparison.
Economic Journal, 112, F315-F331.
Barmby, T.A., M.G. Ercolani, and J.G. Treble (2004). Sickness Absence in the UK: 1984-2002. Swedish
Economic Policy Review, 11, 65–88.
Bliksvär, T. and A. Helliesen (1997). Sickness absence: a study of 11 LES countries. NOVA (Norwegian Social Research), mimeo.
Bonato, L. and L. Lusinyan (2004). Work Absence in Europe. IMF Working Paper No. 04/193.
Boone, J. and C.J. van Ours (2006). Are Recessions Good for Workplace Safety? Journal of Health
Economics, 25, 1069-1093.
Brown, S. (1994). Dynamic Implications of Absence Behaviour. Applied Economics, 26, 1163-1175
Drago, R. and M. Wooden (1992). The Determinants of Labor Absence: Economic Factors and
Workgroup Norms across Countries. Industrial and Labor Relations Review, 45, 764-778.
Dunn, L. F., and S.A. Youngblood (1986). Absenteeism as a Mechanism for Approaching an Optimal
[14]
Engellandt, A. and R.T. Riphahn (2005). Temporary Contracts and Employee Effort. Labour Economics,
12, 281–299.
Ercolani, M.G. (2006). UK Employees' Sickness Absence: 1984-2005. Discussion Papers 06-02, Department of Economics, University of Birmingham.
EUROSTAT (2006). EU Labour Force Survey database User guide.
Frick, B. and M. Malo (2008). Labor Market Institutions and Individual Absenteeism in the European Union: The Relative Importance of Sickness Benefit Systems and Employment Protection Legislation,
Industrial Relations, 47, 505-529.
Gründemann, R.W.M. and C.V. Vuuren (1997). Preventing Absenteeism at the Workplace (European research report), European Foundation for the Improvement of Working and Living Conditions, Dublin.
Heywood, J.S. and U. Jirjahn (2004). Teams, Teamwork and Absence. Scandinavian Journal of
Economics, 106, 765-782.
Heywood, J.S., U. Jirjahn, and X. Wei (2008). Teamwork, Monitoring and Absence. Journal of Economic
Behavior & Organization, 68, 676-690.
Kenyon, P., and P. Dawkins (1989). A Time Series Analysis of Labour Absence in Australia. The Review
of Economics and Statistics, 71, 232-239.
Leigh, J.P. (1985). The Effects of Unemployment and the Business Cycle on Absenteeism. Journal of
Economics and Business, 37, 159–170.
Markham, S.E. (1985). An Investigation of the Relationship between Unemployment and the
Absenteeism: a Multi-Level Approach, Academy of Management Journal, 28, 229-234.
OECD (2003). The Sources of Economic Growth in OECD countries, OECD, Paris.
Puhani, P.A. and K. Sonderhof (2010). The Effects of a Sick Pay Reform on Absence and on
Health-Related Outcomes. Journal of Health Economics, forthcoming.
Shapiro, C., and J. Stiglitz (1984). Equilibrium Unemployment as a Worker Discipline Device. American
[15]
Figures
Figure 1: Sickness Absence by Quarter
Figure 2: Sickness Absence by Age
0 .02 .04 .06 2004q 1 2005 q1 2006 q1 2007q1 Austria 0 .02 .04 .06 2004q 1 2005q 1 2006q 1 2007 q1 Belgium 0 .02 .04 .06 2004q1 2005q 1 2006q 1 2007q 1 Bulgaria 0 .02 .04 .06 2004 q1 2005q1 2006q1 2007q 1 Cyprus 0 .02 .04 .06 2004q 1 2005q 1 2006 q1 2007q1 Czech Rep. 0 .02 .04 .06 2004q 1 2005q 1 2006q 1 2007q 1 Denmark 0 .02 .04 .06 2004q 1 2005 q1 2006 q1 2007 q1 Estonia 0 .02 .04 .06 2004q 1 2005q 1 2006q 1 2007 q1 Finland 0 .02 .04 .06 2004 q1 2005q 1 2006q 1 2007q 1 France 0 .02 .04 .06 2004 q1 2005 q1 2006 q1 2007q 1 Germany 0 .02 .04 .06 2004q 1 2005q 1 2006 q1 2007 q1 Greece 0 .02 .04 .06 2004q 1 2005q 1 2006q 1 2007q 1 Hungary 0 .02 .04 .06 2004 q1 2005 q1 2006 q1 2007 q1 Ireland 0 .02 .04 .06 2004 q1 2005 q1 2006 q1 2007 q1 Italy 0 .02 .04 .06 2004 q1 2005 q1 2006 q1 2007 q1 Latvia 0 .02 .04 .06 2004 q1 2005 q1 2006 q1 2007 q1 Lithuania 0 .02 .04 .06 2004 q1 2005 q1 2006 q1 2007 q1 Netherlands 0 .02 .04 .06 2004 q1 2005 q1 2006 q1 2007 q1 Norway 0 .02 .04 .06 2004 q1 2005 q1 2006 q1 2007 q1 Poland 0 .02 .04 .06 2004 q1 2005 q1 2006 q1 2007 q1 Portugal 0 .02 .04 .06 2004 q1 2005 q1 2006 q1 2007 q1 Romania 0 .02 .04 .06 2004 q1 2005 q1 2006 q1 2007 q1 Slovakia 0 .02 .04 .06 2004 q1 2005 q1 2006 q1 2007 q1 Slovenia 0 .02 .04 .06 2004 q1 2005 q1 2006 q1 2007 q1 Spain 0 .02 .04 .06 2004 q1 2005 q1 2006 q1 2007 q1 Sweden 0 .02 .04 .06 2004 q1 2005q1 2006 q1 2007 q1 UK 0 .02 .04 .06 .08 Austria 0 .02 .04 .06 .08 Belgium 0 .02 .04 .06 .08 Bulgaria 0 .02 .04 .06 .08 Cyprus 0 .02 .04 .06 .08 Czech Rep. 0 .02 .04 .06 .08 Denmark 0 .02 .04 .06 .08 Estonia 0 .02 .04 .06 .08 Finland 0 .02 .04 .06 .08 France 0 .02 .04 .06 .08 Germany 0 .02 .04 .06 .08 Greece 0 .02 .04 .06 .08 Hungary 0 .02 .04 .06 .08 Ireland 0 .02 .04 .06 .08 Italy 0 .02 .04 .06 .08 Latvia 0 .02 .04 .06 .08 Lithuania 0 .02 .04 .06 .08 Netherlands 0 .02 .04 .06 .08 Norway 0 .02 .04 .06 .08 Poland 0 .02 .04 .06 .08 Portugal 0 .02 .04 .06 .08 Romania 0 .02 .04 .06 .08 Slovakia 0 .02 .04 .06 .08 Slovenia 0 .02 .04 .06 .08 Spain 0 .02 .04 .06 .08 Sweden 0 .02 .04 .06 .08 UK 15‐25 26‐35 36‐45 46‐55 56‐64 65+
[16]
Figure 3: Sickness Absence by Year and Gender
Figure 4: Sickness Absence by Age and Gender
0 .02 .04 .06 .08 2004 2005 2006 Austria 0 .02 .04 .06 .08 2004 2005 2006 Belgium 0 .02 .04 .06 .08 2004 2005 2006 Bulgaria 0 .02 .04 .06 .08 2005 2006 Cyprus 0 .02 .04 .06 .08 2004 2005 2006 Czech Rep. 0 .02 .04 .06 .08 2004 2005 2006 Denmark 0 .02 .04 .06 .08 2004 2005 2006 Estonia 0 .02 .04 .06 .08 2004 2005 2006 Finland 0 .02 .04 .06 .08 2004 2005 2006 France 0 .02 .04 .06 .08 2005 2006 Germany 0 .02 .04 .06 .08 2004 2005 2006 Greece 0 .02 .04 .06 .08 2004 2005 2006 Hungary 0 .02 .04 .06 .08 2004 2005 2006 Ireland 0 .02 .04 .06 .08 2004 2005 2006 Italy 0 .02 .04 .06 .08 2004 2005 2006 Latvia 0 .02 .04 .06 .08 2004 2005 2006 Lithuania 0 .02 .04 .06 .08 2004 2005 2006 Netherlands 0 .02 .04 .06 .08 2004 2005 2006 Norway 0 .02 .04 .06 .08 2004 2005 2006 Poland 0 .02 .04 .06 .08 2004 2005 2006 Portugal 0 .02 .04 .06 .08 2004 2005 2006 Romania 0 .02 .04 .06 .08 2004 2005 2006 Slovakia 0 .02 .04 .06 .08 2004 2005 2006 Slovenia 0 .02 .04 .06 .08 2004 2005 2006 Spain 0 .02 .04 .06 .08 2004 2005 2006 Sweden 0 .02 .04 .06 .08 2004 2005 2006 UK Male Female 0 .02 .04 .06 .08 .1 15‐2526‐3536‐4546‐5556‐64 65+ Austria 0 .02 .04 .06 .08 .1 15‐2526‐3536‐4546‐5556‐64 65+ Belgium 0 .02 .04 .06 .08 .1 15‐2526‐3536‐4546‐5556‐64 65+ Bulgaria 0 .02 .04 .06 .08 .1 15‐2526‐3536‐4546‐5556‐64 65+ Cyprus 0 .02 .04 .06 .08 .1 15‐2526‐3536‐4546‐5556‐64 65+ Czech Rep. 0 .02 .04 .06 .08 .1 15‐2526‐3536‐4546‐5556‐64 65+ Denmark 0 .02 .04 .06 .08 .1 15‐2526‐3536‐4546‐5556‐64 65+ Estonia 0 .02 .04 .06 .08 .1 15‐2526‐3536‐4546‐5556‐64 65+ Finland 0 .02 .04 .06 .08 .1 15‐2526‐3536‐4546‐5556‐64 65+ France 0 .02 .04 .06 .08 .1 15‐2526‐3536‐4546‐5556‐64 65+ Germany 0 .02 .04 .06 .08 .1 15‐2526‐3536‐4546‐5556‐64 65+ Greece 0 .02 .04 .06 .08 .1 15‐2526‐3536‐4546‐5556‐64 65+ Hungary 0 .02 .04 .06 .08 .1 15‐2526‐3536‐4546‐5556‐64 65+ Ireland 0 .02 .04 .06 .08 .1 15‐2526‐3536‐4546‐5556‐64 65+ Italy 0 .02 .04 .06 .08 .1 15‐2526‐3536‐4546‐5556‐64 65+ Latvia 0 .02 .04 .06 .08 .1 15‐2526‐3536‐4546‐5556‐64 65+ Lithuania 0 .02 .04 .06 .08 .1 15‐2526‐3536‐4546‐5556‐64 65+ Netherlands 0 .02 .04 .06 .08 .1 15‐2526‐3536‐4546‐5556‐64 65+ Norway 0 .02 .04 .06 .08 .1 15‐2526‐3536‐4546‐5556‐64 65+ Poland 0 .02 .04 .06 .08 .1 15‐2526‐3536‐4546‐5556‐64 65+ Portugal 0 .02 .04 .06 .08 .1 15‐2526‐3536‐4546‐5556‐64 65+ Romania 0 .02 .04 .06 .08 .1 15‐2526‐3536‐4546‐5556‐64 65+ Slovakia 0 .02 .04 .06 .08 .1 15‐2526‐3536‐4546‐5556‐64 65+ Slovenia 0 .02 .04 .06 .08 .1 15‐2526‐3536‐4546‐5556‐64 65+ Spain 0 .02 .04 .06 .08 .1 15‐2526‐3536‐4546‐5556‐64 65+ Sweden 0 .02 .04 .06 .08 .1 15‐2526‐3536‐4546‐5556‐64 65+ UK Male Female
[17]
Figure 5: Sickness Absence by Tenure
Figure 6: Sickness Absence by Industry
0 .02 .04 .06 .08 Austria 0 .02 .04 .06 .08 Belgium 0 .02 .04 .06 .08 Bulgaria 0 .02 .04 .06 .08 Cyprus 0 .02 .04 .06 .08 Czech Rep. 0 .02 .04 .06 .08 Denmark 0 .02 .04 .06 .08 Estonia 0 .02 .04 .06 .08 Finland 0 .02 .04 .06 .08 France 0 .02 .04 .06 .08 Germany 0 .02 .04 .06 .08 Greece 0 .02 .04 .06 .08 Hungary 0 .02 .04 .06 .08 Ireland 0 .02 .04 .06 .08 Italy 0 .02 .04 .06 .08 Latvia 0 .02 .04 .06 .08 Lithuania 0 .02 .04 .06 .08 Netherlands 0 .02 .04 .06 .08 Norway 0 .02 .04 .06 .08 Poland 0 .02 .04 .06 .08 Portugal 0 .02 .04 .06 .08 Romania 0 .02 .04 .06 .08 Slovakia 0 .02 .04 .06 .08 Slovenia 0 .02 .04 .06 .08 Spain 0 .02 .04 .06 .08 Sweden 0 .02 .04 .06 .08 UK up to 1 1‐3 3‐5 5‐10 10+ 0 .02 .04 .06 Austria 0 .02 .04 .06 Belgium 0 .02 .04 .06 Bulgaria 0 .02 .04 .06 Cyprus 0 .02 .04 .06 Czech Rep. 0 .02 .04 .06 Denmark 0 .02 .04 .06 Estonia 0 .02 .04 .06 Finland 0 .02 .04 .06 France 0 .02 .04 .06 Germany 0 .02 .04 .06 Greece 0 .02 .04 .06 Hungary 0 .02 .04 .06 Ireland 0 .02 .04 .06 Italy 0 .02 .04 .06 Latvia 0 .02 .04 .06 Lithuania 0 .02 .04 .06 Netherlands 0 .02 .04 .06 Norway 0 .02 .04 .06 Poland 0 .02 .04 .06 Portugal 0 .02 .04 .06 Romania 0 .02 .04 .06 Slovakia 0 .02 .04 .06 Slovenia 0 .02 .04 .06 Spain 0 .02 .04 .06 Sweden 0 .02 .04 .06 UK Agriculture Industry Services
[18]
Figure 7: Sickness Absence by Occupation
0 .02 .04 .06 .08 Austria 0 .02 .04 .06 .08 Belgium 0 .02 .04 .06 .08 Bulgaria 0 .02 .04 .06 .08 Cyprus 0 .02 .04 .06 .08 Czech Rep. 0 .02 .04 .06 .08 Denmark 0 .02 .04 .06 .08 Estonia 0 .02 .04 .06 .08 Finland 0 .02 .04 .06 .08 France 0 .02 .04 .06 .08 Germany 0 .02 .04 .06 .08 Greece 0 .02 .04 .06 .08 Hungary 0 .02 .04 .06 .08 Ireland 0 .02 .04 .06 .08 Italy 0 .02 .04 .06 .08 Latvia 0 .02 .04 .06 .08 Lithuania 0 .02 .04 .06 .08 Netherlands 0 .02 .04 .06 .08 Norway 0 .02 .04 .06 .08 Poland 0 .02 .04 .06 .08 Portugal 0 .02 .04 .06 .08 Romania 0 .02 .04 .06 .08 Slovakia 0 .02 .04 .06 .08 Slovenia 0 .02 .04 .06 .08 Spain 0 .02 .04 .06 .08 Sweden 0 .02 .04 .06 .08 UK
Managers, Professionals, Technicians Rest non‐manual Manual Elementary occ.
[19] Tables
Table 1: Quarterly Sickness Absence ( )
2004 2005 2006 Q1 Q2 Q3 Q4 Q1 Q2 Q3 Q4 Q1 Q2 Q3 Q4 Austria 0.021 0.016 0.015 0.021 0.027 0.021 0.019 0.024 0.027 0.022 0.019 0.020 Belgium 0.034 0.036 0.034 0.036 0.036 0.031 0.033 0.037 0.029 0.030 0.033 0.034 Bulgaria 0.005 0.006 0.006 0.006 0.006 0.004 0.004 0.005 0.005 0.006 0.006 0.006 Cyprus 0.016 0.011 0.009 0.012 0.015 0.013 0.013 0.016 Czech Rep. 0.044 0.033 0.030 0.034 0.046 0.030 0.030 0.033 0.033 0.027 0.026 0.027 Denmark 0.030 0.025 0.024 0.032 0.033 0.021 0.026 0.033 0.033 0.027 0.027 0.034 Estonia 0.009 0.006 0.004 0.005 0.009 0.006 0.004 0.007 0.013 0.009 0.008 0.012 Finland 0.041 0.036 0.036 0.038 0.043 0.037 0.036 0.040 0.042 0.040 0.035 0.042 France 0.038 0.034 0.034 0.036 0.037 0.033 0.035 0.033 0.033 0.032 0.033 0.033 Germany 0.030 0.021 0.019 0.023 0.024 0.019 0.018 0.023 Greece 0.002 0.001 0.001 0.001 0.001 0.001 0.001 0.001 0.001 0.002 0.002 0.001 Hungary 0.019 0.017 0.017 0.016 0.018 0.014 0.014 0.014 0.017 0.014 0.013 0.013 Ireland 0.018 0.013 0.015 0.016 0.016 0.016 0.014 0.014 0.017 0.016 0.015 0.015 Italy 0.020 0.004 0.017 0.019 0.022 0.015 0.015 0.017 0.005 0.016 0.005 0.006 Latvia 0.014 0.007 0.002 0.004 0.004 0.006 0.006 0.006 0.012 0.007 0.013 0.009 Lithuania 0.003 0.004 0.003 0.003 0.004 0.004 0.004 0.006 0.005 0.005 0.005 0.006 Netherlands 0.039 0.033 0.032 0.034 0.041 0.029 0.027 0.031 0.036 0.029 0.027 0.031 Norway 0.048 0.051 0.038 0.038 0.039 0.046 0.037 0.035 0.056 0.052 0.027 0.055 Poland 0.017 0.015 0.016 0.014 0.014 0.011 0.011 0.013 0.015 0.013 0.013 0.014 Portugal 0.018 0.014 0.017 0.017 0.018 0.018 0.017 0.017 0.017 0.016 0.019 0.018 Romania 0.002 0.002 0.002 0.001 0.001 0.001 0.002 0.001 0.001 0.001 0.002 0.001 Slovakia 0.015 0.009 0.009 0.010 0.013 0.007 0.006 0.008 0.009 0.008 0.008 0.008 Slovenia 0.046 0.038 0.034 0.038 0.050 0.033 0.030 0.034 0.038 0.032 0.034 0.039 Spain 0.022 0.024 0.025 0.022 0.038 0.033 0.033 0.033 0.035 0.033 0.032 0.032 Sweden 0.068 0.060 0.064 0.060 0.064 0.057 0.057 0.056 0.035 0.052 0.032 0.052 UK 0.034 0.029 0.029 0.029 0.034 0.029 0.026 0.026 0.030 0.027 0.026 0.028
[20]
Table 2: Determinants of Sickness Absence
(Dependent variable: Log-odds of individual sickness absence, )
(1) (2) (3)
Coefficient t-test Coefficient t-test Coefficient t-test
Gender
Female 0.283*** 41.68 0.275*** 7.14 0.474*** 11.27
Age (reference group: 15-25)
26-35 0.119*** 12.95 0.045*** 3.87 0.045*** 3.87
36-45 0.125*** 12.90 0.125*** 9.90 0.127*** 10.05
46-55 0.247*** 23.01 0.246*** 17.91 0.246*** 17.92
56-64 0.572*** 39.67 0.583*** 31.83 0.586*** 31.98
65+ 0.261*** 7.13 0.208*** 4.86 0.200*** 4.67
Education (reference group: Low secondary)
Upper secondary -0.108*** -12.19 -0.085*** -7.88 -0.096*** -8.83
Third level -0.225*** -21.89 -0.228*** -18.55 -0.230*** -18.67
Nationality
National 0.118*** 8.77 0.118*** 8.71 0.119*** 8.78
Urbanisation (reference group: Thinly-populated)
Densely-populated -0.028*** -3.70 -0.028*** -3.71 -0.026*** -3.43 Intermediate area -0.025*** -3.11 -0.025*** -3.09 -0.023*** -2.84 Work-related Temporary contract -0.157*** -18.19 -0.076*** -6.83 -0.073*** -6.58 Part-time contract 0.160*** 14.96 0.211*** 11.9 0.215*** 12.12 Tenure 0.008*** 7.62 0.009*** 7.80 0.009*** 7.79
Tenure sqr -9.51e-5*** -2.81 -1.02e-4*** -3.03 -1.02e-4*** -3.01
Contracted hrs 0.044*** 51.38 0.043*** 38.45 0.043*** 38.29
Contracted hrs sqr -5.26e-4*** -48.01 -4.97e-4*** -35.89 -4.96e-4*** -35.83
Industry (reference group: Industry/Manufacturing)
Agriculture -0.038* -1.83 -0.040* -1.95 -0.043** -2.06
Service 0.040*** 5.52 0.040*** 5.55 0.040*** 5.49
Occupations (reference group: Elementary occupations)
Mangrs, Profs, Techns -0.311*** -32.94 -0.308*** -32.19 -0.308*** -32.17
Rest non-manual -0.186*** -18.66 -0.181*** -17.76 -0.182*** -17.91
Manual -0.014 -1.15 -0.012 -0.95 -0.011 -0.86
Quarter (reference group: Quarter 2)
Quarter 1 0.039*** 4.63 0.039*** 4.62 0.029*** 3.39
Quarter 3 -0.069*** -8.24 -0.069*** -8.27 -0.089*** -9.47
Quarter 4 0.046*** 5.42 0.046*** 5.43 0.009 0.88
[21]
Table 2: continued
(1) (2) (3)
Coefficient t-test Coefficient t-test Coefficient t-test
Female interaction terms with Age
26-35 0.170*** 9.23 0.172*** 9.30
36-45 0.013 0.72 0.013 0.70
46-55 0.013 0.66 0.016 0.79
56-64 -0.02 -0.75 -0.027 -1.01
65+ 0.102 1.34 0.118 1.54
Female interaction terms with Education
Upper secondary -0.050*** -3.00 -0.034** -2.01
Third level -0.004 -0.24 -0.009 -0.48
Female interaction terms with:
Temporary contract -0.166*** -10.72 -0.171*** -11.05
Part-time contract -0.080*** -3.65 -0.100*** -4.57
Contracted hrs 0.004** 2.47 0.004** 2.40
Contracted hrs sqr -9.00e-5*** -3.97 -8.77e-5 *** -3.87
Macro variables
Dependency ratio -0.077*** -29.97
Female labour part/tion 0.016*** 15.74
Quarterly unempl. rate -0.039*** -5.57
Life expectancy -0.032*** -9.87
Pensionable age 0.012*** 4.66
Country dummies Yes Yes Yes
Constant -11.879*** -442.49 -11.879*** -380.39 -7.088*** -19.86