All rights reserved
Gulf War Veterans’ Mortality Outcomes Kang and Bullman ORIGINAL CONTRIBUTIONS
Mortality among US Veterans of the Persian Gulf War: 7-Year Follow-up
Han K. Kang and Tim A. Bullman
To assess the long-term health consequences of the 1991 Persian Gulf War, the authors compared cause-specific mortality rates of 621,902 Gulf War veterans with those of 746,248 non-Gulf veterans, by gender, with adjustment for age, race, marital status, branch of service, and type of unit. Vital status follow-up began with the date of exit from the Persian Gulf theater (Gulf veterans) or May 1, 1991 (control veterans). Follow-up for both groups ended on the date of death or December 31, 1997, whichever came first. Cox proportional hazards models were used for the multivariate analysis. For Gulf veterans, mortality risk was also assessed relative to the likelihood of exposure to nerve gas at Khamisiyah, Iraq. Among Gulf veterans, the significant excess of deaths due to motor vehicle accidents that was observed during the earlier postwar years had decreased steadily to levels found in non-Gulf veterans. The risk of death from natural causes remained lower among Gulf veterans compared with non-Gulf veterans. This was mainly accounted for by the relatively higher number of deaths related to human immunodeficiency virus infection among non-Gulf veterans. There was no statistically significant difference in cause-specific mortality among Gulf veterans relative to potential nerve gas exposure. The risk of death for both Gulf veterans and non-Gulf veterans stayed less than half of that expected in their civilian counterparts. The authors conclude that the excess risk of mortality from motor vehicle accidents that was
associated with Gulf War service has dissipated after 7 years of follow-up.Am J Epidemiol 2001;154:399–405.
accidents, traffic; gas poisoning; mortality; Persian Gulf syndrome; veterans
Received for publication July 3, 2000, and accepted for publica-tion March 19, 2001.
Abbreviatons: BIRLS, Beneficiary Identification and Records Locator Subsystem; CI, confidence interval; HIV, human immunode-ficiency virus.
From the Environmental Epidemiology Service, Department of Veterans Affairs, Washington, DC.
Reprint requests to Dr. Han K. Kang, Environmental Epidemiology Service, Department of Veterans Affairs, 1120 20th Street NW, Suite 950, Washington, DC 20036 (e-mail: [email protected]).
Editor’s note: An invited commentary on this article appears on page 406.
During a 1-year period between August 1990 and July 1991, the United States government deployed almost 700,000 troops in the Persian Gulf in response to Iraq’s invasion of Kuwait. An air war against Iraq was initiated in the middle of January 1991. Toward the end of February, a ground war was initiated. Five days after the ground war began, Iraq capitulated, and the war was over by February 28, 1991. Despite the short duration of the war and the rela-tively few combat casualties inflicted upon US troops, con-cern about health consequences related to the war persists to this day. A list of potentially harmful exposures has been evolving for the past decade. It now includes oil fire smoke; chemical and biological warfare agents; prophylactic agents against chemical and biological warfare, such as pyridostig-mine bromide pills and anthrax vaccine; multiple vaccina-tions; depleted uranium; pesticides; endemic infectious
dis-eases; and psychological and physical stresses of deploy-ment (1–3).
In response to increasing concern about the health of Gulf War veterans, the US Departments of Defense and Veterans Affairs initiated an intensive health registry examination program and sponsored numerous health studies (4–6). To date, approximately 100,000 US Gulf veterans have com-pleted the registry physical examination, and more than 145 research projects have been funded and are in varying stages of completion (7).
The published findings from studies of morbidity con-ducted to date include the following. Gulf veterans experi-enced a higher prevalence of numerous symptoms and psy-chological conditions, including posttraumatic stress disorder, than nondeployed veterans (8, 9); many of these symptoms were not explained by any diagnosable disease (10); no single disease was uniquely associated with the Gulf War (10, 11); Gulf veterans who remained on active duty were not hospitalized at a higher rate than nondeployed peers (12); and no higher rate of birth defects was observed among children of Gulf veterans born at military hospitals (13). Many areas of uncertainty remained, including how the health status of Gulf veterans had changed over time.
In parallel with concerns about ill health, there has been a persistent suggestion that Gulf War veterans may have a higher rate of postwar mortality than non-Gulf veterans and that risks of death from certain causes may be especially elevated. Two previous studies reported a consistent pattern
at Florida State University College of Medicine Library on January 24, 2012
http://aje.oxfordjournals.org/
of increased risk of death from accidents, including motor vehicle accidents, among Gulf veterans during the period of deployment and in the 21⁄
2-year period following deploy-ment (14, 15). These studies also showed that rates of mor-tality from disease-related causes were not significantly increased, suggesting that illnesses related to the Gulf War were not life-threatening. As a means of assessing the long-term health consequences of deployment, continued moni-toring of mortality both from diseases with a long latency period and from unintentional injuries will be of significant value.
The current study is a continuation of a postwar mortality study of Gulf veterans (15), extending vital status follow-up for 4 additional years. We also evaluated changing patterns of mortality over almost 7 years of follow-up.
MATERIALS AND METHODS Study subjects
The Gulf War veterans included in the study were limited to those 621,902 veterans who arrived in the Persian Gulf prior to March 1, 1991. This date was chosen in order to exclude individuals who arrived in the Persian Gulf theater after hos-tilities ended and were therefore not likely to have received exposures of concern (chemical and biological warfare agents, vaccination against anthrax or botulism, pyridostigmine bro-mide pills, psychological stresses of combat, etc.). The 746,248 non-Gulf veteran controls consisted of a stratified random sample of all military personnel, including those on active duty, in the reserves, or in the National Guard, who served during the conflict but were not deployed in the Persian Gulf theater. For controls serving in the reserves and the National Guard, equal numbers were selected from units that were activated but not sent to the Persian Gulf and units that were not activated at all. Troops who were sent to the Persian Gulf for the first time after the war ended were excluded from the pool of potential controls prior to sampling.
Demographic/military service characteristics
The Defense Manpower Data Center provided information on demographic and military service-related characteristics for all study veterans. These data included date of birth, race, marital status during the war, gender, military rank, branch of service, deployment date, and type of service unit (active, reserve, or National Guard). Additional data available for Gulf veterans included physical proximity to the munitions depot at Khamisiyah, Iraq, where on March 10, 1991, US troops exploded abandoned Iraqi munitions that contained nerve gas (16–18). Using models developed by the Department of Defense, a total of 48,281 Gulf veterans in the study were identified as likely to have received at least sub-clinical exposure to nerve gas, sarin, and cyclosarin.
An extensive description of the Department of Defense exposure plume model has been provided elsewhere (18). In summary, a panel consisting of numerous nonfederal and federal experts, on the basis of multiple sources of meteoro-logic, munitions, and toxicologic data, circumscribed the geographic areas that contained low-level, vaporized nerve
agent for 4 days after the destruction in March 1991. The geographic areas under the estimated plume were overlaid on military unit positions, and the troops assigned to the units stationed under the plume during those 4 days were identi-fied. The area under the plume would have had nerve agent concentrations above the general population limit (0.0126 mg-minute/m3), which was defined as the dosage below which the general population, including children and the elderly, could endure for at least 72 hours without symptoms. Vital status determination and collection of cause-of-death data
Vital status follow-up for each Gulf War veteran began with the date on which he or she left the Persian Gulf theater. Follow-up for controls began on May 1, 1991. Follow-up for both groups ended on the date of death or December 31, 1997, whichever came first. The cutoff date of December 31, 1997, was used because vital status data were incomplete after that date. Vital status was determined using databases of the Department of Veterans Affairs and the Social Security Administration (Department of Health and Human Services). The Veterans Affairs database known as the Beneficiary Identification and Records Locator Subsystem (BIRLS) is a computerized file of veterans who are eligible for government benefits, including death benefits. The Master Beneficiary Record is a file of deaths reported to the Social Security Administration. A recent study indicated that BIRLS and the Master Beneficiary Record collectively recorded 96 percent of all Vietnam-era veteran deaths (19).
Death certificates were requested from the Veterans Affairs regional office or federal record center identified in BIRLS as the location of the veteran’s claim folder. For death certificates that were not available from a Veterans Affairs regional office or federal record center, the National Death Index was used. Since 1979, state vital statistics offices have reported all deaths, including data on cause of death, to the National Center for Health Statistics, which maintains the National Death Index database. Causes of death were coded by a qualified nosologist who used the
International Classification of Diseases, Ninth Revision (20), without knowing the subject’s deployment status. Statistical analysis
The data were analyzed in four stages. First, for each Gulf War veteran, the number of person-years at risk of dying was counted from the date on which the veteran left the Persian Gulf theater. For comparison group veterans, follow-up began on May 1, 1991. Follow-up for both groups of veterans ended on December 31, 1997, or the date of death, whichever came first. The relative frequencies of overall deaths and cause-specific deaths were compared between Gulf veterans and non-Gulf veterans on the basis of person-years at risk. Unadjusted rate ratios were calculated from the crude death rates.
Second, Cox proportional hazards models were used to account for possible confounding and effect modification by selected covariates related to a veteran’s risk dying from a
at Florida State University College of Medicine Library on January 24, 2012
http://aje.oxfordjournals.org/
specific cause, according to time since the veteran’s entry into the cohort (21). Adjusted rate ratios derived from these models were used to approximate relative risk. The covari-ates considered in the models included Persian Gulf service (yes/no), age at entry into follow-up, race, marital status, service branch, and type of military unit. This analysis was carried out for male and female veterans separately. For Gulf veterans, cause-specific mortality risk was also assessed relative to the likelihood of exposure to nerve gas at the Khamisiyah site (yes/no).
Third, the cause-specific mortality of Gulf War veterans and non-Gulf veteran controls was compared with the num-ber of deaths expected in the overall US population, with adjustment for age, gender, race, and year of death. The results are presented as standardized mortality ratios expressing the ratio of the observed number of deaths among veterans to the expected number of deaths in the gen-eral population (22). Any rate ratio or standardized mortal-ity ratio was considered statistically significant when its 95 percent confidence interval did not include 1.0.
Finally, changes in relative mortality by follow-up period between Gulf veterans and their non-Gulf veteran counter-parts were determined by chi-squared test for trend (23). Follow-up was divided into four periods of approximately 20 months each: from entry into follow-up to December 31, 1992 (follow-up 1); from January 1, 1993, to August 31, 1994 (follow-up 2); from September 1, 1994, to April 30, 1996 (follow-up 3); and from May 1, 1996, to December 31, 1997 (follow-up 4). For each follow-up period, an adjusted rate ratio was derived from the Cox proportional hazards model, with adjustment for age, race, gender, marital status, branch of service, and unit component.
RESULTS
A total of 4,506 deaths were identified among the 621,902 Gulf War veterans. Cause of death was obtained for 4,268 (94.7 percent) of the Gulf veterans. Among the 746,248 non-Gulf veterans, 5,918 deaths were identified, and information on cause of death was available for 5,575 (94.2 percent). Gulf veterans had a total of 4,163,682.5 person-years at risk, with an average length of follow-up of 6.68 years. Control group veterans had 4,957,466.8 total person-years at risk and an average of 6.64 years of follow-up.
Military and demographic characteristics
Gulf veterans had fewer females than non-Gulf veterans (7 percent vs. 13.3 percent), were slightly younger than non-Gulf veterans (mean age in May 1991: 28.4 years vs. 30.2 years), and had more troops assigned to regular active-duty units (83.3 percent vs. 70.2 percent). Both groups of veter-ans were similar with regard to race, marital status, and branch of service (table 1).
Cause-specific mortality
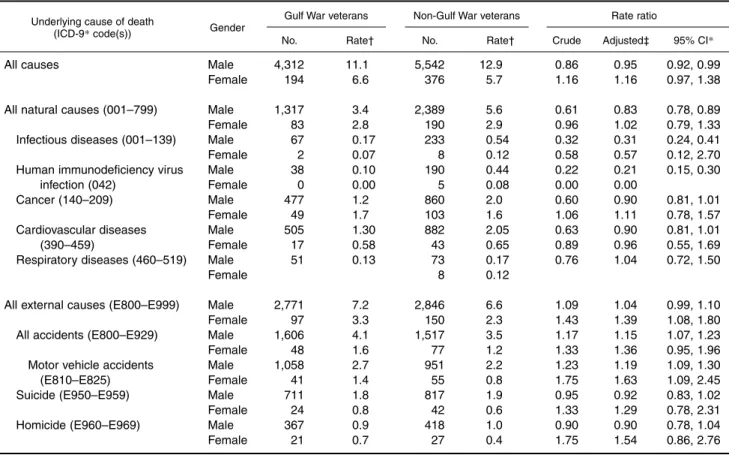
Cause-specific mortality rates of Gulf veterans were compared with those of non-Gulf veterans by gender, with
and without adjustment for age, race, branch of service, unit component, and marital status (table 2). Among male veter-ans, Gulf veterans had slightly lower risks of both overall mortality and mortality due to natural causes than non-Gulf veterans. The deficit from death due to infectious diseases (adjusted rate ratio 0.31, 95 percent confidence interval (CI): 0.24, 0.41) contributed significantly to the lower mor-tality from natural causes. Thirty-eight of the 67 (57 per-cent) deaths due to infectious diseases among Gulf veterans and 190 of the 233 deaths (82 percent) due to infectious dis-eases among non-Gulf veterans were related to human immunodeficiency virus (HIV) infection with specified con-ditions (International Classification of Diseases, Ninth Revision, code 042). There were no significant excesses of overall cancer deaths or deaths from cancer at any specific site among Gulf veterans compared with non-Gulf veteran controls. There was a significant deficit of deaths due to HIV infection (rate ratio 0.21, 95 percent CI: 0.15, 0.30) and a nonsignificant deficit of deaths due to amyotrophic lateral sclerosis (rate ratio 0.59, 95 percent CI: 0.21, 1.66)
TABLE 1. Demographic and military characteristics (%) of
subjects in a study of mortality among US Persian Gulf War veterans, 1990–1997 Race White Black Other Sex Male Female Year of birth ≤1961 1962–1967 ≥1968 Rank Enlisted person Officer Warrant officer Service branch Army Navy Air Force Marine Corps Type of unit Active Reserve Activated Not activated National Guard Activated Not activated Marital status Married Not married Unknown 67.4 23.0 9.6 93.0 7.0 33.8 32.1 34.1 89.2 9.5 1.3 51.8 21.8 11.5 14.9 83.3 10.1 6.6 53.9 45.8 0.3
Characteristic Other veterans
(n= 746,248) Gulf War veterans
(n= 621,902) 69.6 21.5 8.9 86.7 13.3 42.6 28.5 28.9 84.8 13.9 1.3 55.7 17.7 11.3 15.3 70.2 9.7 9.6 4.7 5.8 54.7 45.0 0.3
at Florida State University College of Medicine Library on January 24, 2012
http://aje.oxfordjournals.org/
among Gulf veterans compared with non-Gulf veteran con-trols. Regarding other natural causes of death, such as car-diovascular diseases and respiratory diseases, no significant difference was observed between Gulf veterans and non-Gulf veterans.
Among female Gulf veterans, overall mortality and mor-tality due to natural causes were not significantly different between Gulf veterans and non-Gulf veteran controls. However, both male and female Gulf veterans were at increased risk of traumatic death. In male Gulf veterans compared with male non-Gulf veterans, there were statisti-cally significant increased risks of death due to all accidents and death due to motor vehicle accidents. Female Gulf vet-erans had significantly higher mortality from all external causes and from motor vehicle accidents than female non-Gulf veterans.
Cause-specific mortality and likelihood of exposure to nerve gas
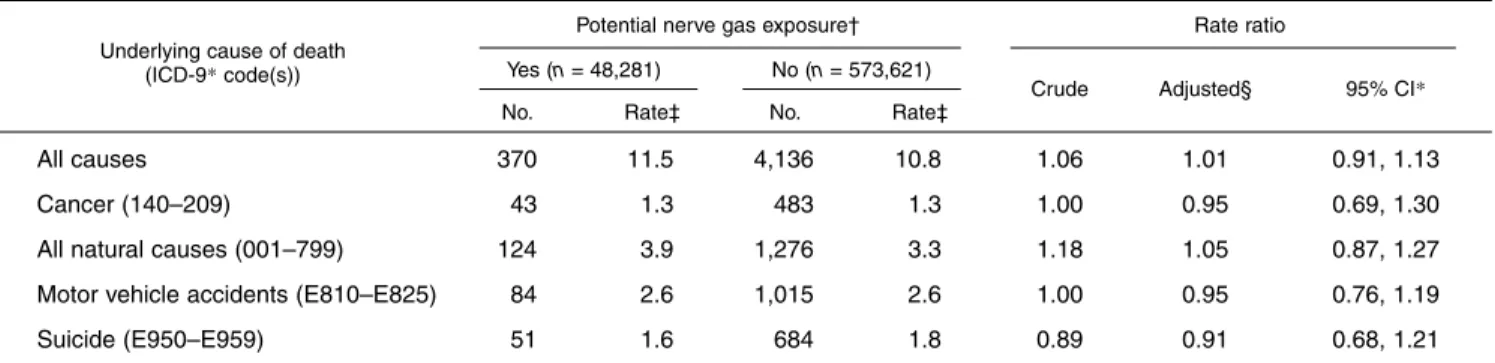
The cause-specific mortality risks associated with the likelihood of having been exposed to nerve gas at Khamisiyah are presented in table 3. Comparing the mortal-ity rate of 48,281 Gulf veterans who were potentially exposed to nerve gas with that of 573,621 other Gulf
veter-ans who were not likely to have been exposed, there was no statistically significant increased risk in mortality from all causes, cancer, all natural causes, motor vehicle accidents, or suicide. Other causes of death were also examined, and none were found to be associated with the Khamisiyah exposure variable.
Comparison with the general population
In comparison with the general US population, adjusting for age, race, gender, and calendar year of death, neither group of veterans had any excess in cause-specific mortality. In fact, both Gulf and non-Gulf veterans had statistically sig-nificant deficits in overall mortality (standardized mortality ratios were 0.41 (95 percent CI: 0.40, 0.42) and 0.42 (95 per-cent CI: 0.41, 0.43), respectively) and in most of the major disease categories compared with the general population. Changes in relative mortality over time between Gulf veterans and non-Gulf veterans
For Gulf veterans, the risk of death from motor vehicle accidents has decreased steadily over time, from a rate ratio of 1.32 (95 percent CI: 1.13, 1.53) in the first follow-up TABLE 2. Cause-specific mortality among US veterans of the Persian Gulf War as compared with US non-Persian Gulf War veterans, by gender, 1990–1997
All causes
All natural causes (001–799) Infectious diseases (001–139) Human immunodeficiency virus
infection (042) Cancer (140–209) Cardiovascular diseases
(390–459)
Respiratory diseases (460–519)
All external causes (E800–E999) All accidents (E800–E929)
Motor vehicle accidents (E810–E825) Suicide (E950–E959) Homicide (E960–E969) Male Female Male Female Male Female Male Female Male Female Male Female Male Female Male Female Male Female Male Female Male Female Male Female
Underlying cause of death (ICD-9*code(s))
Gulf War veterans Gender 4,312 194 1,317 83 67 2 38 0 477 49 505 17 51 2,771 97 1,606 48 1,058 41 711 24 367 21
*ICD-9, International Classification of Diseases, Ninth Revision (20); CI, confidence interval. † Crude death rate per 10,000 person-years.
‡ Adjusted rate ratio derived from a Cox proportional hazards model after controlling for age (in years), race, branch of service, unit component, and marital status.
Non-Gulf War veterans Rate ratio
No. Rate† No. Rate† Crude Adjusted‡ 95% CI*
11.1 6.6 3.4 2.8 0.17 0.07 0.10 0.00 1.2 1.7 1.30 0.58 0.13 7.2 3.3 4.1 1.6 2.7 1.4 1.8 0.8 0.9 0.7 5,542 376 2,389 190 233 8 190 5 860 103 882 43 73 8 2,846 150 1,517 77 951 55 817 42 418 27 12.9 5.7 5.6 2.9 0.54 0.12 0.44 0.08 2.0 1.6 2.05 0.65 0.17 0.12 6.6 2.3 3.5 1.2 2.2 0.8 1.9 0.6 1.0 0.4 0.86 1.16 0.61 0.96 0.32 0.58 0.22 0.00 0.60 1.06 0.63 0.89 0.76 1.09 1.43 1.17 1.33 1.23 1.75 0.95 1.33 0.90 1.75 0.95 1.16 0.83 1.02 0.31 0.57 0.21 0.00 0.90 1.11 0.90 0.96 1.04 1.04 1.39 1.15 1.36 1.19 1.63 0.92 1.29 0.90 1.54 0.92, 0.99 0.97, 1.38 0.78, 0.89 0.79, 1.33 0.24, 0.41 0.12, 2.70 0.15, 0.30 0.81, 1.01 0.78, 1.57 0.81, 1.01 0.55, 1.69 0.72, 1.50 0.99, 1.10 1.08, 1.80 1.07, 1.23 0.95, 1.96 1.09, 1.30 1.09, 2.45 0.83, 1.02 0.78, 2.31 0.78, 1.04 0.86, 2.76
at Florida State University College of Medicine Library on January 24, 2012
http://aje.oxfordjournals.org/
period to a rate ratio of 1.00 (95 percent CI: 0.82, 1.22) in the last follow-up period (table 4). The chi-squared value (χ27.53) indicated a significant (p0.0061, two-sided) decreasing trend in the risk of motor vehicle accident death with increasing time since the Gulf war among Gulf veter-ans compared with non-Gulf veterveter-ans. Risk of mortality due to disease-related causes among Gulf veterans in com-parison with non-Gulf veterans has steadily increased over the last three follow-up periods. In the most recent follow-up period, the risks of mortality from natural causes were almost identical in the two veteran cohorts.
DISCUSSION
Over the entire follow-up period, both male and female Gulf War veterans were at higher risk of death from acci-dents, especially motor vehicle accidents. However, during the most recent follow-up period, which started in the sixth year after the end of the Gulf War (May 1996–December 1997), the relative risk of mortality due to motor vehicle accidents had fallen from 1.32 (95 percent CI: 1.13, 1.53) to 1.00 (95 percent CI: 0.82, 1.22). This observation is very consistent with a mortality study of Vietnam veterans in which the excess mortality due to motor vehicle accidents was most pronounced in the first 5 years after Vietnam ser-vice (24). That study found that after the fifth year of follow-up, mortality due to motor vehicle accidents decreased to levels found in a non-Vietnam group (24).
There was an indication of increased relative mortality due to “natural causes” with increasing time since the Gulf War, although the rate ratios remained below 1.0 at all times. This could be explained by the excess number of deaths related to HIV infection among non-Gulf veterans. If mili-tary personnel who were HIV-positive during the war were not deployed in the Persian Gulf, and if most of them sub-sequently developed acquired immunodeficiency syndrome and died after the war while the relative risk of death from other natural causes remained unchanged, then the rate ratio for natural causes would have risen steadily toward 1.0.
Considering a lower mortality rate as an indicator of health, this study also found that in general both Gulf veter-ans and non-Gulf veterveter-ans were healthier than the general US population. This finding is consistent with the “healthy soldier effect” that has been reported in other studies of vet-eran groups (25–28). Because of the initial health screening required for military service, requirements to maintain cer-tain levels of physical fitness, and better access to medical services during and after military service, military cohorts are expected to be healthier than their comparable nonmili-tary civilian counterparts. A recent study of veterans who were on active duty in 1986 reported that the mortality of the veterans was half that of a civilian comparison group (26).
The underlying reasons for the increased risk of traumatic death among Gulf veterans are still not fully understood. One possible explanation is that these veterans may have engaged in more risk-taking behavior. A population-based survey of 30,000 Gulf War-era veterans indicated that since the war, Gulf veterans have been more involved in serious accidents, injuries, and illnesses than non-Gulf veterans (29). Furthermore, a smaller portion of Gulf veterans who died in motor vehicle accidents were using seat belts at the time of the fatal accident in comparison with non-Gulf vet-erans who died in motor vehicle accidents (30). Another possible explanation is that persons who have been involved in combat may be at increased risk for posttraumatic stress disorder, which in turn contributes to the excess number of deaths due to trauma (31).
Among the strengths of this study was substantial statisti-cal power to detect small to moderate increased risks of cause-specific mortality (15). Sampling errors should have been reduced as well, since all Gulf War veterans were used as the study group and almost half of all veterans who did not go to the Persian Gulf were used as a comparison group (32). The sources used to determine vital status in this study should have ensured fairly complete vital status ascertain-ment for both groups of veterans. In the first mortality study, which used the same sources for vital status ascertainment as this study, it was determined that vital status was ascer-TABLE 3. Crude mortality rates for all causes of death and selected causes of death among US Persian Gulf War veterans, by potential exposure to nerve gas at Khamisiyah, Iraq, 1990–1997
All causes Cancer (140–209)
All natural causes (001–799) Motor vehicle accidents (E810–E825) Suicide (E950–E959)
Underlying cause of death (ICD-9*code(s))
Potential nerve gas exposure†
No. 370 43 124 84 51
*ICD-9, International Classification of Diseases, Ninth Revision (20); CI, confidence interval.
† Troops located under an exposure plume for 4 days after destruction of Iraqi munitions containing nerve gas (model developed by the US Department of Defense (18)).
‡ Crude death rate per 10,000 person-years.
‡ Adjusted rate ratio derived from a Cox proportional hazards model after controlling for age (in years), race, gender, branch of service, unit component, and marital status.
Rate ratio Rate‡ Yes (n= 48,281) No (n= 573,621) Crude Adjusted§ 95% CI* 11.5 1.3 3.9 2.6 1.6 4,136 483 1,276 1,015 684 10.8 1.3 3.3 2.6 1.8 1.06 1.00 1.18 1.00 0.89 1.01 0.95 1.05 0.95 0.91 0.91, 1.13 0.69, 1.30 0.87, 1.27 0.76, 1.19 0.68, 1.21 No. Rate‡
at Florida State University College of Medicine Library on January 24, 2012
http://aje.oxfordjournals.org/
tained at an estimated rate of 89 percent (95 percent CI: 83, 97), with no significant differences between Gulf veterans and non-Gulf veterans (15). Cause of death was obtained for equally high percentages of both groups: 94.7 percent of Gulf veterans and 94.2 percent of non-Gulf veterans.
A potential limitation of this study is that some of the non-Gulf veterans may not have been as healthy as those sent to the Persian Gulf, as indicated by the excess number of deaths from HIV infection among non-Gulf veterans. Non-Gulf veterans may have included individuals who were recovering from surgery or had ailments serious enough to preclude them from being deployed but not serious enough to require their dismissal from the military. To evaluate the magnitude of this potential selection bias, we compared the mortality of a group of 106,840 non-Gulf reservists and National Guard veterans who were activated and deployed in locations other than the Persian Gulf with the mortality of 115,478 reserve and National Guard members who were not activated at all (32). Employing the same Cox proportional hazards models, we found no difference in either overall mortality or cause-specific mortality between the two groups, although the adjusted rate ratio for infectious and parasitic diseases (International Classification of Diseases, Ninth Revision, codes 001–139) was 0.43 (95 percent CI: 0.11, 1.62). If there had been significant selection bias, those deployed would have had a significantly lower risk of cause-specific mortality than those not deployed. Gray et al. (33) also reported, on the basis of prewar hospitalization rates among Gulf and non-Gulf veterans, that the effect of the possible selection bias was transient and largely resolved by the conclusion of the war. Gray et al. noted that military personnel in general are healthy and without serious chronic conditions. If they develop a chronic disease that causes a sustained reduction in their ability to perform their military duties, they are eventually separated from military service. We believe that the effect of this potential selection bias would be very limited and could not have accounted for all of our findings.
Another potential limitation is the reliance on death cer-tificates rather than medical records for information on cause of death. While death certificates are reliable sources for vital status ascertainment, their accuracy in recording causes of death may be variable, especially where cancer-related deaths are concerned (34, 35). However, agreement between medical records and death certificates has been reported to be good for external causes of death (24).
One final limitation is the lack of data on characteristics and behaviors not related to military service (e.g., excessive alcohol consumption, smoking) that could be risk factors for adverse health outcomes. However, such factors should have been present in similar proportions among Gulf veter-ans and non-Gulf veterveter-ans, as both groups joined the mili-tary prior to the Gulf War, and in almost all instances deployment to the Persian Gulf area was not voluntary.
In summary, over 7 years of follow-up, veterans who served in the Persian Gulf during the Gulf War were at greater risk for death due to motor vehicle accidents than their non-Gulf counterparts. However, during the same period, the risk decreased steadily over time. The lower risk
T
ABLE 4.
Mor
tality rates per 10,000 per
son-y
ear
s and mor
tality rate ratios f
or US P
e
rsian Gulf
W
ar veterans (PG) and US non-P
er s ian Gulf W ar veterans (NG), b y f ollo w-up period, 1990–1997
All causes All natur
al causes (001–799) Human imm unodeficiency vir us inf ection (042) Motor v ehicle accidents†† (E810–E825) Under
lying cause of death
(ICD-9 * code(s)) F ollo w-up per iod PG# 10.81 1.95 0.02 3.75 * ICD-9, Inter
national Classification of Diseases
, Ninth Re vision (20). † F ollo w-up 1: from or iginal entr y into f ollo w-up to December 31, 1992. P erson-y ears at r isk totaled 1,068,119.046 f or P ersian Gu lf v e ter ans and 1,244,045.490 f or non-Gulf v eter ans . ‡ F ollo w-up 2: from J a n uar y 1, 1993, to A ugust 31, 1994. P erson-y ears at r isk totaled 1,031,468.287 f or P ersian Gulf v e ter ans and 1,237,670.687 f or non-Gulf v eter ans . § F ollo w-up 3:
from September 1, 1994, to Apr
il 30, 1996. P erson-y ears at r isk totaled 1,027,923.706 f or P ersian Gulf v e ter ans an d 1,233,127.723 f or non-Gulf v eter ans . ¶ F ollo w-up 4: from Ma y 1, 1996, to December 31, 1997. P erson-y ears at r isk totaled 1,031,068.172 f or P ersian Gulf v e ter ans and 1 ,236,512.706 f or non-Gulf v e ter ans . # Cr ude r
ate per 10,000 person-y
ears
.
**
Adjusted r
ate r
atio (RR) and 95% confidence inter
v
al (CI) der
iv
ed from a Co
x propor
tional hazards model after controlling f
or a ge (in y ears), r ace , gender , br anch of ser vice
, unit component, and mar
ital status . †† The χ 2v
alue indicated a significant trend (
p = 0.006, tw o-sided). NG# F ollo w-up 1† F ollo w-up 2‡ F ollo w-up 3§ F ollo w-up 4¶ 10.43 3.02 0.15 2.56 1.05 0.85 0.13 1.32 0.97, 1.14 0.71, 1.01 0.03, 0.55 1.13, 1.53 RR ** 95% CI ** PG NG RR 95% CI PG NG RR 95% CI PG NG RR 95% CI 10.11 2.79 0.00 2.49 11.71 4.91 0.36 1.90 0.89 0.70 0.00 1.21 0.82, 0.96 0.61, 0.81 1.01, 1.45 11.36 3.90 0.16 2.45 13.06 6.37 0.58 1.95 0.93 0.78 0.23 1.17 0.86, 1.00 0.69, 0.88 0.13, 0.39 0.98, 1.40 11.06 4.93 0.19 1.83 12.63 6.54 0.49 1.71 0.96 0.97 0.34 1.00 0.89, 1.04 0.86, 1.08 0.20, 0.57 0.82, 1.22
at Florida State University College of Medicine Library on January 24, 2012
http://aje.oxfordjournals.org/
of death due to disease-related causes observed earlier among Gulf veterans all but disappeared in the most recent follow-up period. For both Gulf veterans and non-Gulf vet-erans, mortality risk remained less than half that expected in their civilian counterparts.
ACKNOWLEDGMENTS
This study was supported by the Medical Research Service, Office of Research and Development, Department of Veterans Affairs.
REFERENCES
1. Presidential Advisory Committee on Gulf War Veterans’ Illnesses. Presidential Advisory Committee on Gulf War Veterans’ Illnesses: final report. Washington, DC: US GPO, 1996. (ISBN 0-16-048942-3).
2. National Institutes of Health Technology Assessment Workshop Panel. The Persian Gulf experience and health. JAMA 1994; 272:391–5.
3. Institute of Medicine, National Academy of Sciences. Health consequences of service during the Persian Gulf War: recom-mendations for research and information systems. Washington, DC: National Academy Press, 1996.
4. Murphy FM, Kang HK, Dalager N, et al. The health status of Gulf War veterans: lessons learned from the Department of Veterans Affairs health registry. Mil Med 1999;164:327–31. 5. Joseph SC and the Comprehensive Clinical Evaluation
Program Team. A comprehensive clinical evaluation of 20,000 Persian Gulf War veterans. Mil Med 1997;162:149–55. 6. Gray GC, Hawkowarth AW, Smith TC, et al. Gulf War
veter-ans’ health registries: who is most likely to seek evaluation? Am J Epidemiol 1998;148:343–9.
7. Research Working Group of the Persian Gulf Veterans Coordinating Board. Annual report to Congress. Washington, DC: Department of Veterans Affairs, 1999.
8. The Iowa Persian Gulf Study Group. Self-reported illness and health status among Gulf War veterans. JAMA 1997;277: 238–45.
9. Kang HK, Mahan CM, Lee KY, et al. Illness among United States veterans of the Gulf War: a population-based survey of 30,000 veterans. J Occup Environ Med 2000;42:491–501. 10. Fukuda K, Nisenbaum R, Stewart G, et al. Chronic
multi-symptom illness affecting Air Force veterans of the Gulf War. JAMA 1998;280:981–8.
11. Unwin C, Blatchley N, Coker W, et al. Health of UK servicemen who served in Persian Gulf War. Lancet 1999;353:169–78. 12. Gray GC, Coate BD, Anderson CM, et al. The postwar
hospi-talization experience of U.S. veterans of the Persian Gulf War. N Engl J Med 1996;335:1505–13.
13. Cowan DN, DeFraites RF, Gray GC, et al. A record based eval-uation of the risk of birth defects among children of Gulf War veterans. N Engl J Med 1997;336:1650–6.
14. Writer JV, DeFrautes RF, Brundage JF. Comparative mortality among U.S. military personnel in the Persian Gulf region and worldwide during Operations Desert Shield and Desert Storm.
JAMA 1996;275:118–21.
15. Kang HK, Bullman TA. Mortality among U.S. veterans of the Persian Gulf War. N Engl J Med 1996;335:1498–504. 16. Rostker B. US demolition operations at the Khamisiyah
ammunition storage point. Washington, DC: US Department of Defense, April 14, 1997.
17. Walpole RD, Rostker B. Modeling the chemical warfare agent release at the Khamisiyah pit. Washington, DC: US Department of Defense, September 4, 1997.
18. Gray GC, Smith TC, Knoke JD, et al. The postwar hospital-ization experience of Gulf War veterans possibly exposed to chemical munitions at Khamisiyah, Iraq. Am J Epidemiol 1999;150:132–40.
19. Page WF, Mahan CM, Kang HK. Vital status ascertainment through the files of the Department of Veterans Affairs and the Social Security Administration. Ann Epidemiol 1996;6:102–9. 20. International classification of diseases. Manual of the interna-tional statistical classification of diseases, injuries, and causes of death. Ninth Revision. Vol 1. Geneva, Switzerland: World Health Organization, 1977.
21. SAS Institute, Inc. SAS/STAT software: the PHREG proce-dure, version 6. (Technical report p-217). Cary, NC: SAS Institute, Inc, 1991.
22. Boice J, Pickle L, Thomas TL, et al. O/E system: observed ver-sus expected events: users guide, version 3.8. Bethesda, MD: National Cancer Institute, 1991.
23. Epi Info 6, version 6.04b. Atlanta, GA: Centers for Disease Control and Prevention, 1997.
24. The Centers for Disease Control Vietnam Experience Study: postservice mortality among Vietnam veterans. JAMA 1987; 257:790–5.
25. Seltzer CC, Jablon S. Effects of selection on mortality. Am J Epidemiol 1974;100:367–72.
26. Rothberg JM, Bartone PT, Holloway HC, et al. Life and death in the US Army: in corpore sano. JAMA 1990;264:2241–4. 27. Thomas TL, Kang HK, Dalager NA. Mortality among women
Vietnam veterans, 1973–1987. Am J Epidemiol 1991;134: 973–80.
28. Watanabe KK, Kang HK. Military service in Vietnam and the risk of death from trauma and selected cancer. Ann Epidemiol 1995;5:407–12.
29. Kang HK. National health survey of Gulf War era veterans and their families. (Abstract). Presented at the conference on federally sponsored Gulf War veterans’ illnesses research, Pentagon City, Virginia, June 17–19, 1998.
30. Magee CA, Kang HK, Bullman TA, et al. Analysis of potential risk factors for motor vehicle accident death among Gulf War veterans. (Abstract). Presented at the 126th Annual Meeting of the American Public Health Association, Washington, DC, November 15–18, 1998.
31. Bullman TA, Kang HK. Posttraumatic stress disorder and the risk of traumatic deaths among Vietnam veterans. J Nerv Ment Dis 1994;182:604–10.
32. Kang HK, Bullman TA. Counterpoint: negligible “healthy-warrior effect” on Gulf War veterans’ mortality. Am J Epidemiol 1998;148:324–5.
33. Gray GC, Knoke JD, Berg SW, et al. Counterpoint: responding to suppositions and misunderstandings. Am J Epidemiol 1998; 148:328–33.
34. Engel LW, Struachen JA, Chiazze L, et al. Accuracy of death certificates in an autopsied population with specific attention to malignant neoplasms and vascular diseases. Am J Epidemiol 1980;111:99–112.
35. Percy C, Stanek E, Gloeskler L. Accuracy of cancer death cer-tificates and its effects on cancer mortality statistics. Am J Public Health 1981;71:242–50.
at Florida State University College of Medicine Library on January 24, 2012
http://aje.oxfordjournals.org/