T
HE
I
MPACT OF
P
ROVIDING
B
USINESS
TRAINING TO MICROFINANCE CLIENTS:
Empirical Evidence from Tanzania
Guro Landsend Henriksen
Svein Olav Svoldal
Supervisor:
Erik Øiolf Sørensen
Master Thesis in Economics
NORGES HANDELSHØYSKOLE
This thesis was written as a part of the Master of Science in Economics and Business Administration programme - Major in Economics. Neither the institution, nor the advisor is responsible for the theories and methods used, or the results and conclusions drawn, through the approval of this thesis.
NORGES HANDELSHØYSKOLE
Bergen, spring 2010
2
A
BSTRACTThis master thesis studies the impact of providing business training to microfinance clients in Tanzania. Based on data collected six months after the programme ended, we cannot confirm positive treatment effects from business training on the micro entrepreneurs’ profits. However, treated entrepreneurs have higher likelihood of operating multiple businesses; increased their engagement within commerce and reduced their engagement within manufacturing. Based on the market situation at the time, these changes all represent advancement towards business structures associated with higher profitability. Moreover, findings of low profitability in new establishments can serve as an explanation to the small effect from business training on profits, and imply that treatment effects will be manifested in higher future profits of the entrepreneurs.
3
T
ABLE OFC
ONTENTSAbstract ... 2
1. Introduction ... 4
2. Literature Review: Entrepreneurship and Microfinance ... 8
2.1 Introduction ... 8
2.2 The Concept of Microfinance ... 9
2.2.1 Financial Constraints ... 10
2.2.2 Empirical Evidence on The Impact of Microfinance ... 11
2.3 Human Capital Constraints ... 12
3. Institutional Framework: Entrepreneurship and Microfinance in Tanzania ... 14
3.1 Tanzania: A Brief Presentation ... 14
3.2 Small Business Entrepreneurship in Tanzania ... 17
3.2.1 Business Obstacles ... 18
3.2.2 Microfinance ... 19
3.3 PRIDE Tanzania ... 20
3.3.1 Groups, Recruitment and the Loan Application Process ... 21
4. Research Profile ... 23
4.1 The Interventions ... 23
4.2 Data and Explanatory Variables ... 24
4.2.1 The Data Collection Process ... 24
4.3 The Sample Selection Process... 29
4.3.1 Methodology: Randomisation ... 30
4.3.2 Randomisation Procedure in Tanzania ... 32
5. Descriptive and Empirical Analysis ... 37
5.1 Descriptive Profile ... 38
5.2 Direct Analysis for Treatment Effects on Short-Term Profits... 43
5.3. Indirect Analysis of Treatment Effects on Long-Term Profits ... 45
5.3.1. The Relationship between Profits and Business Structure (Step 1) ... 45
5.3.2 Treatment Effects on Business Structure (Step 2) ... 54
5.4.3 Findings in the Indirect Analysis of Treatment Effects ... 59
6. Summary and Concluding Remarks ... 61
4
1.
I
NTRODUCTION“I firmly believe that all human beings have an innate skill. I call it the survival skill. The fact that the poor are alive is clear proof of their ability. They do not need us to teach them how to survive; they already know. So rather than waste our time teaching them new skills, we try to make maximum use of their existing skills. Giving the poor access to credit allows them to immediately put into practice the skills they already know...”
Professor Muhammad Yunus: Banker to the Poor (1999, page 140)
The concept of microfinance started out as a small idea in 1976, where the US educated economist and pioneer, Muhammad Yunus, from his own pocket gave a loan of US$ 27 to a small group of self employed women in a poor Bangladeshi village. The group as a whole were accountable for the individual loans, and proved excellent payment records, interest included. Grameen Bank was founded on the positive outcome of this experiment, and the belief that access to credit can promote income growth and development for poor entrepreneurs, women in particular.
The Grameen Bank model has served as the foundation of the global microfinance movement, now replicated at five continents and serving more than 155 million poor entrepreneurs [2007 estimate]. The United Nations designated 2005 as the International Year of Microcredit, and in 2006 Professor Yunus and Grameen Bank were awarded the Nobel Peace Prize.
Despite the substantial public attention captured by microfinance, its success cannot be taken for granted. Research show that financial constraints are substantial among poor entrepreneurs, but indicate that the microfinance movement has been too optimistic on the potential of its products: Small-scale entrepreneurs are likely to face several obstacles to enterprise growth, while microfinance only addresses one of them. The growth effect of finance may critically depend on the entrepreneur‟s individual characteristics, such as business knowledge and skills. In hard contrast to the quoted beliefs of Professor Yunus, this master thesis evaluates the impact of incorporating business training in a microfinance programme.
The evaluation draw on empirical data originating from a larger and ongoing research project in Tanzania, “Teaching Entrepreneurship to Microfinance Clients: Financial and Human Capital for Development”. Through a randomised field study, the project seeks to investigate the impact from offering business training and a cash transfer to small-scale entrepreneurs in Dar es Salaam. Responsible for the research project are the NHH professors, Kjetil Bjorvatn
5 and Bertil Tungodden, in company with Professor Dean S. Karlan from Yale University and the NHH Phd. Candidate, Lars Ivar Berge. Major collaborators to the project are the microfinance institution PRIDE Tanzania, where the entrepreneurs in the sample of are borrowers, and University of Dar es Salaam, responsible for the design and implementation of the business-training programme.
Clients from two of five PRIDE branches in Dar es Salaam were randomly assigned to a treatment group and a control group. Clients assigned to the treatment group received an invitation to participate in the business-training programme; while clients in the control group remained as they were, not subject to any training. The business-training programme was launched in August 2008, consisting of 21 tuition-free lectures given after the weekly loan meeting at PRIDE.
In order to evaluate the impact from the business training, a comprehensive follow-up survey was conducted in Dar es Salaam the summer of 2009. In addition, a baseline survey was completed before the programme started, and a lab experiment was carried out in March 2009. Being two out of seven research assistants, we participated to the data collection and production of the dataset in the follow-up survey. Together with Swahili translators, we interviewed 530 small-business entrepreneurs at their business premises, whereas approximately fifty percent had been offered business training. The statistics resulting from these interviews, as well as the data collected in the baseline and the lab experiment constitute the dataset subject to analysis in this thesis. Assuming a successful randomisation, the only difference between the treatment group and the control group is that the treatment group could take part in the business training, something which allows us to acquire unbiased and valid estimates of the average treatment effect.
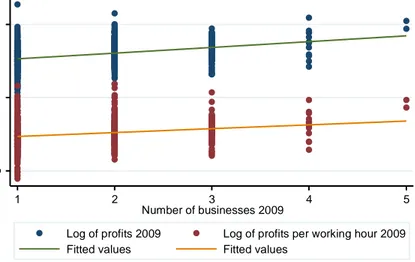
In accordance with the general intention of microfinance, the overall aim of the business-training programme was to increase the profitability to the participating entrepreneurs. The natural starting-point to analysis of treatment effect from the programme is therefore to test its impacts on measures of profits. Because total profits do not reflect the entrepreneurs‟ effort in production, we also carry out analyses of their profits per working hour. When performing the regression analyses however, we do not find significant differences in profits between the entrepreneurs in the treatment group and in the control group. Albeit the impact from business training appear positive on total profits; and more so when working hours are taken into
6 account; the evidences are not sufficient to confirm these findings at any conventional significance level.
Recognising that we are unable to find direct treatment effects on the entrepreneurs‟ profits, we take a step back and search for plausible explanations to this somewhat puzzling result. Considering the entrepreneurs‟ positive commitment and actual participation to the business-training programme, our understanding is that the entrepreneurs find the business-training beneficial. This was also our impression from the interview settings, where many of the participants uttered appreciation for the opportunity, and announced that they were willing to spend time and even money on additional business training.1 Additionally, one may expect relatively high returns from investment in human capital among micro entrepreneurs with modest level of education. In view of the above reflections, we hold on to our expectation of a positive effect from business training, suspecting that our direct analysis on profits is not adequate to capture this treatment effect.
Underpinning our suspicion, is an assumption of divergence between short-term and long-term treatment effects, alleging that business training leads to practices that for most part increase long-term profits, and possibly lower short-term profits. Since the follow-up survey were carried out only six months after the completion of the business training, it is logical that long-term effects were not fully embodied in the profits accruing to the entrepreneur. On the other hand, short-term effects may still be present in the profitability of his business operations at the time of the interview. That being so, the direct analysis on the short-term profit misses out on potential treatment effects with long-term implications on profits.
Endeavouring to come across such treatment effects, we look for entrepreneurial characteristics that we assume to have explanatory power on profits and which are susceptible to influence from participation in the business-training programme. Comparisons of statistics from the two surveys make us aware of substantial alterations as to the general organisation of the entrepreneurs‟ business operations, namely their business structure. Widespread activities of establishing new businesses and closing down existing businesses have resulted in growth of the total number of businesses, as well as adjustments in the sector composition. The activities of changing business structure might be a first move towards higher profitability in
1 On average, the entrepreneurs stated that they were willing to pay kTS 53 in total for a 21-session
business-training programme similar to that one implemented in the field study. Although the willingness to pay was lower among the entrepreneurs in the treatment group, they were prepared to pay on average kTS 47 for an additional business-training programme suited their level of skills.
7 the future, but are not necessarily profitable in the short-term. For example, we expect that the profits and work hours of the entrepreneur will increase along with his number of businesses and we imagine that operations within some sectors are more profitable than operation within other sectors. At the same time, we direct lower expectations to the short-term profitability of new establishments than towards mature businesses well settled in the market.
Our hypothesis is therefore that entrepreneurs with business training have made changes to their business operations that are not reflected in their profitability at the time of the follow-up survey, yet likely to increase their profits in the future. Addressing the problem at hand, we aspire to investigate the long-term implications for profits indirectly, through tests for treatment effects on the business structures of the micro entrepreneurs.
The analysis for long-term treatment effects consists of two steps, where the first step aims to illustrate the typical business structures to profitable micro entrepreneurs. The second step tests for treatment effects from the business-training programme on the entrepreneurs‟ business structures. Given the assumption of a valid randomisation, significant variation between the treatment group and the control group are in its entirely ascribed to the business-training programme. Based on the results in Step 1, we aspire to translate potential treatment effects on the entrepreneurs‟ business structure into general implications for their expected long-term profits.
The remaining of this thesis is organised as follows: Chapter 2 continues the above introduction to microfinance and human capital through a summary of recent literature and research on the topics. Chapter 3 presents the setting in Tanzania and Dar es Salaam, including a description of small-business entrepreneurship and microfinance institutions in the country. The chapter ends with a section about PRIDE Tanzania, its microfinance clients and loan conditions. Chapter 4 goes into details concerning the project design and the methodology of randomisation. It discusses the implementation of the research project in Tanzania, emphasising the process of sample selection. Chapter 5 provides descriptive and empirical analyses, comprising the above introduced analyses for treatment effect on profitability. Chapter 6 concludes.
8
2.
L
ITERATURER
EVIEW:
E
NTREPRENEURSHIP ANDM
ICROFINANCE This chapter explains the concept of microfinance, both from a theoretical and empirical point of view. Further, it reviews recent research on the impact of microfinance initiatives, before discussing the literature on human capital constraints among micro entrepreneurs.2.1
I
NTRODUCTIONSmall and informal enterprises are the source of employment for more than fifty percent of the labour force in many developing countries. It is widely recognised that some of these entrepreneurs can play a significant role in the development process and potential growth in poor countries (de Mel et al, 2008).
It is however evident that current and potential entrepreneurs in poor countries face a variety of obstacles with respect to their daily business operations. Capital constraints loom as an important barrier in this matter, making it difficult to build assets as well as managing working capital and risk. Formal banks have traditionally not considered poor people within their customer portfolio, leaving them to the utilisation of informal financial instruments. Examples are saving clubs, rotating savings ROSCA], credit associations, family and friends. These tend to be both costly and unreliable (Collins et al., 2009).
Microfinance institutions [MFIs] are designed to address the abovementioned problems by offering poor entrepreneurs access to formal financial services. Even though microfinance has increased rapidly worldwide the last two decades, covering more than 155 million clients by the end of 2007, there is no consensus among academics on the actual impact from microfinance on the business outcome (Daley-Harris, 2009).
Microfinance cannot address all obstacles faced by poor entrepreneurs, partly because some obstacles are related to the characteristics of the entrepreneurs themselves. Individual characteristics, in particular human capital aspects, are likely to be crucial determinants of entrepreneurial success. It is logical that Business skills and knowledge such as pricing strategies, cost control, customer care and market structure, affects the entrepreneur‟s decision-making process. Business training may improve the entrepreneurs‟ level of business knowledge and skills, enabling them to make better strategic decisions and optimise their business operations. Furthermore, it may help them to better deal with other obstacles, such as capital constraints, regulations, poor infrastructure and demand deficiency.
9
2.2
T
HEC
ONCEPT OFM
ICROFINANCEMicrofinance is a collective term for basic financial services made available to poor people, women in particular [67 percent]. Loans [microcredit], savings, money transfer services and insurance are all included in the microfinance term (CGAP, 2010). It is common to associate microfinance with microcredit, leaving the other financial services as by-products.
Poor borrowers have traditionally been viewed as a risky segment, and therefore excluded from formal financial services. Microfinance has made us rethink the concept of banking, demonstrating that poor people are both willing and capable of repaying their loans at relatively high interest rates. The Grameen Bank, founded by Mohammed Yunus in 1983, stands out as the major pioneer on the microfinance initiative, and the “Grameen model” has served as a benchmark for similar initiatives around the globe.
A central feature of the Grameen model is that loans are granted to groups of five borrowers rather than individuals. Moreover, in the event of default, no group member is allowed to borrow again. This way of making borrowers accountable for each other‟s loans implies that the individuals must form a group carefully not to include someone who endangers the creditworthiness of the whole group (Ray, 1998). The group dynamic promotes repayment incentives, contributing to an average repayment rate of 97.5 for microfinance institutions (Rosenberg, 2010). The group-lending approach also makes it possible to abandon the requirement of a loan deposit, which sometimes is difficult for the poor to provide.
Microfinance clients are likely to operate one-man enterprises or small enterprises with few emplyees, experiencing both fluctuating and relatively low cash flows. MFI services can enable them to deal with the financial constraints they face in their business operations. Moreover, microfinance represents opportunities to smooth household consumption; take care of unforeseen events; invest in children‟s education and improve their household bargaining position (Collins et al, 2009).
The rapid increase in development funding directed towards microfinance is partly founded on the belief that small-scale enterprises can earn high return to capital if they are given the opportunity. If these returns exceed market interest rates, the use of microfinance may have the potential of promoting income growth among poor entrepreneurs.
10 2.2.1 FINANCIAL CONSTRAINTS
A recent and comprehensive study by de Mel, McKenzie and Woodruff (2008, 2007) analyse the returns to capital through supply of grants to randomly selected2 enterprises in Sri Lanka. The grants were either US$100 or US$200, both substantial amounts given the baseline median level of invested capital of US$180. One subsample received the grants in cash, without any restrictions, and another through in-kind grants, consisting of equipment equivalent to the amounts given in cash.
De Mel et al. (2008) measure treatment effects on three dimensions: change in capital stock, profits, and hours worked by the owner. By using different estimates of the marginal productivity of the owner‟s additional work effort, the average return of the grants is 4.6%-5.3% per month [55%-63% per year] - far higher than market interest rates. Returns to capital they find to vary with entrepreneurial ability, but not with risk aversion and uncertainty. Digging deeper, the study by De Mel et al. (2008) shows that returns to capital are generally higher for entrepreneurs with relatively severe financial constraints. The traditional arguments for directing microfinance towards women in particular, are that their financial constraints are relatively severe and that they tend to use resources more efficiently. Hence, one expects women to have higher returns than men, given that their financial constraints are revealed. In contrast to theory, de Mel et al. (2007) find the average treatment effect to be significant on enterprises owned by men, but no such evidence for female owned enterprises. The large differences between genders seem to caused by exposure towards different industries.3 However, average returns for women are also lower than those for men when being exposed to the same industries (de Mel et al, 2007). According to the authors, another possible explanation for the gender differences is that female entrepreneurs often operate from home where businesses and family tasks are combined. This may limit their potential for expanding the customer base, because the customers have to be within the same area as the household. The overall results from the Sri Lanka study suggest substantial capital constraints among poor entrepreneurs and this imply growth possibilities through the utilisation of financial
2 The randomisation ensures that changes in capital stock are uncorrelated with entrepreneurial ability, demand
shocks and other factors associated with differences in profitability or investments across the sample (de Mel et al., 2008). The methodology is reviewed in chapter 4.
3 When comparing industries without men with industries without women, there are large return differences: The
industries without women have returns to capital of 10 percent per month, while industries without men have returns to capital of negative 10 percent (de Mel et al., 2007).
11 instruments, such as microfinance. The following section therefore reviews some of the research concerning the impact of microfinance initiatives.
2.2.2 EMPIRICAL EVIDENCE ON THE IMPACT OF MICROFINANCE
We have knowledge of three completed field studies that investigate the isolated impact of microfinance. Similar to the field study in Tanzania, these studies randomly assign individuals to a microfinance programme, and compare them to a control group of individuals that is randomly chosen not to take part in the programme. The methodology of randomisation is discussed carefully in chapter 4.
Two of the studies have limited relevance in our own setting: Dupas and Robinson (2008) measure the impact of providing savings accounts to poor entrepreneurs in a Kenyan village, while Karlan and Zinman (2007) deal with consumer loans in South Africa. The studies indicate favourable treatment effects on some dimensions, but neither can be generalised to the typical microcredit context, emphasising on loans directed to business purposes.
The third study, conducted by Banjerjee, Duflo, Glennerster and Kinnan (2009), estimates the impact of making microcredit available to a new market. They randomly selected 52 out of 104 areas in Hyderabad, India to open an MFI branch. The remaining areas were not subject to treatment and represent the control sample in their study. As a result of their intervention, the probability of receiving microcredit in treatment areas was 8.3 percentage points higher than in the control areas.
Banjerjee et al. (2009) find significant and positive treatment effects on MFI borrowing, new establishments, profitability of pre-existing businesses, and durable expenditures. The results are however not robust to any consumption measures, and the study holds some weaknesses, most notable a mismatch between the baseline sample of 2,800 households and the follow-up sample of 6,650 households.
Summing up, the earlier discussed study by de Mel et al. (2008) demonstrates that poor micro entrepreneurs are likely to face severe financial constraints in their enterprises, and that returns to capital can be substantial as the financial constraints are relieved. On the other hand, the empirical literature on microfinance has only been able to report limited evidence so far. Moreover, it is too early to conclude on its long-term impact on business profitability. Partly as a result of this mixed evidence on the importance of financial constraints, several
12 researchers have directed their focus towards other constraints on microenterprise development, in particular those that involving skills and knowledge.
2.3
H
UMANC
APITALC
ONSTRAINTSThe literature highlights the importance of human capital in a growth perspective, and suggests that it makes the labour force more productive and adoptive towards new technology. The study by de Mel et al., (2008) indicates that knowledge and abilities are important in determining returns to capital. Most developing countries have low levels of human capital, in particular evident in the informal sector where people with poor education might see entrepreneurship as a last way out to earn an income
There are a number of NGOs offering business training to small and medium scale entrepreneurs in poor countries, though there are few academic studies that investigate the causal effect of entrepreneurial training on enterprise outcome. An important research issue is whether relevant training in business management, such as cost control, accounting, market analysis, marketing, and pricing strategies can stimulate investments in feasible projects and lead to growth and expansion in the long-term. As an extension to this question is the underlying mechanism of entrepreneurial success: Is it entrepreneurial skills; such as bookkeeping, customer care and market understanding; or the entrepreneurial mindset, such as attitude, willingness and self-confidence, that determine success? (Bjorvatn et al., 2010). In the following, we review two studies investigating the impact of business training.
THE IMPACT OF BUSINESS TRAINING
Klinger and Schündeln (2007) use the results from a business-plan competition to measure the impact of a business-training programme offered to mature4 entrepreneurs in Central America. Out of a total sample of 655 entrepreneurs, 377 were accepted into the programme and received business training. To evaluate how the programme participants would have performed in the absence of the programme, the authors utilise a control group consisting of 278 rejected applicants. In the absence of randomisation and to avoid a bias from unobservable characteristics5, the authors utilise a discontinuously estimation model where they control for the individual score assigned in the application process.
4 The entrepreneurs in the sample are well established and have on average 10 employees.
5 Bias from unobservable characteristics can result from a selection bias. The problem of selection bias is
13 Klinger and Schündeln (2007) find that participation in the business-training programme significantly increases the probability of establishing new enterprises and expansion of existing businesses. They do not find impacts from business training on business outcomes, such as sales and profits. Further, by restricting the sample to mature enterprises, they partly ignore the role of financial constraints in entrepreneurial activity: Klinger and Schündeln (2007) find a positive relationship between age and the probability of launching a new business. One possible explanation is that younger entrepreneurs have relatively severe capital constraints compared to their older counterparts; another is that younger entrepreneurs have lower levels of business knowledge and skills, indicating that they in the absence of capital constraints would have benefited the most from business training.
Karlan and Valdivia (2006) conduct a comparable study in Peru, where they implement a business-training programme to micro entrepreneurs in two different cities, Lima and Ayacucho. Their study differs from the one by Klinger and Schündeln in several dimensions: Firs of all, Karlan and Valdivia examine the impact of providing business training to entrepreneurs with lower operation scale than in the case of Klinger and Schündeln. In addition, by restricting their sample to female microcredit clients, they investigate how injections of both human and financial capital affect the enterprise performance of a group with relatively severe financial and human capital constraints. Finally, the methodology differs in that Karlan and Valdivia conduct a randomised control trial to measure the average treatment effect of their programme.
Karlan and Valdivia (2006) find that microfinance clients subject to their training programme are more likely to maintain a clean repayment record compared to untreated clients. They argue that this results from the improved business outcome, which on average is 16 percent higher for treated clients in terms of sales. The results are however not robust to other outcome variables, such as profit margins and change in labour. Nor are there significant changes in loan size and cumulative savings due to training.
The literature concerning business training as instrument to microenterprise development is so far limited, and more research is clearly needed before one can conclude on its impact on long-term business outcome.
14
3.
I
NSTITUTIONALF
RAMEWORK:
E
NTREPRENEURSHIP ANDM
ICROFINANCE INT
ANZANIAThis chapter highlights relevant characteristics of the Tanzanian society, such as the political-economic regime, political-economic development and structural aspects. Of particular interest are the features of small business entrepreneurship in the country, and how poor enterprise owners cope with their obstacles. Finally, we review Pride Tanzania, the microfinance institution where a sample of the loan clients was subject to the business-training programme in our study.
3.1
T
ANZANIA:
A
B
RIEFP
RESENTATIONThe United Republic of Tanzania is located in Eastern Africa, bordering the Indian Ocean between Kenya and Mozambique. The country was constituted in 1964, formed in a merger between the two former colonies Tanganyika and Zanzibar, both achieving their independence from Britain in the early 1960s. Julius Nyerere was the first president and absolute ruler of Tanzania, controlling the socialist party CCM until he resigned and left responsibility to Ali Hassan Mwinyi in 1990. The one-party rule came to an end in 1995, when Tanzania held its first democratic election with more than one single party (CIA, 2010). Nevertheless, CCM has won all elections held both in Tanzania and Zanzibar since the multi-party system was implemented, and in 2005, its leader Jakaya Mrisho Kikwete was elected the fourth president of Tanzania (U.S Department of State, 2010).
According to CIA‟s World Factbook (2010), Tanzania‟s population is approximately 41 million, of which 99 percent are natives from one of more than 130 different tribes, and the remaining one percent are Asian, Arab and European immigrants. With exception from Zanzibar, which is practically Islamic, the population is about equally shared between Christians, Muslims and tribes with indigenous beliefs. Tanzania‟s official language is Swahili, while English works as primary language of commerce, administration, and higher education. Nevertheless, the 130 tribes also speak their own language, and the probability that two random selected individuals have different mother tongue is as high as 93 percent (Easterly & Levine, 1997). Since 1973, Dodoma - located in the middle of the country with approximately 350 000 citizens, has been the capital of Tanzania.
Until 1985, the Tanzanian government was firmly left-orientated and maintained a system of collectivised agriculture known as Ujamaa, the Swahili word for extended family (Meredith,
15 2005). This political-economic regime greatly disrupted agricultural efficiency and output, led to a near collapse of the national economy, and consolidated Tanzania‟s status as one of the poorest countries in the world (Meredith, 2005). The government has subsequently taken on a more pragmatic approach, and made significant efforts to liberalise and modernise the Tanzanian economy. Through comprehensive free market policies and dismantling of socialist economic controls, the private sector has been promoted and encouraged to participate in the economy (U.S. Department of State, 2010). According to Tanzania‟s national website (2010), the government continues the liberal policies and facilitation of the private sector in order to accelerate growth and raise the living standards of its citizens.
Despite all recent efforts and liberal reforms, Tanzania is still among the bottom ten percent of the world‟s economies in terms of per capita income, and the country remains overwhelmingly donor-dependent. Annual GDP per capita growth rates were negative in the period before the free elections took place in 1995, but have been positive in all following years. Furthermore, per capita growth rates started escalating at the beginning of the millennium, varying between 2.5 percent and 4.5 percent per annum between 2000 and 2008. Yet, this has not been enough to substantially improve the living standard of average Tanzanians, as reflected in the key indicators reported Table 3.1. The life expectancy at birth is only 56 years, leading to a mean age as low as 18 years. The fertility rate is 5.6 children per woman, and the presence of infectious deceases conduces to an infant mortality of almost 7 percent. HIV prevalence between the ages of 15 and 49 has decreased from 7 percent at the beginning of the millennium to 6 percent in 2007 (WDI, 2010).
Table 3.1
Indicator Measure 1995 2008
National accounts:
GDP per capita, PPP adjusted Current int. US$ 670 1,301
GDP per capita growth % per year 0.5 4.4
Inflation, consumer prices % per year 27.4 10.3
Net ODA received % of GNI 16.9 11.7*
Health indicators:
Fertility rate Births per woman 5.9 5.6
Infant mortality rate Per 1,000 live births 100.2 66.8
Life expectancy at birth years 50 56
Education:
Education expenditure % of GNI 2.4 2.4
Adult literacy rate % of people aged >15 59.1 72.6
School enrolment, primary % gross 68.1 110.2**
School enrolment, secondary % gross 5.3 n/a
Source: The World Bank: World Development Indicators (2010)
*Net ODA received was 17.5 % in 2007.
16 Tanzania has since 2002 made great efforts to provide free primary education to everyone, leading to enrolment rates above 100 percent (Nkosi, 2005; WDI, 2010). Primary education comprises seven compulsory years, while secondary education is optional with normal duration of six years. The enrolment rate in secondary school is assumed to be low relative to primary school, mainly due to relatively high tuition fees (Nkosi, 2005). The literacy rate, defined as people over 15 years that can read Swahili, English or Arabic, has increased from 59 percent in 1995 to 73 percent in 2008, assumingly a consequence of the resources put into primary schooling.
The Tanzanian economy is dominated by agriculture, accounting for more than 45 percent of GDP and employing 75 percent of the work force (WDI, 2010). The industrial sector is on the other hand one of the smallest in Africa, accounting for 17 percent of GDP and only 5 percent of the labour force. Services account for the remaining 37 percent of GDP and occupy 20 percent of Tanzania‟s workers. Correspondingly, the country has a large rural population, and only 26 percent of all Tanzanians live in the urban areas. Like most developing countries however, Tanzania is experiencing rapid city-growth. Since 1995, the urban population increased by an average rate of 4.4 percent per year, compared to an average population growth rate of 2.7 percent per year (WDI, 2010). One consequence has been a rapid increase of the informal employment and hence an enlargement of sectors like wholesale and retail trade, manufacturing and hotels/restaurants, which according to World Bank estimates supplied 58, 14 and 13 percent of all informal jobs in 2006 (Lindeboom & Muzzini, 2008). In addition, urban agriculture has evolved as a household level initiative, employing 38 percent of urban work force and accounting for 20 percent of urban income (Lindeboom & Muzzini, 2008). Despite a higher degree of both informal employment and unemployment in urban areas, the average income is higher than it is in rural areas.6
Tanzania‟s largest and fastest growing city, Dar es Salaam, currently accommodate 2.7 million people and receives 175 000 new households every year (Lindeboom & Muzzini, 2008). The city has been leading the process of urbanisation in Tanzania, and is expected to double its population by 2020 (CIA, 2010). The capital was moved from Dar es Salaam to Dodoma in 1973, but Dar es Salaam is still the most important administrative and economic
6 Unemployment in urban areas was about four times higher [31 percent] than in rural areas [8.3 percent] in
2006. In the same year, the city of Dar es Salaam had almost half a million unemployed people (Lindeboom & Muzzini 2008).
17 province in Tanzania. It functions as the hub of Tanzania‟s main transportation systems, holds the chief port, and serves as Tanzania‟s industrial, commercial and financial centre. The city accounts for high concentrations of trade, services and manufacturing compared to other parts of Tanzania, and about one half of Tanzania's manufacturing employment is located here (Lindeboom & Muzzini, 2008).
3.2
S
MALLB
USINESSE
NTREPRENEURSHIP INT
ANZANIAIn line with the urbanisation process, the number of street vendors has been increasing throughout all the major cities of Tanzania, and especially in Dar es Salaam, where the street vendor population in 2007 was estimated to 700,000 (Lyons & Msoka, 2010). A majority of Tanzania‟s micro and small enterprises [MSEs] are informal, meaning that they have no government registration and do not pay tax.7 This is in particular true for the microenterprises, defined as the MSEs with ten or fewer employees (Lyons & Msoka, 2010).8 Most of the microenterprises serve the purpose of so-called self-employment, where the owner functions as both manager and worker. The owner may be an individual, a small group of individuals or a household, and prospective employees are in many cases unpaid family members or people employed in the household of the owner. Many households engage in this sector as a secondary activity to supplement their income from formal employment, while other households completely rely on income from one or more microenterprises.
The microenterprises take part in diverse sectors, like retail and wholesale trade, food and beverage processing, personal and business services, and manufacturing of clothes and other products. Some entrepreneurs operate their enterprises from their respective homes, others own or rent a business stall, whereas a segment runs their microenterprise without any permanent business location. During the interviews, we learned that a majority of the entrepreneurs engage in some sort of commerce activity, selling a huge variety of products. The market for services comprises enterprises like hairdressing and beauty saloons, transport, catering and a various selection of small restaurants, bars and cafés preparing snacks, breakfast, lunch and dinner. There are also numerous of tailors and embroiderers
7 The Institute for Liberty and Democracy [ILD] estimated that 59 percent of small businesses in Dar-es-Salaam
were informal in terms of legal status in 2005. See Ishengoma and Kappel (2006) and Levenson and Maloney (1988) for extensive discussion on the definition of informal sector. Tokman (2001) defines the informal sector as comprising firms with limited ownership that utilise unpaid family members, domestic servants, less educated employees, and have less than five workers, including the owner. Loayza (1997) views the sector as a set of economic units that do not comply totally or partially with government regulations.
8 According to EU legislations, MSEs are defined as income-generating activities employing 50 or fewer
18 manufacturing clothes, constructors of bricks, wells and houses and landlords renting out premises for business or rooms for accommodation. Although Dar es Salaam has a relatively small agricultural sector, only representing about 2 percent of the generated income, a number of urban households are also engaged in production of vegetables, milk, meat and eggs, and thereby utilise their location close to the ready market for agricultural products (Lindeboom & Muzzini, 2008).
Common for microenterprises in Dar es Salaam is their utilisation of local resources and equipment. This local interaction is mainly caused by the low quality of infrastructure, combined with costly transportation of commodities as well as poor storage and preservation. As a consequence, entrepreneurs usually purchase raw materials from producers in the neighbourhood, leading to closer social connections and confidence between business partners and customers. The practice of informal transactions are reflected in the lack of receipts to costumers and written contracts between business partners.
3.2.1 BUSINESS OBSTACLES
Poor infrastructure is just one of the many obstacles faced by current and potential entrepreneurs in Tanzania. Of great relevance to this master thesis, and perhaps the most important obstacles of the micro entrepreneurs in Dar es Salaam, are their poor levels of both financial and human capital. Leonard and Mfaume (2004) suggests that most micro entrepreneurs in Dar es Salaam lack the education needed to find alternative formal employment and that a majority see entrepreneurship as a last resort to earn a livelihood. Ishengoma and Kappel (2006) underline the heterogeneity of micro entrepreneurs, but describe a substantial segment as poor people with low education and low level of skills. In our sample of micro entrepreneurs, everyone except from three interviewees answered that they have at least finished primary school. However, this is also the education level of the median interviewee, reflecting that the investment in human capital is scarce among the majority of the micro entrepreneurs. The combination of extensive financial and human capital constraints, prevent entrepreneurs from optimisation of current businesses and future growth, especially because it makes them less capable to overcome the regulative barriers discussed in the following.
The World Bank‟s project “Doing Business” identifies regulative obstacles in the formal business environment, with implications for small-scale entrepreneurs intending enter the formal economy. Table 3.2 presents relevant Doing Business indicators for Tanzania, and
19 confirms the presence of regulations that require both extensive financial and human capital to cope with. Of particular interest are those regulations that directly affect the barriers of entry: Thirteen compulsory start-up procedures that include among others business registration and applications for operating licence, tax number and VAT certificate with the Tanzania Revenue Authority. Although the cost of start-up procedures has decreased with more than 80 percent since 2003, the remaining cost still represents 37 percent of average annual individual income. This indicates that the regulative environment is a significant barrier for entrepreneurs that wish to expand or establish businesses. Among the entrepreneurs in our sample, only 20 percent report to be registered with a government authority or to hold an operating licence. Moreover 37 percent claim that taxes and government regulations represent a serious obstacle to their business.
3.2.2 MICROFINANCE
Ishengoma and Kappel (2006) argue that the level of financial capital of most micro enterprises in Tanzania is insufficient to give suppliers credit and to do necessary investments, and that the poorest micro entrepreneurs lack financing even for working capital. These findings seem to be in line with our own observations of microenterprises in Dar-es-Salaam, where the plot sizes are minimal and the equipment used is outdated and inefficient. Two illustrations of this is the tailor using a coal ironer on a white wedding dress and the restaurant owner cooking rice and beans by help of firewood. In this matter, microfinance can represent a possibility for micro entrepreneurs in Tanzania to increase their business capital.
Table 3.2
Indicator Measure 2003 2006 2008 Business start-ups:
Cost of business start-up procedures % of GNI per capita 200 92 37 Start-up procedures to register a business Number 13 13 12
Time required to start a business Days 31 30 29
Time required to obtain a business license Days 14 16 n/a
Property:
Procedures to register property Number n/a 9 9
Time required to register property Days n/a 77 73
Management time dealing with officials % of management time 14.4 4.0 n/a
Tax:
Tax payments Number n/a 47 48
Time to prepare and pay taxes Hours n/a 172 172
Business meetings with tax officials Number 13.1 2.7 n/a Informal payments to public officials % of businesses 31.0 49.5 n/a Source: The World Bank: World Development Indicators (2010)
20 In 2008, Tanzania had ten MFIs reporting to the Microfinance Information Exchange [MIX]. This comprised 270,077 active borrowers with a combined loan portfolio of US$ 77 million (CGAP & MIX, 2010). According to the Sub-Saharan Africa 2009 Microfinance Analysis and Benchmarking Report, almost 80 percent of MFI lending in Tanzania are directed towards enterprises, while approximately 20 percent are consumption loans. In practise however, parts of the loans intended for business purposes are likely to be spent on household consume. This is evident in our dataset, where less than 60 percent of the microfinance loans are injected to the business operations. Considerable amounts are spent on household investments and school fees or put away for savings. The observation can reflect that the business capital constraint is less severe than anticipated, or it can be interpreted to reflect that the micro entrepreneur faces severe capital constraints in his personal finances as well as in his business finances.
3.3
PRIDE
T
ANZANIAPRIDE Tanzania Limited is a microfinance institution [MFI] involved in the provision of credit and saving access to small entrepreneurs in Tanzania (PRIDE, 2005), and membership in this MFI is the common feature of all the micro entrepreneurs in our sample.9 The MFI was incorporated in May 1993, and started its operations as a pilot January 1, 1994 with branches in Arusha, Tanga and Dar es Salaam. After a significant expansion, PRIDE Tanzania consists today of 38 branches with main office in Arusha. The number of active borrowers has increased from 21,000 in 1998 to 106,000 in 2008, and positions PRIDE Tanzania as the MFI with the most borrowers in the country. It is the second largest MFI in terms of gross loan portfolio, amounting to US$ 27,900,000 (MIX, 2010).10 The loan loss rate was zero in 2008 and has traditionally been very low.
PRIDE‟s customer base is mainly comprised of small and medium entrepreneurs with a capital stock worth less than US$ 700. PRIDE offers different types of loans, ranging from kTS11 50 to kTS 15 000, of which interest rates are based on the loan terms and loan size. The MEC Loan is the most common loan product offered by PRIDE, with loan sizes ranging from kTS 100 to kTS 1,000.
9
PRIDE is an abridgment for Promotion of Rural Initiative and Development Enterprises.
10 Akiba reported the largest gross loan portfolio, amounting to USD 31,200,000 (MIX, 2010).
11 All numbers are given in Tanzanian Shillings. In this paper, we have converted the Tanzanian Shillings (TZS)
21 3.3.1 GROUPS, RECRUITMENT AND THE LOAN APPLICATION PROCESS
The MEC loan is organised in a similar way as the Grameen model, meaning that clients must join or create an Enterprise Group [EG] with up to four other members in order to enter the MFI and to qualify for this type of loan. The five members of an EG are accountable for each other‟s loans, so if one member defaults on a weekly loan repayment, the other four members are responsible for covering for him. Furthermore, each EG is organised in a Market Enterprise Group [MEC], consisting of 10 EGs and thus 50 clients. The PRIDE branches has on average 160 MECs, which all have one weekly meeting lasting for one hour.
PRIDE leaves every MEC to administrate itself through the electing of its own chairman, treasurer and secretary. The chairman is responsible for leading the weekly meeting and is normally elected for one year. While the secretary records the payments, the treasurer collects the money from every client and brings it to the PRIDE cashier at the end of the meeting. The management of every MEC is responsible for recruiting new EGs if any of the existing EGs exit the MEC. However, if a client exits the MEC, the responsibility of finding a new client lies within the management of the respective EG, consisting of a chairman and a secretary. When a suitable client is suggested by the EG, he needs to be approved by the MEC: Three representatives, appointed by the MEC and independent of the EG, will then inspect the business enterprise. Under normal circumstances, PRIDE will accept a client and his loan application if it has been approved by the MEC.
The demand for loans at PRIDE is high, something we observed ourselves when visiting PRIDE‟s Magomeni branch in Dar es Salaam June 2009: Hopeful entrepreneurs waited in line outside the PRIDE branch, impatient to hear news of available spots in a MEC looking for new members.12
Access to a MEC Loan is also subject to a minimum loan insurance balance equal to 25 percent of the total loan amount, except for the first loan cycle. This loan insurance scheme is established and built up by compulsory weekly savings contributions of at least kTS 2.13 Hence, clients qualify for higher loan levels as the total saving balance increases. MEC loans
12
PRIDE has mainly two different entry channels: (i) An Enterprise Group [EG] is missing one member and must find a replacement. (ii) An EG is empty due to exit, so the MEC must find an EG or hope that entrepreneurs willing to enter PRIDE will form their own group of 5.
13 Savings earn interest through a semi annual “bonus”. Clients are allowed to contribute with more than kTS 2
22 are divided into five different levels, all listed in Table 3.3 together with the corresponding saving balance necessary to reach these loan levels.
Table 3.3
Level Maximum loan ceiling Minimum savings balance
1 kTS 200 kTS 50
2 kTS 400 kTS 100
3 kTS 600 kTS 150
4 kTS 1,000 kTS 250
Fahari14 kTS 2,000 – 15,000
Through compulsory saving contribution, PRIDE do not only reduce its risk form defaults, but increases its access to funding with respect to future lending possibilities.
ADMINISTRATION OF REPAYMENT
The weekly MEC loan meetings takes place at a PRIDE branch and is estimated to last for one hour. The weekly client contribution consists of interest payment and loan repayment, in addition to the compulsory savings contribution. Table 3.4 illustrates the weekly cash flow from clients to PRIDE with respect to the different loan levels. For all clients that follow the normal weekly savings scheme, total saving will at the end of the first cycle equal the minimum loan insurance scheme of kTS 50 required to apply for a new loan of kTS 200. After the second cycle they will qualify for the second loan level of kTS 400 and so on. To meet the savings requirements at an earlier point in time, clients may also contribute with more than the mandatory savings.
Table 3.4
Loan menu Terms of repayment
Interest rate Weekly interest Weekly savings Loan repayment Total weekly contribution kTS 200 25 30% kTS 1,2 kTS 2 kTS 8 kTS 11,2 kTS 400 50 30% kTS 2,4 kTS 2 kTS 8 kTS 12,4 kTS 600 50 30% kTS 3,6 kTS 2 kTS 12 kTS 17,6 kTS 1,000 50 28% kTS 5,6 kTS 2 kTS 20 kTS 27,1
The MEC group represent the second layer of security against defaulters, and is held responsible by PRIDE to cover the weekly contribution if one of the EGs fails to repay. Thus, the 50 MEC members must remain at the PRIDE building until the weekly contribution is collected. It is not uncommon that MEC meeting last far longer than the estimated one hour, and clients must borrow from each other or call for relatives and friends to bring money to the PRIDE branch where the meeting takes place.
14 The Fahari Loan Product is provided to EGs with clients that are able to guaranty their loans though holding
23
4.
R
ESEARCHP
ROFILEThis chapter describes the implementation of the research project in Tanzania, “Teaching Entrepreneurship to Microfinance Clients: Financial and Human Capital for Development”, which makes the basis of this master thesis. Further, it seeks to describe the data collected before and after the programme intervention; the data collection procedure; and the main explanatory variables in the dataset. Finally, it brings into attention the methodology behind the research design, and discusses whether the methodical implications have been carried out in practice.
4.1 THE INTERVENTIONS
The interventions comprise into a business-training programme and a cash transfer [business grant], implemented as a randomised field experiment in Dar es Salaam, Tanzania, during 2008 and 2009. The participants in the experiment were all members of the major MFI in the country, PRIDE Tanzania. A description of the practical implementation of the interventions follows.
THE BUSINESS-TRAINING PROGRAMME
In august 2008, 319 PRIDE clients were given the opportunity to participate in a tuition-free business-training programme customised for micro entrepreneurs. The programme consisted of 21 lectures, each lasting for 45 minutes and taking place at the MFI branch immediately after the weekly loan meeting. Participation in the training programme was fully optional, but only clients taking part in ten or more lectures were awarded a course diploma at the graduation ceremony held in January 2009.15 The average attendance was 70 percent, and 83 percent of all clients were qualified for the course diploma. Entry control was strict and attendance was monitored carefully by lecturers and PRIDE officers (Berge et al., 2010). The business-training programme was designed and implemented by lecturers from University of Dar es Salaam Entrepreneurship Centre [UDEC], and aimed to create business growth among the participants. The lectures were given in Swahili, and the approach was practically oriented by making use of real-life examples to illustrate theoretical aspects of business management (Berge et al, 2010). Table 4.1 gives an overview of the topics covered in the programme:
15 The requirement for graduation was announced at an early stage in order to motivate for participation.
Moreover, absent clients were contacted in order to increase the probability of their attendance in the following lecture. In some cases, all clients were reminded about forthcoming lectures (Berge et al., 2010).
24 Table 4.1
Topics
I Entrepreneurship and Entrepreneurial Character
II Developing an entrepreneurial behaviour
III Importance of long-term view and orientation in the business IV Identification of creative business ideas
V Understanding of business environment
VI Planning for your business
VII Understanding of the market for your business VIII Marketing strategies/techniques for your business
IX Improving customer service
X Pillars of good customer service XI Managing people in your business XII How to get good workers
XIII Allocating responsibilities and appraising employee performance
XIV Keeping business records XV Costing and pricing XVI Managing working capital
XVII Sources of finance for small businesses
THE BUSINESS GRANT
A subsample of clients, comprised of 126 of those who received training and 126 of those who did not, were given a cash transfer of kTS 100. The amount was intended for business use, and equal to the estimated marginal cost of business training. Clients who received the business grant were made aware of its objective, and provided with a form to keep track of their spending of the grant. Out of the 252 clients offered the business grant, 247 actually went to collect it.
4.2 DATA AND EXPLANATORY VARIABLES
Two comprehensive surveys and a lab experiment were conducted in Dar es Salaam in order to evaluate the effect of the programme interventions. This section explains briefly how the surveys were carried out, and describes the information and main explanatory variables available in the dataset.
4.2.1 THE DATA COLLECTION PROCESS
A baseline survey was conducted in June-July 2008, before the business-training programme was launched in August the same year. In March 2009, approximately six weeks after the
25 business training was completed, a lab experiment was conducted among the subsample of clients who received business grants.16 The follow-up survey took place in June-August 2009, covering 530 out of the 644 baseline clients.
The baseline survey focused on background information about the clients as well as main outcome variables, such as business performance and household indicators. The follow-up survey was somewhat more comprehensive than the baseline survey through focusing on a broader range of outcome variables, such as loan usage and investments for business and household. The lab experiment focused on the clients‟ abilities and preferences towards risk, time, and competition, and whether these outcome variables had changed as a result of business training.
Both the baseline survey and the follow-up survey were carried out in the same manner: The interviews were conducted in Swahili by teams consisting of one research assistant and one translator.17 Normally, appointments for interviews had been made one day ahead, and in most cases the interview took place at one of the interviewees‟ business premises. Locating the clients and their enterprises turned out to be a major challenge, especially in the baseline survey.18 A crucial point in the follow-up survey was the reduced willingness among clients to participate. This was contributing to the fact that 114 baseline clients were not interviewed in the follow-up survey.19
An overall struggle in the surveys was to capture accurate measurements of the relevant outcome variables, such as revenues, expenses, profits, investments and changes in working capital. Poor level of knowledge and transparency, often resulting from insufficient record
16 While 252 clients were invited to the lab experiment, 211 actually did attend the lab.
17 The team composition changed from one day to the next, mainly to avoid repeated mistakes among the
interviewers, and thus a team bias in the dataset.
18 The lack of street names in most of Dar es Salaam is an important explanation to the localisation challenges.
The problem was reduced when we carried out the follow-up survey, much because it was possible to make use of reference points conducted in the baseline survey.
19 Participation in the survey was voluntary and unpaid. With the interviewees being self-employed, participation
would often mean absence from enterprise operations. Lack of willingness to participate was especially present among clients that had neither been offered training nor the business grant. Also entrepreneurs that had dropped out of PRIDE seemed to have low willingness to participate in the survey. These effects make us suspect an attrition bias, where it is systematic differences between those reached in 2008 and those not reached in 2009. According to Berge et al. (2010), there are no systematic differences on sales and profits for men, while females that were not reached in 2009 appeared to have relatively higher sales and profits. In the analyses in chapter 5, we take into account these potential and undesired effects by making use of a panel of control variables, endeavouring to control for initial differences between the groups.
26 keeping, made this a substantial challenge.20 However, these kinds of obstacles are typical in a field research setting, and de Mel, McKenzie and Woodruff (2009) discuss in particular the difficulties of capturing accurate numbers microenterprises in developing countries.
4.2.2THE DATASET
The baseline survey together with the follow-up survey provides a comprehensive panel dataset with a diverse collection of variables. First of all, the dataset gives basic information about the client, such as personal data and their PRIDE attributes, in addition to characteristics of family and household. This includes variables like marital status, education, size of household, number of children and number of children still living with the client. Every client is assigned a unique identification code that reveals whether he have been offered business training. Together with a variable indicating whether the client has received the business grant, there is sufficient information to put everyone in one of four groups in terms of treatment status.21
Further, the dataset comprise a large quantity of the essential variables related to the client‟s business activities. The section looks into business records and documentation, scale and profits of business operations in addition to general business practice, such as investment behaviour. Many clients run several businesses, and all these are included in the dataset. A business is defined as a physical business location and/or a distinct activity. In that matter, a client is operating multiple enterprises if he has business activities from more than one location, or if he runs a variety of business activities from the same location. For example, a hairdresser selling soda in addition to hair dressing services from her saloon is treated as owner of two separate enterprises. Similarly, she is considered owner of two separate businesses if she operates two hairdressing saloons at different locations. The degree of business formality is captured by indicators of whether or not the businesses are registered or licensed by a government agency.
Every business is classified as commerce, service, manufacturing or agriculture.22 The dataset includes variables counting the number of businesses within each sector. Businesses classified
20 We have few reasons to believe that the data quality is unequally distributed between clients subject to
intervention and clients that were not subjected to intervention. We assume that the margins of error are normally distributed across the sample, therefore not causing bias in the estimates.
21
A careful explanation of the four treatment groups are provided in section 4.3.2
22 The agriculture classification was added in the follow-up survey. In the baseline questionnaire, most of the
agriculture businesses were classified as “other sector” or manufacturing. We have constructed an agriculture classification also for the baseline survey, removed the “other sector” classification in both the baseline and the follow-up survey, and reclassified these businesses to commerce, service, manufacturing or agriculture. With
27 as commerce deals with the buying and selling of products. Common enterprises within this sector are mobile street sellers offering products like shoes, phone credit, newspapers and DVDs; households selling water from their well; and market stalls or small kiosks selling a variety of products, such as grocery, fruits and vegetables, charcoal, medicines, spare parts or second-hand clothes. Service businesses are typically small restaurants and bars, catering and food preparation, hairdressers, repairs services and taxi drivers. Manufacturing enterprises uses machines, tools and labour to make products for sale. The sector includes enterprises such as tailoring, embroidering, construction of houses and wells, production of bricks and making of wigs. Agriculture is production of goods through farming. Common agriculture products are chickens, eggs, vegetables, animal food, milk and goat meat.
Information concerning the scale and profits of the business operations are collected separately for every business where the clients consider themselves the main decision maker.23 The variables are later summarised for all the businesses belonging to the individual client, so that one observation in the dataset corresponds to one client. The most important data from this section are those related to the business accounts, including daily and monthly sales and costs, and profits calculated on basis of these numbers.24 An alternative variable to the calculated profit is the stated profit, which is the client‟s personal estimate of daily and monthly profits from the business. In cases where the client shares the business with someone outside the household, both the individual profits accruing to the client, and the profits from the full business operation are calculated.25 Moreover, there are variables reporting the
few exceptions, this means that producers of agricultural products and landlords have been moved from “other sector” to agriculture and service. To improve the consistency of the panel, we have made corrections if the same business has been classified differently in the baseline survey and the follow-up survey. Principally, (and in exception of obvious cases of classification mistakes in the follow-up survey) we have complied with the practice in the follow-up survey, and changed the classifications in baseline. This has resulted in the reclassification of especially tailors, where a majority was classified as service in the baseline.
23
For instance, we did not record businesses owned by client‟s spouse, even if the client were working every week in the respective enterprise.
24 The calculation of profits was made in a careful process of tracking the sales and costs in all businesses where
the client was main decision maker. Dependent on the nature of the business operations and the understanding of the client, we asked about either monthly or daily figures and calculated the other measure. We asked the client about his sales on a “normal business day/month this time of year”, and his costs associated with this sale. To capture all relevant costs, we asked separate questions about pay for goods and raw material, compensation to employees, transport cost, electricity, phone bills related to business activity, water and waste disposal and other costs such as market fee or security.
25 Separating individual profits for the entrepreneur and total profits for all business partners was the practice in
the follow-up survey. Less attention was paid this element in the baseline survey, and consequently we have only one profit term in this dimension from 2008. Differences between total and individual profits calculated in the follow-up survey are nevertheless infrequent, by reason of the rarity of non-household business partners.
28 number of business days per month,26 quality of business accounts, client‟s working hours per week and number of employees in the business.
Throughout the analyses in chapter 5, profit is defined as the calculated27 operating profit accruing to the entrepreneur from all his businesses. By operating profit, we mean profit from the business operations, excluding capital cost and payment of rent for the business premise.28 This implies that the reported figures do not reveal the extent to which variations in profits come along with variations in these costs. If certain businesses have relatively high capital and land costs, profits will appear higher relative to the profits in businesses where these costs are low. The client‟s perception of the amount he is left with is probably dependent on his effort put into the production – another cost that is not reflected in this figure. We address this issue by performing analyses also on profits per working hour. The results in the analyses in chapter 5 are however robust to a variety of expressions of profit and profit per working hour. These include stated profit, and other profit concepts such as profits accruing to all partners of the businesses or profit net of interest payment on the PRIDE loan.
The two surveys include records of the date of establishment for all businesses. On basis of this, we have constructed a variable indicating whether the client has opened any of his businesses in the period between the end of the baseline survey in August 2008, and the date of interview in the 2009 Follow-up survey. The clients also report whether they have closed one or more enterprises in the same period. All businesses are taken into account, regardless of whether they have positive sales or not. This practise contrasts to the practise of reporting
26 A full business month is assumed to be 30 days. A business that is closed one day per week is considered to
have 26 business days p