Hitotsubashi University Repository
Title
Impact of Foreign Tourists on Productivity in the
Accommodation Industry : A panel data analysis
Author(s)
Morikawa, Masayuki
Citation
Issue Date
2017-08
Type
Technical Report
Text Version
publisher
URL
http://hdl.handle.net/10086/30544
No. DP 17-012
SSPJ Discussion Paper Series
“Impact of Foreign Tourists on Productivity in the Accommodation Industry:
A panel data analysis”
Masayuki Morikawa
August 2017
Grant-in-Aid for Scientific Research (S) Gran Number 16H06322 Project
Service Sector Productivity in Japan
Institute of Economic Research
Hitotsubashi University
2-1 Naka, Kunitachi, Tokyo, 186-8603 JAPAN
http://sspj.ier.hit-u.ac.jp/
This paper is based on joint research with the Research Institute of Economy, Trade and Industry (RIETI). It has also been published as RIETI Discussion Paper 17-E-106.
1
Impact of Foreign Tourists on Productivity in the Accommodation Industry:
A panel data analysis
∗MORIKAWA Masayuki (RIETI)
Abstract
Recently, the number of foreign tourists visiting Japan has been rapidly increasing, and the overseas travel balance has drastically changed. By using micro panel data, this study empirically analyzes the effects of this increase on productivity in the accommodation industry. The novelty of this study is represented by the use of a physical productivity measure to document an unexplored channel through which service trade contributes to increasing the productivity in the domestic service industry. The estimation results show that an increase in the number of foreign guests significantly improves the measured total factor productivity (TFP) of the accommodation facilities, although the effect of foreign presence is quite heterogeneous across facilities.
Keywords: Foreign tourism, Accommodation industry, TFP, Demand smoothing
JEL Classification: D24, F61, L83
∗ I would like to thank Haruhiko Ando, Shota Araki, Yoshiyuki Arata, Masahisa Fujita, Nobuaki
Hamaguchi, Keisuke Kondo, Yoko Konishi, Tomoya Mori, Atsushi Nakajima, Kentaro Nakajima, Hiroshi Ohashi, Yukiko Saito, Toru Ueno, Isamu Yamauchi, Hongyong Zhang, and the seminar participants at RIETI for their helpful comments and suggestions. Any errors are my own. I am grateful to the Japan Tourism Agency for providing the micro data from the Accommodation Survey used in this study. This research is supported by the JSPS Grants-in-Aid for Scientific Research (B, 26285063).
2
Impact of Foreign Tourists on the Productivity in the Accommodation Industry:
A panel data analysis
1. Introduction
Despite the depreciation of the Japanese yen begun in the second half of 2012, the export volume of manufactured products has been sluggish. On the contrary, services exports have grown rapidly. Based on the quarterly estimates of GDP of the Cabinet Office, the seasonally adjusted real goods exports grew by 7% only between 2011 and 2016; however, services exports in real terms grew by more than 60% over the same period (Figure 1). Specifically, the number of foreign tourists has increased significantly, helping improve Japan’s overseas travel balance. According to the Balance of Payments provided by the Ministry of Finance and the Bank of Japan, while Japan’s net travel balance has been in deficit for a long time mainly due to the numerous overseas travels by Japanese individuals, the balance in fiscal year 2014 turned to a surplus for the first time after 55 years (column (1) of Table 1). The yen depreciation has contributed to the increasing number of foreign tourists, because the elasticity of the number of travelers to the exchange rate is high.1
At the same time, expanding the number of foreign tourists to Japan has been a key pillar of the government’s economic growth strategy. The 2013 Japan Revitalization Strategy aimed to attract 20 million foreign tourists to Japan, and get to more than 30 million by 2030. However, the actual number of visitors has increased more than government expectations. According to the Japan National Tourism Organization, more than 24 million foreign tourists visited Japan in 2016, with an average growth rate exceeding 30% on an annual basis since 2011 (column (2) of Table 1). The 2016 Japan Revitalization Strategy revised the target upward to 40 million by 2020 and 60 million by 2030.
In parallel, the total number of foreigner guest-nights in accommodation facilities increased rapidly from about 18 million in 2011 to about 71 million in 2016 (column (3) of Table 1). Since
about 30% of the consumption expenditure by foreign tourists in Japan is for accommodation, the industry benefits greatly from the increasing number of foreign tourists in terms of occupancy
3
rate,in addition to simple demand creation effects through temporal smoothing of guest-nights. According to the Accommodation Survey of the Japan Tourism Agency, the room occupancy rate of city and business hotels in 2015 were 79.2% and 74.2%, respectively. Both these rates are more than 10% higher than the rates five years before. As a result of tightened capacity constraints, in 2016 hotel fees were 33% higher than in 2011 (Services Producer Price Index (SPPI), Bank of Japan).
Similarly to other service industries, the accommodation industry is characterized by simultaneous production and consumption, and the occupancy rate strongly determines profitability and productivity. Firms make efforts to smooth demand through dynamic pricing strategies and advertisement campaigns; however, it is extremely difficult to obtain a fully smooth demand. In this respect, an advantage of having foreign guests is that their accommodation patterns differ from those of Japanese guests.
If the temporal accommodation patterns of non-Japanese guests were the same as those of Japanese ones, it would be necessary to increase capacity to satisfy peak demand, which in the medium- to long-term would decrease and offset the positive impact of foreign guests on occupancy rates. If the size of facilities and the number of employees stay constant, foreign guests may simply crowd out Japanese ones. However, in practice, while Japanese tourists concentrate over long weekends including national holidays, foreign ones are unaffected by Japan’s national holidays. Looking at seasonality, guest-nights of Japanese exhibit a high peak in August, while those of foreign tourists have small peaks in April, July, and October (Figure 2). As a result, monthly volatilities (standard deviations) of guest-nights of Japanese and non-Japanese visitors calculated from the Accommodation Survey (with the annual average guest-nights set to one) are 0.137 and 0.122, respectively; the figure for total guests is 0.127, which is smaller than that for Japanese guests only.2 From our estimations, it emerges that an increase in the ratio of foreigner
guests is associated with less volatile capacity utilization rate at facility level. Therefore, the demand-smoothing channel could have a positive effect on occupancy rates of accommodation facilities.
By using facility-level panel data from the Accommodation Survey containing information on the number of guest-nights, number of employees, and physical capacities, this study estimates production functions to analyze the effects of foreign tourists on the productivity in the
4
accommodation industry. Although the impacts of international trade on domestic productivity have been widely studied both theoretically and empirically (see Greenaway and Kneller, 2007; Wagner, 2007; Hayakawa et al., 2012; Melitz and Redding, 2014; De Loecker and Goldberg, 2014, for surveys), we investigate an unexplored channel through which services trade enhances the productivity of the domestic service industry.
Another contribution of this study is the use of quantitative data on inputs and outputs to measure the physical productivity (TFPQ) of the service industry.The distinction between a physical measure of TFP (TFPQ) and revenue-based one (TFPR) has been attracting researchers’ attention since the work by Foster et al. (2008), which analyzes the establishment-level productivity distribution of narrowly-defined manufacturing products in the United States. Other studies measuring TFPQ for manufacturing industries include Kawakami et al. (2011), Smeets and Warzynski (2013), Atalay (2014), and Braguinsky et al. (2015). However, studies measuring TFPQ in the service industry are scarce.3
In empirical studies on firm- or establishment-level productivity, regional variation or time-series volatility of service prices often impede accurate measurement. For example, as previously mentioned, average hotel fees in Japan have increased by more than 30% over the past five years, but the actual price changes vary across facilities. In practice, it is very difficult to adjust establishment-level prices to construct real output measures of individual producers. By using physical measures, we can avoid this problem.
The key result of this study is that an increase in the ratio of foreign visitors significantly improves the measured TFPQ of accommodation facilities. This is obtained by instrumental variable fixed-effects (FEIV) estimations, which account for unobservable facility characteristics such as the quality of accommodation services, as well as for the endogeneity of the ratio of foreigner guest-nights. Overall, the average accommodation industry productivity improved over the past five years. However, the benefits from the increase in the number of foreign tourists are not equally distributed among the accommodation facilities.
The rest of this paper is organized as follows. Section 2 provides an overview of the Accommodation Survey used in this study, and explains the method of analysis. Section 3 describes the estimation results about the effects of foreigner guest-nights on the accommodation industry TFP. Section 4 concludes with policy implications.
3 The works by Morikawa (2011, 2012) are a rare example of estimation of TFPQ in personal service
5
2. Data and Method of Analysis
This study uses monthly micro data from the Accommodation Survey over the period January 2011 to May 2016 to build a panel dataset at facility level. The purpose of the survey is to track the actual conditions of accommodations throughout Japan and to provide basic data for tourism policy planning. In earlier years, the survey only covered accommodation facilities with at least 10 employees, but its scope was expanded in April 2010 to cover all accommodation facilities, independently of the number of employees. As a result, the number of facilities in the sample currently exceeds 10 thousand. However, a sampling-style survey is conducted for small facilities rather than a census-style one. Specifically, one-third of facilities with five to nine employees and one-ninth of facilities with fewer than five employees are sampled.
The main survey items include type of facility (ryokan-inn, resort hotel, business hotel, city hotel, etc.), number of rooms, accommodating capacity (maximum number of guests), number of employees, total number of guest-nights, total foreigner guest-nights, and number of guest rooms used. The total number of guest-nights is defined as the “aggregate number of guests each day during the month,” while foreign guests are “guests who do not maintain a residence in Japan.” Note that the number of employees includes both regular and non-regular employees.
Although the survey is conducted monthly, only January figures of the number of rooms, capacity, and number of employees are reported. Therefore, unfortunately, information on monthly variation is unavailable. Since the number of employees and of usable rooms prepared may be likely adjusted in accordance with the seasonal fluctuations in the number of guests, the inputs of busy months may be underestimated, while the corresponding productivity may be overestimated. In order to deal with this possible bias, we check the robustness of the baseline results by using January data only.
First, we use the panel dataset to estimate simple Cobb-Douglas production functions. The dependent variable is the daily guest-nights of facility i at time t (guest-nightsit), calculated as the
total number of guest-nights divided by the number of days in the month. The explanatory variables include the number of employees (employeesit) and the accommodating capacity of the
6
functions to be estimated can be expressed as follows:4
ln guest-nightsit = α+β1 ln employeesit+β2 ln capacityit+ ε. (1)
Since the production technology may differ by facility type, we run separate estimations for 1) ryokan-inns, 2) resort hotels, 3) business hotels, and 4) city hotels. When pooling all facilities, facility type dummies are included as control variables.5 Then, we calculate the TFP as the
residual of the estimated production functions to observe the distribution of the TFP by type of accommodation facility.
Subsequently, we analyze the impact of foreigner guests on the measured productivity, where the estimated TFP is the dependent variable and the ratio of foreigner guest-nights (ratio of foreigner guestsit) is the explanatory variable.
As previously mentioned, we use physical (quantity) measures of inputs and output, which are unaffected by price differentials among facilities and seasonal price changes, which makes it unnecessary to use a price deflator to obtain real values. However, the measured physical TFP does not take into account differences in the quality of services across facilities. Since production functions are estimated by facility type, the average difference in services, such as between business hotels and city hotels, is accounted for. However, even within the same facility type, there may be large differences in service quality.
In order to deal with potential quality differences, facility fixed effects (γi) as well as time fixed effects (γt) are included in the estimations. While the former control for time-invariant quality of the facilities, the latter account for macroeconomic shocks common to all facilities. In short, the equation to be estimated can be expressed as follows:
TFPit = α+β1ratio of foreigner guestsit + γi + γt + εit. (2)
However, the ratio of foreigner guest-nights, that is, the main variable of interest, is determined endogenously with the total guest-nights, which is the dependent variable of the first-stage
4 We also conducted separate estimations using the number of used rooms as dependent variable and
the number of rooms as explanatory variable. We obtained essentially similar results.
5 Some facilities included in the survey are not classified into any of the four types of facility (e.g.,
“company-owned facilities”). Different dummies are assigned for these facilities in the pooled estimation.
7
production functions estimations. To deal with this possible endogeneity, we employ instrumental variable estimation (FEIV). The instrument (Region IVit) is constructed as the ratio of foreigner
nights of the same facility type in the region (city or prefecture) after excluding the guest-nights of the facility i (equation (3)):
Region IVit =Σ[Foreignfer guest-nightsjt, -i]/Σ[Total guest-nightsjt, -i]. (3)
The identification assumption behind the use of this instrument is that the variation in the number of foreigners staying in the region (excluding the considered facility) is beyond the control of the individual facility; nonetheless, it may affect the number of foreign guests staying at the facility. For example, the exogenous improvement in the attractiveness or reputation of the region where the considered facility is located is likely to have a positive spillover effect on the facility.
In the baseline estimations, cities (more specifically, cities, towns, and villages) are used as the region’s unit to construct the instrument. However, since a non-negligible number of facilities does not have a peer facility in the same city, the number of usable observations has to be reduced. Therefore, prefectures are used as an alternative geographical unit to check results’ robustness. The major variables and the summary statistics are presented in Table 2. The sample consists of about 730 thousand facility-month observations. Mean and standard deviation of the ratio of foreigner guest-nights are 3.9% and 11.3%, respectively, indicating a large variation among accommodation facilities. The median of the ratio is zero, implying that many facilities still do not benefit from foreign tourism. Looking at facility types, the ratio of foreign guest-nights is relatively high among city hotels (the mean is 12.5%), although the standard deviation is large (17.5%), suggesting large variations in the presence of foreigner guests even within a facility type.
3. Results
3.1. Distribution of Productivity
This subsection briefly presents the findings about the TFP distributions and their changes from 2011 to 2015. The estimated production functions (equation (1)) are reported in Table 3.
8
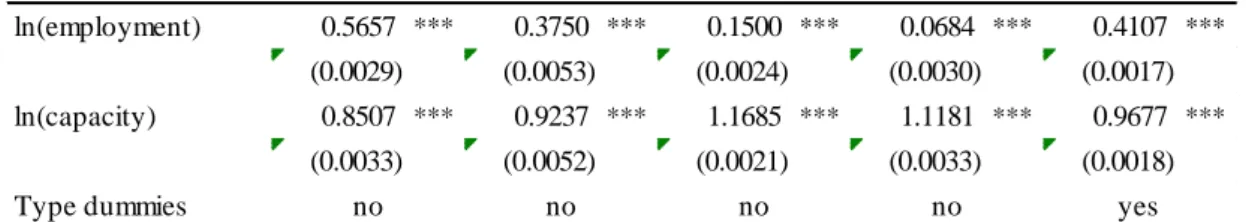
Interestingly, increasing returns to scale are observed in every facility type. The production technologies differ across facility types: while a ryokan-inn is labor intensive, business and city hotels are capital intensive.
Table 4 shows the summary measures of the estimated TFP. It is a well-known stylized fact that productivity is highly dispersed among firms or establishments in the same industry (Syverson, 2011). Our result confirms this empirical regularity in terms of accommodation facilities’ TFPQ. By type of facility, the dispersion is greater for ryokan-inns and resort hotels, while it is relatively small for business and city hotels.
A few studies investigating the dispersion of productivity over business cycles present mixed results (e.g., Kehrig, 2011; Escribano and Stucchi, 2014). However, studies on the cyclical properties of firm- or establishment-level TFP in the service sector have been scarce.6 Figure 3,
starting from the estimated monthly TFP of all accommodation facilities, plots mean (horizontal axis) and dispersion (P90-P10 gap, vertical axis) of TFP. A negative relationship can be clearly observed: dispersion is larger when mean productivity is lower, and vice versa. The correlation coefficients between the mean and dispersion measures (standard deviation and P90-P10 gap, alternatively) of TFP by facility type are reported in Table 5. Without exception, we find large negative correlations. When demand is weak, the productivity performance of facilities diverges, implying that it is important for individual facilities to keep productivity in such periods.
Table 6 presents comparisons of productivity in 2011 and 2015. In addition to the results of the t-tests for the mean differences, the Kolmogorov-Smirnov (K-S) test on the statistical differences in the whole productivity distributions are reported. In percentage terms, the mean productivities in 2015 are around 20% higher than those in 2011, irrespective of the facility type. The results of the Kolmogorov-Smirnov (K-S) test are all statistically significant at the 1% level, indicating that the whole productivity distribution shifted rightward from 2011 to 2015 in every facility type.
Since we do not control for the utilization rate of inputs while estimating the production functions, the measured TFPQ reflects the capacity utilization rates of the accommodation facilities.7 Traditional productivity measurement, mainly focusing on manufacturing sector to
investigate technical efficiency, claims that capital utilization rate adjustments are desirable. However, service industries, characterized by simultaneous production and consumption, do not
6 Morikawa (2017) is a rare study analyzing the cyclical pattern of productivity dispersion in some
service industries (namely movie theaters, golf courses, and golf driving ranges), which indicates that TFP dispersion is lower when aggregated TFP is higher.
9
have inventory; thus, they cannot easily take advantage of production smoothing using inventory as a buffer. Therefore, the capacity utilization rate is the key performance indicator when considering the productivity or profitability of service industries such as airline, taxi, and restaurants.
For example, studies on airlines and trucks indicate that the diffusion of advanced information technology contributes greatly to the productivity performance of these industries through its positive effects on capacity utilization (Hubbard, 2003; Dana and Orlov, 2014). Recent study on ride sharing service, such as Uber and Lyft, indicates that the capacity utilization rate is 30-50% higher for Uber as compared to traditional taxis, partly due to the efficient driver-passenger matching technology (Cramer and Krueger, 2016). These studies interpret the heightened capacity utilization as improved productivity. In the case of productivity analysis in the service industries, it is not necessarily a good strategy to remove capacity utilization, as it is one of the fundamental determinants of performance.
3.2. Foreign Tourists and Productivity
Table 7 reports the FEIV estimation results on the relationship between the ratio of foreigner guests and the measured TFP. As explained in Section 2, the instrument (Region IVit) is defined
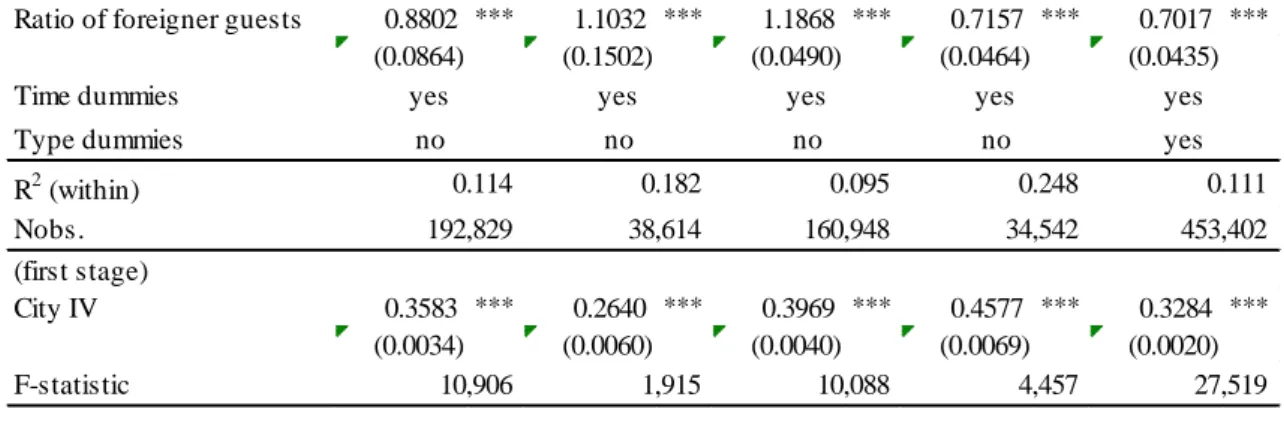
as the ratio of foreigner guest-nights in the region (city or prefecture), excluding the guest-nights of facility i. Panel A shows the result using city as geographical unit to calculate the instruments (City IVit). The first-stage F-statistics are highly significant, indicating the validity of the
instrument. The coefficients for the ratio of foreigner guests in the second-stage regressions are all positive and significant at the 1% level. Thus, when the ratio of foreigner guests increases, the measured TFP of the facility increases as well.
The magnitude of the coefficients differs across types of accommodation facility. The effects of one standard deviation (within standard deviation) higher ratio of foreigner guests are, respectively, 4.5% (all facilities), 5.1% (ryokan-inns), 8.3% (resort hotels), 7.0% (business hotels), and 6.0% (city hotels). Irrespective of the facility type, foreign guests produce a large impact on the measured productivity.
Panel B illustrates the estimation results using prefecture as the geographical unit of the instrument (Prefecture IVit). As explained in Section 2, the number of usable observations
10
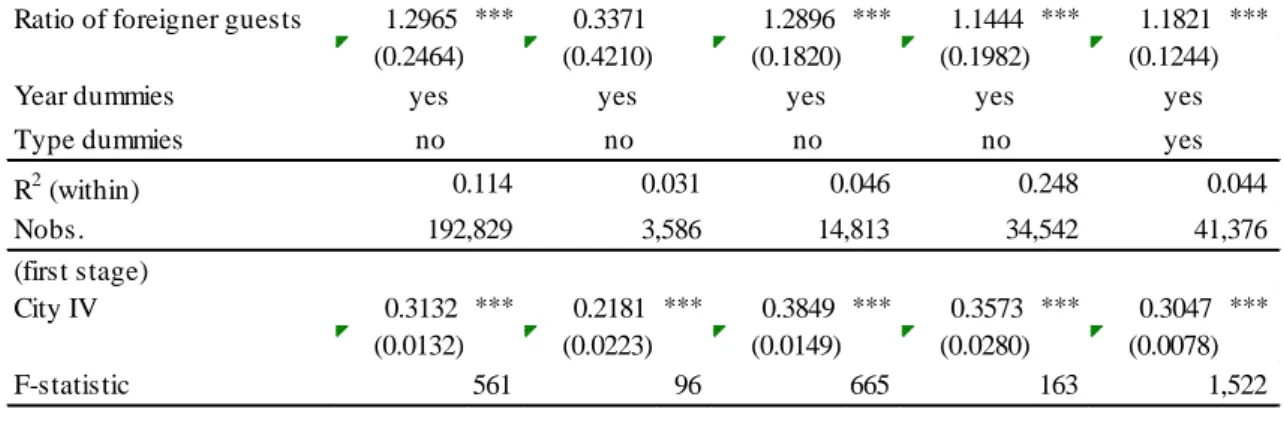
increases in this specification. In the second-stage results, with an exception of resort hotels, the coefficients for the ratio of foreigner guest-nights are positive and significant at the 1% level. As a robustness check, additional regressions are estimated. Since the data on physical capacity and number of employees refer to January, there may be measurement errors, especially with respect to later months in the year. In order to remove this measurement error, estimations using only January data are carried out and reported in Table 8. With the exception of resort hotels using
City IV, the coefficients for the ratio of foreigner guests are positive and significant at the 1% level. The baseline result that foreigner guests positively influence accommodation facilities’ productivity is robust. Interestingly, the magnitude of the estimated coefficients is generally larger than that reported in Table 7. Therefore, it can be inferred that the measurement errors of inputs using all months may understate the true impact of foreign guests on productivity.
4. Conclusion
Using facility-level panel data from the Accommodation Survey over the period January 2011 to May 2016, this paper presents empirical evidence on the impact of increase in foreign guests on the productivity in the accommodation industry. By constructing physical measure of TFP (TFPQ), our study documents an unexplored channel through which services trade contributes positively to domestic productivity.
From our estimations it emerges that an increase in the number of foreign visitors significantly improves the measured TFPQ in the accommodation industry. This result is obtained by instrumental variable fixed-effects (FEIV) estimations, which control for unobservable facility characteristics and possible endogeneity of the ratio of foreign guests. In terms of interpretation, our result provides an indication that foreign tourists do not simply crowd-out Japanese guests, but bring net productivity improvement effects.However, the number of foreign guests differs markedly across facilities: such number has increased greatly in some facilities, while many others still do not have any foreign guest.
The government is eager to increase the number of foreign tourists visiting Japan and, accordingly, has established several policies. Such policies, if effective, may contribute to the productivity performance in the accommodation industry through the demand-smoothing channel, in addition to simply increasing aggregate demand by boosting services exports.
11
References
Atalay, Enghin (2014), “Materials Prices and Productivity,” Journal of the European Economic Association, Vol. 12, No. 3, pp. 575-611.
Braguinsky, Serguey, Atsushi Ohyama, Tetsuji Okazaki, and Chad Syverson (2015), “Acquisitions, Productivity, and Profitability: Evidence from the Japanese Cotton Spinning Industry,” American Economic Review, Vol. 105, No. 7, pp. 2086-2119.
Cramer, Judd and Alan B. Krueger (2016), “Disruptive Change in the Taxi Business: The Case of Uber,” American Economic Review, Vol. 106, No. 5, pp. 177–182.
Dana, James D. Jr. and Eugene Orlov (2014), “Internet Penetration and Capacity Utilization in the US Airline Industry,” American Economic Journal: Microeconomics, Vol. 6, No. 4, pp. 106-137.
De Loecker, Jan and Pinelopi Koujianou Goldberg (2014), “Firm Performance in a Global Market,” Annual Review of Economics, Vol. 6, pp. 201-227.
Escribano, Alvaro and Rodolfo Stucchi (2014), “Does Recession Drive Convergence in Firms’ Productivity? Evidence from Spanish Manufacturing Firms,” Journal of Productivity Analysis, Vol. 41, No. 3, pp. 339-349.
Foster, Lucia, John Haltiwanger, and Chad Syverson (2008), “Reallocation, Firm Turnover, and Efficiency: Selection on Productivity or Profitability?” American Economic Review, Vol. 98, No. 1, pp. 394-425.
Greenaway, David and Richard Kneller (2007), “Firm Heterogeneity, Exporting and Foreign Direct Investment,” Economic Journal, Vol. 117, pp. F134-F161.
Hayakawa, Kazunobu, Tomohiro Machikita, and Fukunari Kimura (2012), “Globalization and Productivity: A Survey of Firm-Level Analysis,” Journal of Economic Surveys, Vol. 26, No. 2, pp. 332-350.
Hubbard, Thomas N. (2003), “Information, Decisions, and Productivity: On-Board Computers and Capacity Utilization in Trucking,” American Economic Review, Vol. 93, No. 4, pp. 1328-1353.
Kawakami, Atsushi, Tsutomu Miyagawa, and Miho Takizawa (2011), “Revisiting Productivity Differences and Firm Turnover: Evidence from Product-based TFP Measures in the Japanese Manufacturing Industries,” RIETI Discussion Paper, 11-E-064.
12
11-15.
Melitz, Marc J. and Stephen J. Redding (2014), “Heterogeneous Firms and Trade,” in Gita Gopinath, Elhanan Helpman and Kenneth Rogoff eds. Handbook of International Economics, Volume 4, Amsterdam: Elsevier, pp. 1-54.
Morikawa, Masayuki (2011), “Economies of Density and Productivity in Service Industries: An Analysis of Personal-Service Industries Based on Establishment-Level Data,” Review of Economics and Statistics, Vol. 93, No. 1, pp. 179-192.
Morikawa, Masayuki (2012), “Demand Fluctuations and Productivity of Service Industries,”
Economics Letters, Vol. 117, No. 1, pp. 256-258.
Morikawa, Masayuki (2016), “Foreign Tourists and Capacity Utilization in the Accommodation Industry,” RIETI Discussion Paper, 16-E-064.
Morikawa, Masayuki (2017), “Dispersion and Volatility of TFPQ in Service Industries,” RIETI Discussion Paper, 17-E-088.
Smeets, Varerie and Frederic Warzynski (2013), “Estimating Productivity with Multi-Product Firms, Pricing Heterogeneity and the Role of International Trade,” Journal of International Economics, Vol. 90, No. 2, pp. 237-244.
Syverson, Chad (2011), “What Determines Productivity?” Journal of Economic Literature, Vol. 49, No. 2, pp. 326–365.
Wagner, Joachim (2007), “Exports and Productivity: A Survey of the Evidence from Firm-level Data,” The World Economy, Vol. 30, No. 1, pp. 60-82.
13
Table 1. Recent trends in overseas travel balance and foreign tourists.
Sources: Balance of Payments (Ministry of Finance and Bank of Japan), Number of Foreign Visitors to Japan (Japan National Tourism Organization), and Accommodation Survey (Agency of Tourism).
Table 2. Major variables and summary statistics.
Note: Own elaboration of micro data from the Accommodation Survey over the period January 2011 to May 2016.
Credit Debt Net Balance
(Billion Yen) (Billion Yen) (Billion Yen) (Million) (Million)
2011 875 2,172 -1,296 6.2 18.4 2012 1,163 2,225 -1,062 8.4 26.3 2013 1,477 2,131 -655 10.4 33.5 2014 1,997 2,042 -44 13.4 44.8 2015 3,024 1,934 1,090 19.7 65.6 2016 3,338 2,011 1,327 24.0 70.9 Annual rate 30.7% -1.5% 31.1% 30.9%
(1) Overseas travel balance (2) Number of
Inbound Travelers
(3) Foreigner Guest-nights
ln(guest-nights) ln(employment) ln(capacity) Ratio of foreigner
guest-nights Ryokan inns 2.440 2.597 4.178 0.024 Resort hotels 3.746 3.578 5.034 0.047 Business hotels 4.110 2.924 4.767 0.043 City hotels 4.695 4.496 5.328 0.125 All types 3.068 2.772 4.401 0.039 Ryokan inns 1.707 1.209 1.005 0.093 Resort hotels 1.587 1.168 1.105 0.126 Business hotels 1.109 0.756 0.776 0.097 City hotels 1.158 1.019 0.916 0.175 All types 1.829 1.259 1.092 0.113 Ryokan inns 2.618 2.708 4.094 0.000 Resort hotels 3.810 3.611 4.977 0.001 Business hotels 4.265 2.890 4.812 0.008 City hotels 4.718 4.575 5.268 0.046 All types 3.333 2.773 4.394 0.000 Mean SD Median
14
Table 3. Production functions estimation results.
Notes: Estimated from the pooled micro data from January 2011 to May 2016. The dependent variable is the log number of daily guest-nights. *** indicates statistical significance at the 1% level.
Table 4. Distributions of the measured TFP.
Note: TFP is calculated from the production functions estimation results presented in Table 3.
Table 5. Correlation coefficients between mean TFP and dispersion.
Note: TFP is calculated from the production functions estimation results presented in Table 3.
ln(employment) 0.5657 *** 0.3750 *** 0.1500 *** 0.0684 *** 0.4107 *** (0.0029) (0.0053) (0.0024) (0.0030) (0.0017) ln(capacity) 0.8507 *** 0.9237 *** 1.1685 *** 1.1181 *** 0.9677 *** (0.0033) (0.0052) (0.0021) (0.0033) (0.0018) Type dummies R2 Nobs. (5) All types yes 0.7794 672,307 0.6984 0.7466 0.7708 0.8548 283,174 66,058 187,590 45,042 (1) Ryokan inns (2) Resort hotels (3) Business
hotels (4) City hotels
no no no no SD P90-P10 p10 p50 p90 Ryokan inns 0.936 2.162 -1.149 0.117 1.013 Resort hotels 0.799 1.748 -0.917 0.108 0.831 Business hotels 0.529 1.087 -0.572 0.084 0.514 City hotels 0.441 0.970 -0.519 0.068 0.451 All types 0.856 1.881 -0.991 0.101 0.889 SD P90-P10 Ryokan inns -0.785 -0.843 Resort hotels -0.836 -0.848 Business hotels -0.793 -0.921 City hotels -0.827 -0.872 All types -0.773 -0.772
15
Table 6. Change in measured TFP, 2011-2015.
Notes: TFP is calculated from the production functions estimation results presented in Table 3. *** indicates statistical significance at the 1% level.
2011 2015 Diff. t-test K-S test
Ryokan inns -0.0859 0.0762 0.1620 *** ***
Resort hotels -0.1075 0.0819 0.1894 *** ***
Business hotels -0.1151 0.0988 0.2139 *** ***
City hotels -0.1102 0.0992 0.2094 *** ***
16
Table 7. Ratio of foreigner guests and TFP (FEIV estimation results). A. City IV
B. Prefecture IV
Notes: The dependent variable is the measured TFP calculated from the production functions estimation results presented in Table 3. The instrument is the ratio of foreigner guest-nights in the city (panel A) or prefecture (panel B) excluding the guest-nights of facility i. ***, **, and * indicate statistical significance at the 1%, 5%, and 10% levels, respectively.
Ratio of foreigner guests 0.8802 *** 1.1032 *** 1.1868 *** 0.7157 *** 0.7017 ***
(0.0864) (0.1502) (0.0490) (0.0464) (0.0435) Time dummies Type dummies R2 (within) Nobs. (first stage) City IV 0.3583 *** 0.2640 *** 0.3969 *** 0.4577 *** 0.3284 *** (0.0034) (0.0060) (0.0040) (0.0069) (0.0020) F-statistic 27,519 (5) All types yes yes 0.111 453,402
yes yes yes yes
10,906 1,915 10,088 4,457 0.114 0.182 0.095 0.248 192,829 38,614 160,948 34,542 (1) Ryokan inns (2) Resort hotels (3) Business
hotels (4) City hotels
no no no no
Ratio of foreigner guests 0.6744 *** 0.0115 1.2502 *** 0.6325 *** 0.4961 ***
(0.1232) (0.1611) (0.0486) (0.0437) (0.0508) Time dummies Type dummies R2 (within) Nobs. (first stage) Prefecture IV 0.3512 *** 0.3166 *** 0.6139 *** 0.5868 *** 0.3927 *** (0.0042) (0.0069) (0.0057) (0.0076) (0.0024) F-statistic 658,207 27,722 (5) All types yes yes 0.117 7,048 2,078 11,619 5,923 283,120 65,421 187,590 45,008 0.115 0.185 0.091 0.230 no no no no
yes yes yes yes
(1) Ryokan inns
(2) Resort hotels
(3) Business
17
Table 8. Ratio of foreigner guests and TFP (FEIV estimation results, January data only). A. City IV
B. Prefecture IV
Notes: The dependent variable is the measured TFP calculated from the production functions estimation results. The instrument is the ratio of foreigner guest-nights in the city (panel A) or prefecture (panel B) excluding the guest-nights of facility i. ***, **, and * indicate statistical significance at the 1%, 5%, and 10% levels, respectively.
Ratio of foreigner guests 1.2965 *** 0.3371 1.2896 *** 1.1444 *** 1.1821 ***
(0.2464) (0.4210) (0.1820) (0.1982) (0.1244) Year dummies Type dummies R2 (within) Nobs. (first stage) City IV 0.3132 *** 0.2181 *** 0.3849 *** 0.3573 *** 0.3047 *** (0.0132) (0.0223) (0.0149) (0.0280) (0.0078) F-statistic 1,522 (5) All types yes yes 0.044 41,376 192,829 3,586 14,813 34,542 0.114 0.031 0.046 0.248 no no no no
yes yes yes yes
(1) Ryokan inns
(2) Resort hotels
(3) Business
hotels (4) City hotels
561 96 665 163
Ratio of foreigner guests 0.9090 *** 1.1705 *** 0.9933 *** 0.7739 *** 1.1761 ***
(0.3323) (0.4123) (0.1837) (0.1635) (0.1510) Year dummies Type dummies R2 (within) Nobs. (first stage) Prefecture IV 0.3556 *** 0.3381 *** 0.6149 *** 0.5570 *** 0.3674 *** (0.0158) (0.0271) (0.0232) (0.0320) (0.0092) F-statistic 60,152 1,591 (5) All types yes yes 0.039 509 156 700 303 26,094 6,035 187,590 4,193 no no no no
yes yes yes yes
(1) Ryokan inns
(2) Resort hotels
(3) Business
hotels (4) City hotels
18
Figure 1. Recent trends in goods and services exports.
Notes: Own elaboration from the quarterly estimates of GDP (Cabinet Office). Seasonally adjusted goods and services exports in real terms (2011=100).
Figure 2. Monthly patterns of guest-nights.
19
Figure 3. Mean and dispersion of TFP.
Note: The figure plots the mean (horizontal axis) and the dispersion (P90-P10 gap, vertical axis) of TFP for all accommodation facilities (monthly frequency).
20
Appendix Figure A1. Distribution of the room occupancy rate. (1) Ryokan-inns
21
(3) Business hotels
22