IMPORTANT DISCLOSURES, INCLUDING ANY REQUIRED RESEARCH CERTIFICATIONS, ARE PROVIDED AT THE END OF THIS REPORT.
Cheap for a reason
We upgrade our rating for FGV to Hold from Reduce as we see limited downside for the stock from current levels, with the market already valuing its plantation estates at below the replacement cost of new planting. Its move to sell non-core assets will help improve sentiment.
However, the stock is unlikely to rerate significantly as 4Q’s earnings are likely to remain weak and could come in below consensus. On top of this, the stock may lose its position in the FBM KLCI due to its lower market capitalisation. We cut our FY14-16 earnings by 4-7% to reflect the losses from the floods and Asian Plantations, and lower our SOP-based target price by 20%.
Market priced in concerns
FGV’s share prices has fallen 42% since the company announced its acquisition of Asian Plantations Ltd for RM628m and reported its first quarterly loss since listing in 3Q14. This has led some investors to pare down their stakes. The collapse in its share price has knocked off RM6bn market capitalisation from the stock. We believe the drop has sufficiently priced in the concerns as the market is only valuing its leased estates from the government at RM8,304 per ha, which is below replacement cost.
Focus for 2015
The group plans to focus on disposing its non-core assets in 1H15 and has set up several initiatives to reduce costs and improve the selling price achieved
for its palm products. The group will consider selling its Canadian downstream assets, which have been posting losses in 9M14, if a good offer comes along. We view this positively as it will help improve earnings and balance sheet strength.
Future M&A may require
external funding
We gather that the group is still keen on expanding its business via M&A but will be more selective now given that it has utilised 90% of its RM4.5bn IPO proceeds. Any future significant M&A may require funding through equity raising and bank borrowings. We estimate the net gearing of the group at 0.1x post its acquisition of Asian Plantations.
Cutting earnings and TP
We have revised down our FY14-16 earnings estimates by 4-7% to reflect the production losses from the floods in Dec and some losses from Asian Plantations. Based on this, we project the group report a net profit of RM12m in 4Q. Our target price which is based on a 20% discount to SOP has been cut to RM2.33 as we lower its asset valuations in line with the weaker earnings prospects.
Felda Global Ventures
COMPANY NOTEFGV MK / FGVH.KL Current RM2.20
Market Cap Avg Daily Turnover Free Float Target RM2.33
US$2,229m
US$2.50m
53.6%
Prev. Target RM2.93RM8,026m RM8.67m 3,648 m shares
Up/Downside 5.9%
Conviction| |
Sources: CIMB. COMPANY REPORTS
Notes from the Field———————————————————————————————————————— Ivy NG Lee Fang, CFA
T (60) 3 2261 9073 E [email protected]
Company Visit Expert Opinion Channel Check Customer Views
————————————————————————————————————————
Show Style "View Doc Map"
Contents
BACKGROUND ... 5 OUTLOOK ... 6 VALUATION AND RECOMMENDATION ... 9
44.0 54.0 64.0 74.0 84.0 94.0 104.0 114.0 1.80 2.30 2.80 3.30 3.80 4.30 4.80 5.30
Price Close Relative to FBMKLCI (RHS)
Source: Bloomberg
10 20
30
Jan-14 Apr-14 Jul-14 Oct-14
V
ol
m
EFAPChartPriceVolRelDaily|
Financial Summary
Dec-12A Dec-13A Dec-14F Dec-15F Dec-16F
Revenue (RMm) 12,886 12,568 15,905 16,485 17,371
Operating EBITDA (RMm) 975 703 946 1,129 1,380
Net Profit (RMm) 806.0 982.4 297.7 434.1 595.6
Core EPS (RM) 0.22 0.03 0.09 0.11 0.16
Core EPS Growth (57%) (85%) 192% 21% 43%
FD Core P/E (x) 11.77 68.24 23.33 19.32 13.48 DPS (RM) 0.14 0.16 0.08 0.10 0.12 Dividend Yield 6.36% 7.27% 3.64% 4.55% 5.45% EV/EBITDA (x) 3.16 13.63 11.56 9.98 8.34 P/FCFE (x) 7.13 3.31 66.57 6.25 5.48 Net Gearing (33.6%) (5.0%) 6.7% 6.8% 6.1% P/BV (x) 1.32 1.22 1.22 1.21 1.18 ROE 11.6% 1.9% 5.2% 6.3% 8.9%
% Change In Core EPS Estimates (3.84%) (7.31%) (2.87%)
CIMB/consensus EPS (x) 0.69 0.77 0.97
2.20
2.33
2.10 4.70
Target
52-week share price range
Current
PEER COMPARISON
Research Coverage
Bloomberg Code Market Recommendation Mkt Cap US$m Price Target Price Upside
Felda Global Ventures FGV MK MY HOLD 2,229 2.20 2.33 5.9%
Hap Seng Plantations HAPL MK MY HOLD 569 2.56 2.46 -3.9%
IOI Corporation IOI MK MY REDUCE 8,375 4.74 4.32 -8.9%
Kuala Lumpur Kepong KLK MK MY HOLD 6,773 22.90 22.10 -3.5%
0.00 1.00 2.00 3.00 4.00 5.00 6.00
Jan-10 Jan-11 Jan-12 Jan-13 Jan-14
Rolling P/BV (x)
Felda Global Ventures Hap Seng Plantations
IOI Corporation Kuala Lumpur Kepong
0.0 5.0 10.0 15.0 20.0 25.0 30.0 35.0 40.0 45.0 50.0
Jan-10 Jan-11 Jan-12 Jan-13 Jan-14
12-month Forward Rolling FD P/E (x)
Felda Global Ventures Hap Seng Plantations
IOI Corporation Kuala Lumpur Kepong
0.0% 3.8% 7.5% 11.3% 15.0% 18.8% 22.5% 26.3% 30.0% 0.00 0.50 1.00 1.50 2.00 2.50 3.00 3.50 4.00
Jan-10 Jan-11 Jan-12 Jan-13 Jan-14 Jan-15
Peer Aggregate: P/BV vs ROE
Rolling P/BV (x) (lhs) ROE (See Footnote) (rhs)
-60% -33% -7% 20% 47% 73% 100% 0.0 5.0 10.0 15.0 20.0 25.0 30.0
Jan-10 Jan-11 Jan-12 Jan-13 Jan-14 Jan-15
Peer Aggregate: 12-mth Fwd FD P/E vs FD EPS Growth
12-mth Fwd FD P/E (x) (See Footnote) (lhs) FD EPS Growth (See Footnote) (rhs)
Valuation
FD P/E (x) (See Footnote) P/BV (x) EV/EBITDA (x)
Dec-13 Dec-14 Dec-15 Dec-13 Dec-14 Dec-15 Dec-13 Dec-14 Dec-15
Felda Global Ventures 68.24 23.33 19.32 1.22 1.22 1.21 13.63 11.56 9.98
Hap Seng Plantations 21.00 15.67 14.61 1.06 1.04 1.01 11.47 8.91 8.29 IOI Corporation 19.07 22.28 23.55 3.11 4.71 4.20 14.03 15.63 16.61 Kuala Lumpur Kepong 26.71 23.96 21.05 3.22 3.11 2.96 16.32 14.94 12.95
Growth and Returns
FD EPS Growth (See Footnote) ROE (See Footnote) Dividend Yield
Dec-13 Dec-14 Dec-15 Dec-13 Dec-14 Dec-15 Dec-13 Dec-14 Dec-15
Felda Global Ventures -82.8% 192.5% 20.8% 1.9% 5.2% 6.3% 7.27% 3.64% 4.55%
Hap Seng Plantations -30.5% 34.0% 7.2% 5.1% 6.7% 7.0% 3.91% 3.83% 4.11%
IOI Corporation -11.2% -14.4% -5.4% 13.9% 16.8% 18.8% 2.87% 2.24% 2.12%
Kuala Lumpur Kepong -11.1% 11.5% 13.8% 12.4% 13.2% 14.4% 2.24% 2.60% 3.18%
SOURCE: CIMB, COMPANY REPORTS Calculations are performed using EFA™ Monthly Interpolated Annualisation and Aggregation algorithms to December year ends. NPAT/EPS values for calculations and valuations are based on recurring and normalised values for GAAP and IFRS accounting standard companies respectively.
Earnings projected to fall in 2014 due to downstream losses and lower production
We are projecting lower dividend payment for FY14 in line with weaker profit.
Share price info
Share px perf. (%) 1M 3M 12M Relative -3.6 -29.8 -49.5 Absolute -0.5 -30.2 -49.8
Major shareholders % held
Federal Land Development Authority 20.0 Felda Asset Holdings 18.7
Lembaga Tabung Haji 7.8 0.0%
2.3% 4.7% 7.0% 9.3% 11.7% 14.0% 0.00 0.50 1.00 1.50 2.00 2.50 3.00
Jan-10 Jan-11 Jan-12 Jan-13 Jan-14 Jan-15
P/BV vs ROE
Rolling P/BV (x) (lhs) ROE (See Footnote) (rhs)
-100% -56% -13% 31% 75% 119% 163% 206% 250% 0 20 40 60 80 100 120 140 160
Jan-10 Jan-11 Jan-12 Jan-13 Jan-14 Jan-15
12-mth Fwd FD Core P/E vs FD Core EPS Growth
12-mth Fwd Rolling FD Core P/E (x) (lhs) FD Core EPS Growth (rhs)
Profit & Loss
(RMm) Dec-12A Dec-13A Dec-14F Dec-15F Dec-16F
Total Net Revenues 12,886 12,568 15,905 16,485 17,371
Gross Profit 1,567 878 1,778 1,871 2,050
Operating EBITDA 975 703 946 1,129 1,380
Depreciation And Amortisation (109) (119) (131) (144) (158)
Operating EBIT 866 584 815 985 1,221
Financial Income/(Expense) (4) 61 (54) (92) (92)
Pretax Income/(Loss) from Assoc. 140 (2) 30 40 50
Non-Operating Income/(Expense) 0 0 0 0 0
Profit Before Tax (pre-EI) 1,002 643 791 933 1,179
Exceptional Items 124 865 (46) 19 0
Pre-tax Profit 1,126 1,508 745 952 1,179
Taxation (221) (399) (214) (273) (339)
Exceptional Income - post-tax 0 0 0 0 0
Profit After Tax 905 1,108 530 678 840
Minority Interests (99) (126) (233) (244) (245)
Preferred Dividends 0 0 0 0 0
FX Gain/(Loss) - post tax
Other Adjustments - post-tax 0 0 0 0 0
Net Profit 806 982 298 434 596
Recurring Net Profit 682 118 344 415 596
Fully Diluted Recurring Net Profit 682 118 344 415 596
Cash Flow
(RMm) Dec-12A Dec-13A Dec-14F Dec-15F Dec-16F
EBITDA 975 703 946 1,129 1,380
Cash Flow from Invt. & Assoc. (140) 2 (30) (40) (50)
Change In Working Capital (487) 60 (463) (80) (123)
(Incr)/Decr in Total Provisions 0 0 0 0 0
Other Non-Cash (Income)/Expense 0 0 0 0 0
Other Operating Cashflow 612 226 586 632 680
Net Interest (Paid)/Received (4) 48 (54) (92) (92)
Tax Paid (240) (294) (214) (273) (339)
Cashflow From Operations 715 745 771 1,275 1,456
Capex (287) (328) (417) (417) (417)
Disposals Of FAs/subsidiaries 0 551 0 0 0
Acq. Of Subsidiaries/investments (39) (1,503) 0 0 0
Other Investing Cashflow 161 77 (583) 77 77
Cash Flow From Investing (166) (1,203) (1,000) (340) (340)
Debt Raised/(repaid) 576 2,882 350 350 350
Proceeds From Issue Of Shares 4,326 0 0 0 0
Shares Repurchased 0 0 0 0
Dividends Paid (201) (529) (292) (365) (438)
Preferred Dividends
Other Financing Cashflow (1,031) (2,559) (770) (827) (859)
Cash Flow From Financing 3,670 (206) (712) (842) (947)
Total Cash Generated 4,220 (664) (941) 93 168
Free Cashflow To Equity 1,125 2,424 121 1,285 1,466
Free Cashflow To Firm 661 (362) (44) 1,158 1,339
BY THE NUMBERS
Lower cash balances following several acquisitions
Lower EBITDA margin due to downstream losses and weaker plantation margins
FFB output decline 3% despite the addition of Pontian United Plantation estates to its stable in FY14
Balance Sheet
(RMm) Dec-12A Dec-13A Dec-14F Dec-15F Dec-16F
Total Cash And Equivalents 5,694 5,205 4,264 4,357 4,525
Total Debtors 743 1,352 1,710 1,773 1,868
Inventories 598 1,740 2,202 2,282 2,405
Total Other Current Assets 960 752 752 752 752
Total Current Assets 7,994 9,049 8,929 9,164 9,550
Fixed Assets 1,683 5,683 5,902 6,109 6,301
Total Investments 2,770 1,344 1,297 1,261 1,234
Intangible Assets 707 876 876 876 876
Total Other Non-Current Assets 3,345 3,770 4,497 4,564 4,632
Total Non-current Assets 8,505 11,673 12,572 12,810 13,043
Short-term Debt 599 1,638 1,988 2,338 2,688
Current Portion of Long-Term Debt 1,138 639 639 639 639
Total Creditors 401 1,387 1,745 1,807 1,902
Other Current Liabilities 497 386 447 423 423
Total Current Liabilities 2,635 4,049 4,819 5,206 5,651
Total Long-term Debt 1,621 2,486 2,257 2,028 1,799
Hybrid Debt - Debt Component
Total Other Non-Current Liabilities 5,192 4,621 4,621 4,621 4,621
Total Non-current Liabilities 6,813 7,107 6,878 6,649 6,420
Total Provisions 91 620 620 620 620 Total Liabilities 9,539 11,776 12,317 12,475 12,691 Shareholders' Equity 6,102 6,571 6,577 6,647 6,806 Minority Interests 858 2,375 2,607 2,851 3,096 Total Equity 6,960 8,946 9,184 9,499 9,902 Key Drivers
Dec-12A Dec-13A Dec-14F Dec-15F Dec-16F
Planted Estates (ha) 333,368 333,368 347,529 349,529 351,529 Mature Estates (ha) 273,362 274,362 280,869 282,869 284,869 FFB Yield (tonnes/ha) 19.6 17.9 18.2 18.5 19.0
FFB Output Growth (%) -4.8% 2.9% -3.0% 1.9% 1.6%
CPO Price (US$/tonne) 920 741 728 693 722
BY THE NUMBERS
Key Ratios
Dec-12A Dec-13A Dec-14F Dec-15F Dec-16F
Revenue Growth 72.9% (2.5%) 26.6% 3.6% 5.4%
Operating EBITDA Growth (47.1%) (27.9%) 34.5% 19.3% 22.2%
Operating EBITDA Margin 7.56% 5.60% 5.95% 6.85% 7.94%
Net Cash Per Share (RM) 0.64 0.12 (0.17) (0.18) (0.16)
BVPS (RM) 1.67 1.80 1.80 1.82 1.87
Gross Interest Cover 7.78 5.65 4.40 4.41 5.47
Effective Tax Rate 19.6% 26.5% 28.8% 28.7% 28.7%
Net Dividend Payout Ratio 75% 496% 85% 88% 74%
Accounts Receivables Days 16.28 30.41 35.13 38.56 38.35
Inventory Days 16.63 36.50 50.93 56.01 55.99
Accounts Payables Days 9.65 26.51 39.49 43.42 43.41
ROIC (%) 17.4% 8.2% 6.6% 7.2% 8.6%
ROCE (%) 9.78% 6.05% 6.52% 7.49% 8.79%
Cheap for a reason
BACKGROUND
Share price slump due to weak results
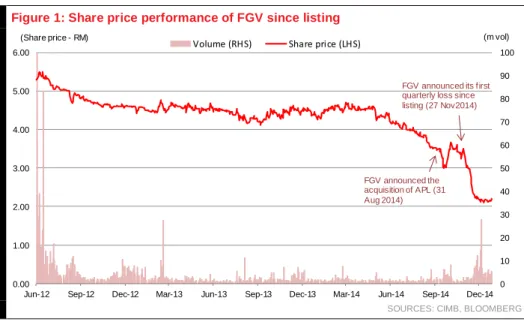
Felda Global Ventures’ share price has fallen 51% in 2014. We believe the decline was due to concerns over its poor 3Q earnings and potential earnings dilution from Asian Plantations Ltd. The stock is also down 52% from its IPO price of RM4.55 per shares in mid-2012.
Figure 1: Share price performance of FGV since listing
Title: Source:
Please fill in the values above to have them entered in your report
0 10 20 30 40 50 60 70 80 90 100 0.00 1.00 2.00 3.00 4.00 5.00 6.00
Jun-12 Sep-12 Dec-12 Mar-13 Jun-13 Sep-13 Dec-13 Mar-14 Jun-14 Sep-14 Dec-14
Volume (RHS) Share price (LHS)
(Share price - RM) (m vol)
FGV announced the acquisition of APL (31 Aug 2014)
FGV announced its first quarterly loss since listing (27 Nov2014)
SOURCES: CIMB, BLOOMBERG
We recently visited the company and came out relatively neutral from the meetings. We are positive on its plan to dispose non-core assets, though the value may not be significant relative to the group’s total assets.
We also gather that its Canadian downstream business is expected to recover some of the unrealised losses from the commodity contracts in 3Q14 of RM52m and the group is embarking on several initiatives to reduce its costs of productions at its estates.
However, these are offset by concerns that its 4Q results may come in below market expectations, the unexciting outlook for CPO price, potential fund raising should it embarked on M&A exercises, and the slump in its share price that may cause the group to be remove from the FBM KLCI index.
We cut our FY14 earnings to reflect lower-than-expected FFB output and revise down our SOP to reflect weaker earnings from its assets.
Our analysis suggests that the correction in its share price has more than captured these concerns. The market is currently valuing its planted estates (which is leased from the government) at RM8,304 per ha (below replacement cost for the estates which we estimate should be worth around RM15k-20k per ha).
As such, we upgrade the stock to a Hold from Reduce. We see limited downside from here as the stock is supported by the attractive market-implied valuation for its leased estates (after stripping out valuation for its stake in MSM and FHB). The stock is not an Add as it lacks significant catalysts.
‘‘
‘
‘
The acquisition of AsianPlantations Ltd complements the group’s long-term expansion strategy. We are relentless in our pursuit to be part of the world’s top 10
agribusiness players and a leader in the sectors of palm oil, rubber and sugar by 2020.”
Mohd Emir Mavani Abdullah, FGV Group President and Chief Executive Officer
OUTLOOK
Poor harvest in 4Q14
Felda Global Venture’s (FGV) 4Q14 FFB output fell 13% yoy and 10% qoq due to flooding in the Malay Peninsula’s East Coast which impacted 6.3% of its total planted oil palm estates. The weaker FFB yields were partly due to the drought that impacted its Peninsular Malaysia estates in 1Q14. The combination of these two adverse weather conditions, combined with on-going replanting efforts of 15,000 ha per annum, led the group to report a 3% yoy decline in FFB output for 2014, which is slightly below our projections.
The decline in output growth would have been steeper, if not for the additional FFB output contribution from Pontian United Plantation (PUP) estates. To recap, the group completed the acquisition of PUP on 1 Oct 2013 for RM1.2bn. The acquisition added 5% of planted oil palm estates to the group.
Overall, we have lowered our FFB projections and cut our earnings for FY14 to reflect this. We are projecting a slower 2% growth for FY15 due to concerns over the lingering impact of the adverse weather on its estates, as well as the group’s ageing estates.
Figure 2: FGV’s FFB output trend Figure 3: FGV's quarterly FFB output and CPO price
Title: Source:
Please fill in the values above to have them entered in your report
4,911 5,052 4,913 4,800 4,850 4,900 4,950 5,000 5,050 5,100 2012 2013 2014 ('000 tonnes) Title: Source:
Please fill in the values above to have them entered in your report
500 1,000 1,500 2,000 2,500 3,000 1,000 1,050 1,100 1,150 1,200 1,250 1,300 1,350 1,400 1Q13 2Q13 3Q13 4Q13 1Q14 2Q14 3Q14 4Q14F
FFB output (LHS) CPO price (RHS)
('000 tonnes) (RM per tonne)
SOURCES: CIMB, COMPANY REPORTS SOURCES: CIMB, COMPANY REPORTS
Working on initiatives to reduce costs
FGV plans to reduce its CPO costs of production (ex-mills) at its estates, which it estimates at around RM1,370 per tonne for FY14, through several cost-saving initiatives implemented in the group. It added that fertiliser prices is likely to trend lower in line with the weaker crude oil price but this could be partially offset by the weak ringgit against the USD as most of the fertiliser materials are imported.
Labour costs are expected to remain relatively stable unless the government decides to raise the minimum wage of the country, which currently stands at RM900 per month for Peninsular Malaysia. The 6% GST implementation starting 1 April 2015 is not expected to impact the group’s cost of production as it is able to claim the tax on its inputs, based on the group’s initial assessment. However, this may raise the group’s working capacity cycle slightly as it may take time for the group to recoup its taxes.
The falling diesel prices could potentially lower its replanting costs of around RM250m per annum if the group is successful in negotiating down the costs with its contractors. The above costs of production for its estates exclude replanting costs, lease payments to the government, as well as HQ costs. Our own estimates show the group’s estates costs of production to be closer to RM2,000 per tonne, if we add in these last three items.
Figure 4: Historical FGV’s lease payments (cash flows) to FELDA
Figure 5: Historical replanting costs of FGV
Title: Source:
Please fill in the values above to have them entered in your report
388.1 325.9 257.5 0 50 100 150 200 250 300 350 400 450 2012 2013 9M14 (RM m) Title: Source:
Please fill in the values above to have them entered in your report
199.6 223.5 255.8 0 50 100 150 200 250 300 2011 2012 2013 (RM m)
SOURCES: CIMB, COMPANY REPORTS SOURCES: CIMB, COMPANY REPORTS
Replanting efforts to slowly bear fruit
The group is not wavering from its initiatives to replant around 15,000 ha of estates per annum to improve its age profile over time. Some of its early replanting plan in 2011 of 16k per ha should slowly come into maturity in the coming years and help to improve the FFB yield performance for its estates. The replanting costs of around RM250m per annum are expense off as they are incurred in the group’s income statement.
Figure 6: FGV’s oil palm replanting programme
Title: Source:
Please fill in the values above to have them entered in your report
14,855 13,473 8,649 13,997 16,205 16,478 14,464 14,251 15,260 19,700 5,000 10,000 15,000 20,000 25,000 2007 2008 2009 2010 2011 2012 2013 2014F 2015F 2016F (ha)
SOURCES: CIMB, COMPANY REPORTS
New trading arm to secure better pricing for its CPO
FGV is in the midst of setting up a new trading division for the group with the main purpose of securing better pricing and market access for its palm products. The new trading division will commence on 1 Feb 2015 and the group’s output from its mills and refineries will be channeled to this trading arm to secure the best pricing for its palm products with MPOB’s average price as the key benchmark. Following this, the group’s mill and refinery division will focus on achieving better efficiency at its plants as they will receive a fixed tolling fees for the products processed. The group’s current CPO price view for 2015 is RM2,450 per tonne, which is broadly in line with ours of RM2,460 per tonne.
Asian Plantations Ltd may dampen earnings
The group recently completed the acquisition of Asian Plantations Ltd (APL) for RM660m, which we view to be pricey (after taking into consideration its young age profile) compared to other estates transactions in Sarawak. FGV indicated that it paid EV/ha of RM62k for the planted estates of 16,300 ha under this deal which we view to be pricier than other estates transaction in Sarawak of RM40k-50k per ha. The group is expected to start incorporating the contribution from APL in 4Q14. In FY13 and 1H14, APL posted a loss of US$10.4m and US$10.6m, respectively. Our concern is that the group’s losses will widen as more new mature areas come on stream. We have incorporated APL into our FY15-16 earnings estimates.
Figure 7: Historical net profit of Asian Plantations Ltd (APL)
Title: Source:
Please fill in the values above to have them entered in your report
(1.2) (3.6) (11.6) (6.9) (10.4) (10.6) (14.0) (12.0) (10.0) (8.0) (6.0) (4.0) (2.0) -2009 2010 2011 2012 2013 1H14 (US$ m)
SOURCES: CIMB, COMPANY REPORTS
Selling non-core assets
FGV indicated that it will focus on divesting some of its non-core businesses, which include the travel, IT and engineering businesses in 1H15. This will allow the group to receive some proceeds to strengthen its balance sheet but they are unlikely to boost the earnings of the group significantly. It was reported in the media that these assets could potentially be worth RM320m. We view this positively as it will allow the group to better focus on its existing core businesses.
M&A constraints as it has utilize most of IPO proceeds
As at 30 Sep 2014, the group has spent 90% or RM4bn of its RM4.5bn IPO proceeds raised in 2012. As a result, the group would need to borrow or raise equity to fund any significant future acquisitions. We believe investors will be monitoring closely on whether the group has been able to add value to its shareholders through its past acquisitions in its upcoming results.
Figure 8: Utilisation of IPO proceeds Figure 9: Balance sheet position
Item RM m
IPO expenses 144
Additional IPO expenses 16
Repayment of loan 260
TRT Etgo capex 59
Working capital & general corporate expenses 129
FGV R&D 10
TRT Etgo additional capex 69
Acquisition of Mission Biotech 21
Acquisition of PT Temila Agro & PT Landak Bhakti 13
Acquisition of Pontian United Plantations - batch 1 607
Acquisition of Pontian United Plantations - batch 2 600
Capital injection into FGV Biotechnologies 50
Payment for remaining 50% of Mission Biotech acquisition 18
Acquisition of Felda Holdings Bhd 1,133 Payment for Indonesian plantation companies 23
Capital injection into FGV Capital & FGV Investment 22
Capital injection into Trurich Resources 80
Acquisition of Asian Plantations Ltd 660
Others 104 Total utilisation 4,018 Balance 441 Total proceeds 4,459 Title: Source:
Please fill in the values above to have them entered in your report
1,934 (557) (566) (1,000) (500) 500 1,000 1,500 2,000 2,500
End-2012 End-2013 End-Sept 2014
(RM m)
SOURCES: CIMB, COMPANY REPORTS SOURCES: CIMB, COMPANY REPORTS
VALUATION AND RECOMMENDATION
Cutting FY14-16 earnings by 3-7%
We downgrade our FY14-16 earnings forecasts by 3-7% to reflect lower FFB output assumptions in view of the floods and to incorporate the losses from Asian Plantations. Following the earnings revision, we now expect FY14’s reported net profit to fall in FY14 before rising in FY15. We project better earnings in FY15 due to a higher CPO price assumption and lower losses from its downstream division. For FY16, the stronger earnings are due mainly to higher CPO prices and production. Based on our revised FY14 earnings forecast, we project FGV to post a net profit of RM12m in 4Q14. The group’s earnings are highly sensitive to changes in CPO prices. We estimate that every RM100 per tonne change in CPO price will impact its pretax profit by RM95m.
Balance sheet strength
FGV’s total borrowings as at 30 Sept 2014 were RM4.4bn. Of this, 59% or RM2.6bn represent loans due to a significant shareholder. The remainder comprises bankers’ acceptances and export credit refinancing which we believe are trade-related loans. Most of the group’s borrowings or 93% are denominated in ringgit. The group also held cash and cash equivalents of RM3.8bn as at 30 Sept 2014. As such, the group was in a net debt position of RM0.6bn as at end of 3Q14 against its total shareholders’ equity of RM6.3bn, implying a net gearing position of 9.5%.
Upgrade to Hold from Reduce
We raise our rating for the stock to Hold from Reduce as we believe the sharp decline in its share price has sufficiently priced in investors’ concerns over the group’s acquisition of Asian Plantations and its weak 3Q results. Based on our estimates, the market is only valuing the group’s leased estates at RM8,304 per ha which is below its replacement cost. Despite the seemingly attractive valuation, the stock is not an Add due to our concerns over: 1) full-year net profit that may be weak and come in below consensus numbers of RM436m net profit for FY14, 2) the unexciting CPO price prospects, and 3) the potential removal of the stock from the FBM KLCI index as its market capitalisation is
now only RM8bn, which is RM4.3bn below the 29th largest market cap stock in
the index which is KLCCP Stapled Group (RM12.3bn).
Dividend payout policy and our estimates
The group has had a dividend payout policy of 50% since its listing. Over the past two years, the group has paid out 59-63% of its reported net earnings as dividends. We are projecting a dividend payout of 98% for FY14, suggesting a final dividend of 2 sen per share and full-year dividend of 8 sen. For FY15-16, we expect the group to pay out 75-85% of its earnings, translating into dividend yields of 4-5%.
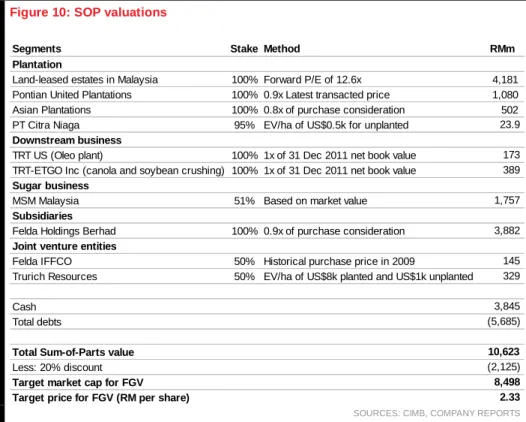
Figure 10: SOP valuations
Segments Stake Method RMm
Plantation
Land-leased estates in Malaysia 100% Forward P/E of 12.6x 4,181 Pontian United Plantations 100% 0.9x Latest transacted price 1,080 Asian Plantations 100% 0.8x of purchase consideration 502 PT Citra Niaga 95% EV/ha of US$0.5k for unplanted 23.9 Downstream business
TRT US (Oleo plant) 100% 1x of 31 Dec 2011 net book value 173 TRT-ETGO Inc (canola and soybean crushing) 100% 1x of 31 Dec 2011 net book value 389 Sugar business
MSM Malaysia 51% Based on market value 1,757
Subsidiaries
Felda Holdings Berhad 100% 0.9x of purchase consideration 3,882 Joint venture entities
Felda IFFCO 50% Historical purchase price in 2009 145 Trurich Resources 50% EV/ha of US$8k planted and US$1k unplanted 329
Cash 3,845
Total debts (5,685)
Total Sum-of-Parts value 10,623
Less: 20% discount (2,125)
Target market cap for FGV 8,498
Target price for FGV (RM per share) 2.33
DISCLAIMER #01
This report is not directed to, or intended for distribution to or use by, any person or entity who is a citizen or resident of or located in any locality, state, country or other jurisdiction where such distribution, publication, availability or use would be contrary to law or regulation.
By accepting this report, the recipient hereof represents and warrants that he is entitled to receive such report in accordance with the restrictions set forth below and agrees to be bound by the limitations contained herein (including the “Restrictions on Distributions” set out below). Any failure to comply with these limitations may constitute a violation of law. This publication is being supplied to you strictly on the basis that it will remain confidential. No part of this report may be (i) copied, photocopied, duplicated, stored or reproduced in any form by any means or (ii) redistributed or passed on, directly or indirectly, to any other person in whole or in part, for any purpose without the prior written consent of CIMB.
Unless otherwise specified, this report is based upon sources which CIMB considers to be reasonable. Such sources will, unless otherwise specified, for market data, be market data and prices available from the main stock exchange or market where the relevant security is listed, or, where appropriate, any other market. Information on the accounts and business of company(ies) will generally be based on published statements of the company(ies), information disseminated by regulatory information services, other publicly available information and information resulting from our research.
Whilst every effort is made to ensure that statements of facts made in this report are accurate, all estimates, projections, forecasts, expressions of opinion and other subjective judgments contained in this report are based on assumptions considered to be reasonable as of the date of the document in which they are contained and must not be construed as a representation that the matters referred to therein will occur. Past performance is not a reliable indicator of future performance. The value of investments may go down as well as up and those investing may, depending on the investments in question, lose more than the initial investment. No report shall constitute an offer or an invitation by or on behalf of CIMB or its affiliates to any person to buy or sell any investments.
CIMB, its affiliates and related companies, their directors, associates, connected parties and/or employees may own or have positions in securities of the company(ies) covered in this research report or any securities related thereto and may from time to time add to or dispose of, or may be materially interested in, any such securities. Further, CIMB, its affiliates and its related companies do and seek to do business with the company(ies) covered in this research report and may from time to time act as market maker or have assumed an underwriting commitment in securities of such company(ies), may sell them to or buy them from customers on a principal basis and may also perform or seek to perform significant investment banking, advisory, underwriting or placement services for or relating to such company(ies) as well as solicit such investment, advisory or other services from any entity mentioned in this report.
CIMB or its affiliates may enter into an agreement with the company(ies) covered in this report relating to the production of research reports. CIMB may disclose the contents of this report to the company(ies) covered by it and may have amended the contents of this report following such disclosure.
The analyst responsible for the production of this report hereby certifies that the views expressed herein accurately and exclusively reflect his or her personal views and opinions about any and all of the issuers or securities analysed in this report and were prepared independently and autonomously. No part of the compensation of the analyst(s) was, is, or will be directly or indirectly related to the inclusion of specific recommendations(s) or view(s) in this report. CIMB prohibits the analyst(s) who prepared this research report from receiving any compensation, incentive or bonus based on specific investment banking transactions or for providing a specific recommendation for, or view of, a particular company. Information barriers and other arrangements may be established where necessary to prevent conflicts of interests arising. However, the analyst(s) may receive compensation that is based on his/their coverage of company(ies) in the performance of his/their duties or the performance of his/their recommendations and the research personnel involved in the preparation of this report may also participate in the solicitation of the businesses as described above. In reviewing this research report, an investor should be aware that any or all of the foregoing, among other things, may give rise to real or potential conflicts of interest. Additional information is, subject to the duties of confidentiality, available on request.
Reports relating to a specific geographical area are produced by the corresponding CIMB entity as listed in the table below. The term “CIMB” shall denote, where appropriate, the relevant entity distributing or disseminating the report in the particular jurisdiction referenced below, or, in every other case, CIMB Group Holdings Berhad ("CIMBGH") and its affiliates, subsidiaries and related companies.
Country CIMB Entity Regulated by
Australia CIMB Securities (Australia) Limited Australian Securities & Investments Commission
Hong Kong CIMB Securities Limited Securities and Futures Commission Hong Kong
Indonesia PT CIMB Securities Indonesia Financial Services Authority of Indonesia
India CIMB Securities (India) Private Limited Securities and Exchange Board of India (SEBI)
Malaysia CIMB Investment Bank Berhad Securities Commission Malaysia
Singapore CIMB Research Pte. Ltd. Monetary Authority of Singapore
South Korea CIMB Securities Limited, Korea Branch Financial Services Commission and Financial Supervisory Service
Taiwan CIMB Securities Limited, Taiwan Branch Financial Supervisory Commission
Thailand CIMB Securities (Thailand) Co. Ltd. Securities and Exchange Commission Thailand
(i) As of January 23, 2015 CIMB has a proprietary position in the securities (which may include but not limited to shares, warrants, call warrants and/or any other derivatives) in the following company or companies covered or recommended in this report:
(a) Felda Global Ventures, IOI Corporation, Kuala Lumpur Kepong
(ii) As of January 26, 2015, the analyst(s) who prepared this report, and the associate(s), has / have an interest in the securities (which may include but not limited to shares, warrants, call warrants and/or any other derivatives) in the following company or companies covered or recommended in this report:
The information contained in this research report is prepared from data believed to be correct and reliable at the time of issue of this report. CIMB may or may not issue regular reports on the subject matter of this report at any frequency and may cease to do so or change the periodicity of reports at any time. CIMB is under no obligation to update this report in the event of a material change to the information contained in this report. This report does not purport to contain all the information that a prospective investor may require. CIMB or any of its affiliates does not make any guarantee, representation or warranty, express or implied, as to the adequacy, accuracy, completeness, reliability or fairness of any such information and opinion contained in this report. Neither CIMB nor any of its affiliates nor its related persons shall be liable in any manner whatsoever for any consequences (including but not limited to any direct, indirect or consequential losses, loss of profits and damages) of any reliance thereon or usage thereof.
This report is general in nature and has been prepared for information purposes only. It is intended for circulation amongst CIMB and its affiliates’ clients generally and does not have regard to the specific investment objectives, financial situation and the particular needs of any specific person who may receive this report. The information and opinions in this report are not and should not be construed or considered as an offer, recommendation or solicitation to buy or sell the subject securities, related investments or other financial instruments thereof.
Investors are advised to make their own independent evaluation of the information contained in this research report, consider their own individual investment objectives, financial situation and particular needs and consult their own professional and financial advisers as to the legal, business, financial, tax and other aspects before participating in any transaction in respect of the securities of company(ies) covered in this research report. The securities of such company(ies) may not be eligible for sale in all jurisdictions or to all categories of investors.
Australia: Despite anything in this report to the contrary, this research is provided in Australia by CIMB Securities (Australia) Limited (“CSAL”) (ABN 84 002 768 701, AFS Licence number 240 530). CSAL is a Market Participant of ASX Ltd, a Clearing Participant of ASX Clear Pty Ltd, a Settlement Participant of ASX Settlement Pty Ltd, and, a participant of Chi X Australia Pty Ltd. This research is only available in Australia to persons who are “wholesale clients” (within the meaning of the Corporations Act 2001 (Cth)) and is supplied solely for the use of such wholesale clients and shall not be distributed or passed on to any other person. This research has been prepared without taking into account the objectives, financial situation or needs of the individual recipient.
France: Only qualified investors within the meaning of French law shall have access to this report. This report shall not be considered as an offer to subscribe to, or used in connection with, any offer for subscription or sale or marketing or direct or indirect distribution of financial instruments and it is not intended as a solicitation for the purchase of any financial instrument.
Hong Kong: This report is issued and distributed in Hong Kong by CIMB Securities Limited (“CHK”) which is licensed in Hong Kong by the Securities and Futures Commission for Type 1 (dealing in securities), Type 4 (advising on securities) and Type 6 (advising on corporate finance) activities. Any investors wishing to purchase or otherwise deal in the securities covered in this report should contact the Head of Sales at CIMB Securities Limited. The views and opinions in this research report are our own as of the date hereof and are subject to change. If the Financial Services and Markets Act of the United Kingdom or the rules of the Financial Conduct Authority apply to a recipient, our obligations owed to such recipient therein are unaffected. CHK has no obligation to update its opinion or the information in this research report.
This publication is strictly confidential and is for private circulation only to clients of CHK. This publication is being supplied to you strictly on the basis that it will remain confidential. No part of this material may be (i) copied, photocopied, duplicated, stored or reproduced in any form by any means or (ii) redistributed or passed on, directly or indirectly, to any other person in whole or in part, for any purpose without the prior written consent of CHK. Unless permitted to do so by the securities laws of Hong Kong, no person may issue or have in its possession for the purposes of issue, whether in Hong Kong or elsewhere, any advertisement, invitation or document relating to the securities covered in this report, which is directed at, or the contents of which are likely to be accessed or read by, the public in Hong Kong (except if permitted to do so under the securities laws of Hong Kong).
CIMB Securities Limited does not make a market on the securities mentioned in the report.
India: This report is issued and distributed in India by CIMB Securities (India) Private Limited (“CIMB India”) which is registered with SEBI as a stock-broker under the Securities and Exchange Board of India (Stock Brokers and Sub-Brokers) Regulations, 1992 and in accordance with the provisions of Regulation 4 (g) of the Securities and Exchange Board of India (Investment Advisers) Regulations, 2013, CIMB India is not required to seek registration with SEBI as an Investment Adviser.
The research analysts, strategists or economists principally responsible for the preparation of this research report are segregated from the other activities of CIMB India and they have received compensation based upon various factors, including quality, accuracy and value of research, firm profitability or revenues, client feedback and competitive factors. Research analysts', strategists' or economists' compensation is not linked to investment banking or capital markets transactions performed or proposed to be performed by CIMB India or its affiliates.
Indonesia: This report is issued and distributed by PT CIMB Securities Indonesia (“CIMBI”). The views and opinions in this research report are our own as of the date hereof and are subject to change. If the Financial Services and Markets Act of the United Kingdom or the rules of the Financial Conduct Authority apply to a recipient, our obligations owed to such recipient therein are unaffected. CIMBI has no obligation to update its opinion or the information in this research report.
This publication is strictly confidential and is for private circulation only to clients of CIMBI. This publication is being supplied to you strictly on the basis that it will remain confidential. No part of this material may be (i) copied, photocopied, duplicated, stored or reproduced in any form by any means or (ii) redistributed or passed on, directly or indirectly, to any other person in whole or in part, for any purpose without the prior written consent of CIMBI. Neither this report nor any copy hereof may be distributed in Indonesia or to any Indonesian citizens wherever they are domiciled or to Indonesia residents except in compliance with applicable Indonesian capital market laws and regulations.
Malaysia: This report is issued and distributed by CIMB Investment Bank Berhad (“CIMB”). The views and opinions in this research report are our own as of the date hereof and are subject to change. If the Financial Services and Markets Act of the United Kingdom or the rules of the Financial Conduct Authority apply to a recipient, our obligations owed to such recipient therein are unaffected. CIMB has no obligation to update its opinion or the information in this research report.
basis that it will remain confidential. No part of this material may be (i) copied, photocopied, duplicated, stored or reproduced in any form by any means or (ii) redistributed or passed on, directly or indirectly, to any other person in whole or in part, for any purpose without the prior written consent of CIMB.
New Zealand: In New Zealand, this report is for distribution only to persons whose principal business is the investment of money or who, in the course of, and for the purposes of their business, habitually invest money pursuant to Section 3(2)(a)(ii) of the Securities Act 1978.
Singapore: This report is issued and distributed by CIMB Research Pte Ltd (“CIMBR”). Recipients of this report are to contact CIMBR in
Singapore in respect of any matters arising from, or in connection with, this report. The views and opinions in this research report are our own as of the date hereof and are subject to change. If the Financial Services and Markets Act of the United Kingdom or the rules of the Financial Conduct Authority apply to a recipient, our obligations owed to such recipient therein are unaffected. CIMBR has no obligation to update its opinion or the information in this research report.
This publication is strictly confidential and is for private circulation only. If the recipient of this research report is not an accredited investor, expert investor or institutional investor, CIMBR accepts legal responsibility for the contents of the report without any disclaimer limiting or otherwise curtailing such legal responsibility. This publication is being supplied to you strictly on the basis that it will remain confidential. No part of this material may be (i) copied, photocopied, duplicated, stored or reproduced in any form by any means or (ii) redistributed or passed on, directly or indirectly, to any other person in whole or in part, for any purpose without the prior written consent of CIMBR.
As of January 23, 2015, CIMBR does not have a proprietary position in the recommended securities in this report. CIMB Securities Singapore Pte Ltd and/or CIMB Bank does not make a market on the securities mentioned in the report.
South Korea: This report is issued and distributed in South Korea by CIMB Securities Limited, Korea Branch ("CIMB Korea") which is licensed as a cash equity broker, and regulated by the Financial Services Commission and Financial Supervisory Service of Korea.
The views and opinions in this research report are our own as of the date hereof and are subject to change, and this report shall not be considered as an offer to subscribe to, or used in connection with, any offer for subscription or sale or marketing or direct or indirect distribution of financial investment instruments and it is not intended as a solicitation for the purchase of any financial investment instrument.
This publication is strictly confidential and is for private circulation only, and no part of this material may be (i) copied, photocopied, duplicated, stored or reproduced in any form by any means or (ii) redistributed or passed on, directly or indirectly, to any other person in whole or in part, for any purpose without the prior written consent of CIMB Korea.
Sweden: This report contains only marketing information and has not been approved by the Swedish Financial Supervisory Authority. The
distribution of this report is not an offer to sell to any person in Sweden or a solicitation to any person in Sweden to buy any instruments described herein and may not be forwarded to the public in Sweden.
Taiwan: This research report is not an offer or marketing of foreign securities in Taiwan. The securities as referred to in this research report have not been and will not be registered with the Financial Supervisory Commission of the Republic of China pursuant to relevant securities laws and regulations and may not be offered or sold within the Republic of China through a public offering or in circumstances which constitutes an offer or a placement within the meaning of the Securities and Exchange Law of the Republic of China that requires a registration or approval of the Financial Supervisory Commission of the Republic of China.
Thailand: This report is issued and distributed by CIMB Securities (Thailand) Company Limited (CIMBS). The views and opinions in this research report are our own as of the date hereof and are subject to change. If the Financial Services and Markets Act of the United Kingdom or the rules of the Financial Conduct Authority apply to a recipient, our obligations owed to such recipient therein are unaffected. CIMBS has no obligation to update its opinion or the information in this research report.
This publication is strictly confidential and is for private circulation only to clients of CIMBS. This publication is being supplied to you strictly on the basis that it will remain confidential. No part of this material may be (i) copied, photocopied, duplicated, stored or reproduced in any form by any means or (ii) redistributed or passed on, directly or indirectly, to any other person in whole or in part, for any purpose without the prior written consent of CIMBS.
CIMB Securities (Thailand) Co., Ltd. may act or acts as Market Maker and issuer including offering of Derivative Warrants Underlying securities of the following securities. Investors should carefully read and study the details of the derivative warrants in the prospectus before making investment decisions.
AAV, ADVANC, AMATA, ANAN, AOT, AP, ASP, BANPU, BAY, BBL, BCH, BCP, BEC, BECL, BGH, BH, BIGC, BJC, BJCHI, BLA, BLAND, BMCL, BTS, CENTEL, CK, CPALL, CPF, CPN, DCC, DELTA, DEMCO, DTAC, EARTH, EGCO, ERW, ESSO, GFPT, GLOBAL, GLOW, GUNKUL, HEMRAJ, HMPRO, INTUCH, IRPC, ITD, IVL, JAS, KBANK, KCE, KKP, KTB, KTC, LH, LOXLEY, LPN, M, MAJOR, MC, MCOT, MEGA, MINT, NOK, NYT, PS, PSL, PTT, PTTEP, PTTGC, QH, RATCH, ROBINS, RS, SAMART, SCB, SCC, SCCC, SIRI, SPALI, SPCG, SRICHA, STA, STEC, STPI, SVI, TASCO, TCAP, TFD, THAI, THCOM, THRE, THREL, TICON, TISCO, TMB, TOP, TPIPL, TTA, TTCL, TTW, TUF, UMI, UV, VGI, TRUE, WHA.
Corporate Governance Report:
The disclosure of the survey result of the Thai Institute of Directors Association (“IOD”) regarding corporate governance is made pursuant to the policy of the Office of the Securities and Exchange Commission. The survey of the IOD is based on the information of a company listed on the Stock Exchange of Thailand and the Market for Alternative Investment disclosed to the public and able to be accessed by a general public investor. The result, therefore, is from the perspective of a third party. It is not an evaluation of operation and is not based on inside information. The survey result is as of the date appearing in the Corporate Governance Report of Thai Listed Companies. As a result, the survey result may be changed after that date. CIMBS does not confirm nor certify the accuracy of such survey result.
Score Range: 90 - 100 80 - 89 70 - 79 Below 70 or No Survey Result
Description: Excellent Very Good Good N/A
authorities or governmental agencies in the United Arab Emirates. This report is strictly private and confidential and has not been reviewed by, deposited or registered with UAE Central Bank or any other licensing authority or governmental agencies in the United Arab Emirates. This report is being issued outside the United Arab Emirates to a limited number of institutional investors and must not be provided to any person other than the original recipient and may not be reproduced or used for any other purpose. Further, the information contained in this report is not intended to lead to the sale of investments under any subscription agreement or the conclusion of any other contract of whatsoever nature within the territory of the United Arab Emirates.
United Kingdom and Europe: In the United Kingdom and European Economic Area, this report is being disseminated by CIMB Securities (UK) Limited (“CIMB UK”). CIMB UK is authorised and regulated by the Financial Conduct Authority and its registered office is at 27 Knightsbridge, London, SW1X 7YB. This report is for distribution only to, and is solely directed at, selected persons on the basis that those persons: (a) are persons that are eligible counterparties and professional clients of CIMB UK; (b) have professional experience in matters relating to investments falling within Article 19(5) of the Financial Services and Markets Act 2000 (Financial Promotion) Order 2005 (as amended, the “Order”); (c) are persons falling within Article 49 (2) (a) to (d) (“high net worth companies, unincorporated associations etc”) of the Order; (d) are outside the United Kingdom; or (e) are persons to whom an invitation or inducement to engage in investment activity (within the meaning of section 21 of the Financial Services and Markets Act 2000) in connection with any investments to which this report relates may otherwise lawfully be communicated or caused to be communicated (all such persons together being referred to as “relevant persons”). This report is directed only at relevant persons and must not be acted on or relied on by persons who are not relevant persons. Any investment or investment activity to which this report relates is available only to relevant persons and will be engaged in only with relevant persons.
Only where this report is labelled as non-independent, it does not provide an impartial or objective assessment of the subject matter and does not constitute independent "investment research" under the applicable rules of the Financial Conduct Authority in the UK. Consequently, any such non-independent report will not have been prepared in accordance with legal requirements designed to promote the independence of investment research and will not subject to any prohibition on dealing ahead of the dissemination of investment research.
United States: This research report is distributed in the United States of America by CIMB Securities (USA) Inc, a U.S.-registered broker-dealer and a related company of CIMB Research Pte Ltd, CIMB Investment Bank Berhad, PT CIMB Securities Indonesia, CIMB Securities (Thailand) Co. Ltd, CIMB Securities Limited, CIMB Securities (Australia) Limited, CIMB Securities (India) Private Limited, and is distributed solely to persons who qualify as "U.S. Institutional Investors" as defined in Rule 15a-6 under the Securities and Exchange Act of 1934. This communication is only for Institutional Investors whose ordinary business activities involve investing in shares, bonds and associated securities and/or derivative securities and who have professional experience in such investments. Any person who is not a U.S. Institutional Investor or Major Institutional Investor must not rely on this communication. The delivery of this research report to any person in the United States of America is not a recommendation to effect any transactions in the securities discussed herein, or an endorsement of any opinion expressed herein. CIMB Securities (USA) Inc, is a FINRA/SIPC member and takes responsibility for the content of this report. For further information or to place an order in any of the above-mentioned securities please contact a registered representative of CIMB Securities (USA) Inc.
CIMB Securities (USA) Inc does not make a market on the securities mentioned in the report.
Other jurisdictions: In any other jurisdictions, except if otherwise restricted by laws or regulations, this report is only for distribution to professional, institutional or sophisticated investors as defined in the laws and regulations of such jurisdictions.
Rating Distribution (%) Investment Banking clients (%)
Add 58.4% 6.0%
Hold 29.4% 4.3%
Reduce 12.2% 1.0%
Distribution of stock ratings and investment banking clients for quarter ended on 31 December 2014 1586 companies under coverage for quarter ended on 31 December 2014
Spitzer Chart for stock being researched ( 2 year data )
Felda Global Ventures (FGV MK)
1.80 2.30 2.80 3.30 3.80 4.30 4.80 5.30
Jan-13 May-13 Oct-13 Jan-14 Jun-14 Oct-14
Price Close 4 .7 0 4 .5 3 4 .3 2 4 .5 0 4 .7 3 4 .7 3 4 .7 2 3 .9 6 3 .6 9 3.4 7 3 .2 8 2 .9 3
Recommendations & Target Price
Corporate Governance Report of Thai Listed Companies (CGR). CG Rating by the Thai Institute of Directors Association (Thai IOD) in 2014.
AAV – Very Good, ADVANC – Very Good, AEONTS – not available, AMATA - Good, ANAN – Very Good, AOT – Very Good, AP - Good, ASK – Very Good,
ASP – Very Good, BANPU – Very Good , BAY – Very Good , BBL – Very Good, BCH – not available, BCP - Excellent, BEAUTY – Good, BEC - Good, BECL –
Very Good, BGH - not available, BH - Good, BIGC - Very Good, BJC – Good, BLA – Very Good, BMCL - Very Good, BTS - Excellent, CCET – Good,
CENTEL – Very Good, CHG – not available, CK – Very Good, CPALL – not available, CPF – Very Good, CPN - Excellent, DELTA - Very Good, DEMCO – Good,
DTAC – Very Good, EA - Good, ECL – not available, EGCO - Excellent, GFPT - Very Good, GLOBAL - Good, GLOW - Good, GRAMMY - Excellent, HANA -
Excellent, HEMRAJ – Very Good, HMPRO - Very Good, ICHI - not available, INTUCH - Excellent, ITD – Good, IVL - Excellent, JAS – not available, JUBILE –
not available, KAMART – not available, KBANK - Excellent, KCE - Very Good, KGI – Good, KKP – Excellent, KTB - Excellent, KTC – Good, LH - Very Good,
LPN – Very Good, M - not available, MAJOR - Good, MAKRO – Good, MBKET – Good, MC – Very Good, MCOT – Very Good, MEGA – Good, MINT -
Excellent, OFM – Very Good, OISHI – Good, PS – Very Good, PSL - Excellent, PTT - Excellent, PTTEP - Excellent, PTTGC - Excellent, QH – Very Good,
RATCH – Very Good, ROBINS – Very Good, RS – Very Good, SAMART - Excellent, SAPPE - not available, SAT – Excellent, SAWAD – not available, SC –
Excellent, SCB - Excellent, SCBLIF – Good, SCC – Very Good, SCCC - Good, SIM - Excellent, SIRI - Good, SPALI - Excellent, STA – Very Good, STEC - Good,
SVI – Very Good, TASCO – Good, TCAP – Very Good, THAI – Very Good, THANI – Very Good, THCOM – Very Good, THRE – not available, THREL – Good,
TICON – Good, TISCO - Excellent, TK – Very Good, TMB - Excellent, TOP - Excellent, TRUE – Very Good, TTW – Very Good, TUF - Good, VGI – Very Good,
WORK – not available.
CIMB Recommendation Framework
Stock Ratings Definition:
Add The stock’s total return is expected to exceed 10% over the next 12 months.
Hold The stock’s total return is expected to be between 0% and positive 10% over the next 12 months.
Reduce The stock’s total return is expected to fall below 0% or more over the next 12 months.
The total expected return of a stock is defined as the sum of the: (i) percentage difference between the target price and the current price and (ii) the forward net dividend yields of the stock. Stock price targets have an investment horizon of 12 months.
Sector Ratings Definition:
Overweight An Overweight rating means stocks in the sector have, on a market cap-weighted basis, a positive absolute recommendation.
Neutral A Neutral rating means stocks in the sector have, on a market cap-weighted basis, a neutral absolute recommendation.
Underweight An Underweight rating means stocks in the sector have, on a market cap-weighted basis, a negative absolute recommendation.
Country Ratings Definition:
Overweight An Overweight rating means investors should be positioned with an above-market weight in this country relative to benchmark.
Neutral A Neutral rating means investors should be positioned with a neutral weight in this country relative to benchmark.
Underweight An Underweight rating means investors should be positioned with a below-market weight in this country relative to benchmark.
*Prior to December 2013 CIMB recommendation framework for stocks listed on the Singapore Stock Exchange, Bursa Malaysia, Stock Exchange of Thailand, Jakarta Stock Exchange, Australian Securities Exchange, Taiwan Stock Exchange and National Stock Exchange of India/Bombay Stock Exchange were based on a stock’s total return relative to the relevant benchmarks total return. Outperform: expected to exceed by 5% or more over the next 12 months. Neutral: expected to be within +/-5% over the next 12 months. Underperform: expected to be below by 5% or more over the next 12 months. Trading Buy: expected to exceed by 3% or more over the next 3 months. Trading Sell: expected to be below by 3% or more over the next 3 months. For stocks listed on Korea Exchange, Hong Kong Stock Exchange and China listings on the Singapore Stock Exchange. Outperform: Expected positive total returns of 10% or more over the next 12 months. Neutral: Expected total returns of between -10% and +10% over the next 12 months. Underperform: Expected negative total returns of 10% or more over the next 12 months. Trading Buy: Expected positive total returns of 10% or more over the next 3 months. Trading Sell: Expected negative total returns of 10% or more over the next 3 months.