Complex Land Cover Classifications and
Physical Properties Retrieval of Tropical
Forests using MultiSource Remote Sensing
By the Faculty of Geosciences, Geo‐Engineering and Mining
of the Technische Universität Bergakademie Freiberg
approved
THESIS
to attain the academic degree of
Doctor
rerum
naturalium
(Dr.rer.nat.)
Submitted
by
MSc
Arief
Wijaya
born on the 24 March 1975 in Jakarta, Indonesia
Assessors:
Prof. Dr. Lothar Ratschbacher, Freiberg, Germany
Prof. Dr. Hermann Heilmeier, Freiberg, Germany
Prof. Dr. Totok Gunawan, Yogyakarta, Indonesia
Dr. Richard Gloaguen, Freiberg, Germany
Dr. Irmgard Niemeyer, Jülich, Germany
Date of the award: 30 April 2010
1
Abstract
The work presented in this thesis mainly focuses on two subjects related to the application of remote sensing data: (1) for land cover classification combining optical sensor, texture features generated from spectral information and synthetic aperture radar (SAR) features, and (2) to develop a non‐destructive approach for above ground biomass (AGB) and forest attributes estimation employing multi‐source remote sensing data (i.e. optical data, SAR backscatter) combined with in‐situ data. Information provided by reliable land cover map is useful for management of forest resources to support sustainable forest management, whereas the generation of the non‐destructive approach to model forest biophysical properties (e.g. AGB and stem volume) is required to assess the forest resources more efficiently and cost‐effective, and coupled with remote sensing data the model can be applied over large forest areas. This work considers study sites over tropical rain forest landscape in Indonesia characterized by different successional stages and complex vegetation structure including tropical peatland forests. The thesis begins with a brief introduction and the state of the art explaining recent trends on monitoring and modeling of forest resources using remote sensing data and approach. The research works on the integration of spectral information and texture features for forest cover mapping is presented subsequently, followed by development of a non‐destructive approach for AGB and forest parameters predictions and modeling. Ultimately, this work evaluates the potential of mosaic SAR data for AGB modeling and the fusion of optical and SAR data for peatlands discrimination. The results show that the inclusion of geostatistics texture features improved the classification accuracy of optical Landsat ETM data. Moreover, the fusion of SAR and optical data enhanced the peatlands discrimination over tropical peat swamp forest. For forest stand parameters modeling, neural networks method resulted in lower error estimate than standard multi‐linear regression technique, and the combination of non‐destructive measurement (i.e. stem number) and remote sensing data improved the model accuracy. The up scaling of stem volume and biomass estimates using Kriging method and bi‐temporal ETM image also provide favorable estimate results upon comparison with the land cover map.
2
Zusammenfassung
Die in dieser Dissertation präsentierten Ergebnisse konzentrieren sich hauptsächlich auf zwei Themen mit Bezug zur angewandten Fernerkundung: 1) Der Klassifizierung von Oberflächenbedeckung basierend auf der Verknüpfung von optischen Sensoren, Textureigenschaften erzeugt durch Spektraldaten und Synthetic‐Aperture‐Radar (SAR) features und 2) die Entwicklung eines nichtdestruktiven Verfahrens zur Bestimmung oberirdischer Biomasse (AGB) und weiterer Waldeigenschaften mittels multi‐source Fernerkundungsdaten (optische Daten, SAR Rückstreuung) sowie in‐situ Daten. Eine zuverlässige Karte der Landbedeckung dient der Unterstützung von nachhaltigem Waldmanagement, während eine nichtdestruktive Herangehensweise zur Modellierung von biophysikalischen Waldeigenschaften (z.B. AGB und Stammvolumen) für eine effiziente und kostengünstige Beurteilung der Waldressourcen notwendig ist. Durch die Kopplung mit Fernerkundungsdaten kann das Modell auf große Waldflächen übertragen werden. Die vorliegende Arbeit berücksichtigt Untersuchungsgebiete im tropischen Regenwald Indonesiens, welche durch verschiedene Regenerations‐ und Sukzessionsstadien sowie komplexe Vegetationsstrukturen, inklusive tropischer Torfwälder, gekennzeichnet sind. Am Anfang der Arbeit werden in einer kurzen Einleitung der Stand der Forschung und die neuesten Forschungstrends in der Überwachung und Modellierung von Waldressourcen mithilfe von Fernerkundungsdaten dargestellt. Anschließend werden die Forschungsergebnisse der Kombination von Spektraleigenschaften und Textureigenschaften zur Waldbedeckungskartierung erläutert. Desweiteren folgen Ergebnisse zur Entwicklung eines nichtdestruktiven Ansatzes zur Vorhersage und Modellierung von AGB und Waldeigenschaften, zur Auswertung von Mosaik‐ SAR Daten für die Modellierung von AGB, sowie zur Fusion optischer mit SAR Daten für die Identifizierung von Torfwäldern. Die Ergebnisse zeigen, dass die Einbeziehung von geostatistischen Textureigenschaften die Genauigkeit der Klassifikation von optischen Landsat ETM Daten gesteigert hat. Desweiteren führte die Fusion von SAR und optischen Daten zu einer Verbesserung der Unterscheidung zwischen Torfwäldern und tropischen Sumpfwäldern. Bei der Modellierung der Waldparameter führte die Neural‐Network‐Methode zu niedrigeren Fehlerschätzungen als die multiple Regressions. Die Kombination von nichtdestruktiven Messungen (z.B. Stammzahl) und Fernerkundungsdaten führte zu einer Steigerung der Modellgenauigkeit. Die Hochskalierung des Stammvolumens und Schätzungen der Biomasse mithilfe von Kriging und bi‐temporalen ETM Daten lieferten positive Schätzergebnisse im
3
Acknowledgments
I think this is the right moment to acknowledge everybody who supported me to complete this doctoral thesis. Firstly, I would like to thank my supervisor, Dr. Richard Gloaguen, the Head of Remote Sensing Group, TU‐Bergakademie Freiberg, for his tremendous supports, both academically and personally. His great contributions on this work and number of great discussions, as well as the way he motivates me to actively participate in international conferences and his critical comments on my scientific publications, I have to acknowledge as well.
I would like to acknowledge Prof. Dr. Hermann Heilmeier, my second supervisor from Interdisciplinary Ecological Centre, TU‐Bergakademie Freiberg, who provides me wonderful supports and time for discussion and for the manuscript corrections.
Deutscher Akademischer Austauschdienst (DAAD) deserves special mention for giving me the scholarship to conduct doctoral study at TU‐Bergakademie Freiberg. Personally, I would like to thank my DAAD referat, Mrs. Susanne Kammüller, Mrs. Helga Islam and Mrs. Hannelore Bossmann for their valuable supports during my stay in Germany.
Dr. Prashanth Reddy Marpu, who helped me in many aspects included in this thesis also for our friendship, thank you. For my colleagues in Remote Sensing Group: Veraldo Liesenberg, Syed Amer Mahmood, Faisal Shahzad, Moncef Bouaziz, and Mathias Leidig, thank you for walking along with me during my study in Freiberg and for many great discussions, as well as for an enjoying moment in Cape Town, I will never forget it. Special thanks to Anja Bretzler for English corrections and abstract translation. For my Indonesian friends: Pak Eka, Pak Gito, Sandi, Alin, Widia, Yesi dan Budi, I would also like to thank for the friendship. To my both parents, H. Harsono and Hj. Wuryaningsih who always pray for me to achieve this level, for their great supports all my life, also for their love and care. To my wife, Ratna, and my lovely daughter, Keisya, thank you for sharing the sadness and happiness with me in Freiberg, also for all your love and pray, and for our precious moment together.
4
Table
of
Contents
Abstract ... i Zusammenfassung ... ii Acknowledgments ... iii Table of Contents ... iv List of Figures ... ix List of Abbreviations ... xiv Chapter 1 Introduction ... 1 1.1 Tropical forest disturbance and monitoring ... 2 1.2 Deforestation in Indonesia and its Impacts on Carbon Storage ... 2 1.3 Research Questions ... 4 1.4 Scientific Challenge and Objectives ... 4 1.5 Materials and Method ... 5 1.6 The Study Areas ... 7 1.6.1 Labanan concession forest (study site 1) ... 7 1.6.2 Tanjung Puting national park (study site 2) ... 11 1.7 Motivations ... 11 1.8 Thesis Outline ... 14 Chapter 2 State of the Art of Research ... 17 2.1 Land Cover Classification using Remote Sensing ... 18 2.2 Image Classification Techniques ... 20 2.3 Tropical Forest Biomass Monitoring and Assessment ... 21 2.4 Definition of Biomass ... 22 2.5 Retrieval of Forest Biomass using RS Data ... 24 2.6 Biomass Model Transferability and Issues on the Model Accuracy ... 26 Chapter 3 Study of Geostatistics Texture Features for Complex Land Cover Mapping ... 29
3.1 Introduction ... 30 3.2 Satellite Image Preprocessing ... 31 3.2.1 Atmospheric corrections approaches ... 31 3.2.2 Radiometric calibration and topographic corrections methods ... 32 3.2.3 Spectral profiles and histogram of the ETM image ... 36 3.2.4 Image corrections results ... 37 3.3 Geostatistics texture features ... 38 3.4 Classification methods ... 41 3.4.1 Support Vector Machine Classification ... 41 3.4.2 Multi Layer Perceptron Neural Network ... 42 3.4.3 Variations of Input Data ... 42 3.5 Results and Discussion ... 43 3.5.1 Texture features generation ... 43 3.5.2 Image Classification ... 44 3.6 Discussion ... 47 3.6.1 Estimation of texture features moving window size ... 47 3.6.2 Behavior of texture features ... 48 3.7 Conclusions ... 52 3.8 Acknowledgments ... 52 Chapter 4 Improved Strategy for the Estimation of Above Ground Biomass using Non‐ Destructive Approach ... 55 4.1 Introduction ... 56 4.2 Data and Methods ... 58 4.2.1 Field data analysis ... 58 4.2.2 Satellite image preprocessing and vegetation indices generation ... 59 4.2.3 Estimation of stand volume ... 60 4.2.4 Above ground biomass (AGB) prediction ... 61 4.2.5 Spatial distribution of the AGB ... 62 4.3 Results and Discussion ... 63
4.3.1 Structure of forest stand properties ... 63 4.3.2 Prediction of stand volume ... 63 4.3.3 Conversion to above ground biomass ... 65 4.3.4 Spatial distribution of AGB ... 68 4.3.5 Relationship between AGB and land cover classification ... 70 4.4 Policy Implications ... 72 4.5 Conclusion ... 72 Chapter 5 Estimation of Forest Properties from Remote Sensing and GIS ... 75 5.1 Introduction ... 76 5.2 Data and methods ... 77 5.2.1 Field Observation Data ... 77 5.2.2 Images Acquisition and Preprocessing ... 77 5.2.3 Methods ... 79 5.2.4 Vegetation Indices Generation and Land Cover Classification ... 81 5.3 Results ... 82 5.3.1 Biomass Mapping using Field Data and GIS ... 82
5.3.2 Prediction and Dynamics of Biomass and Stem Volume using Remote Sensing ... 88
5.3.3 Comparison of AGB and stem volume estimates ... 93
5.3.4 Dynamics of biomass abundance ... 94
5.4 Discussion ... 96
5.4.1 Prediction Results Assessment ... 96
5.4.2 Relationship between GLCM Mean Texture, Land Cover, and Forest Biomass ... 98 5.5 Conclusions ... 99 Chapter 6 Retrieval of Forest Attributes using Bi‐Temporal Remote Sensing Data ... 101 6.1 Introduction ... 102 6.2 Data and Methods ... 104 6.2.1 Image acquisition and preprocessing ... 104
6.2.2 Generation of ancillary remote sensing data ... 108 6.2.3 Field observation data ... 111 6.2.4 Statistical modeling ... 112 6.2.5 Validation ... 113 6.3 Results ... 114 6.3.1 Distribution of forest attributes ... 114 6.3.2 Correlations ... 115 6.3.3 Statistical models ... 116 6.3.4 Results evaluation... 121 6.3.5 Forest attributes prediction from Bitemporal ETM data ... 123 6.3.6 Discussion ... 127 6.4 Conclusions ... 129 Chapter 7 Retrieval of Forest Biomass Using Mosaic SAR data ... 131 7.1 Introduction ... 132 7.2 Data and Methods ... 132 7.3 Results and Discussion ... 134 7.3.1 Estimation of AGB and Stem Volume based on field observation data ... 134 7.3.2 Relationship between radar backscatter and forest properties ... 135 7.3.3 Radar backscatter modeling ... 137 7.3.4 Prediction of AGB and Stem Volume using Radar Backscatter ... 138 7.3.5 Evaluation of AGB Estimate ... 139 7.4 Conclusions ... 141
Chapter 8 Dual‐Polarimetry SAR and Optical Remote Sensing Data for Tropical Peatlands Discrimination ... 143 8.1 Introduction ... 144 8.2 Data and Methods ... 145 8.2.1 Preparation of satellite data and ground truth data collection ... 145 8.3 Methods ... 146 8.3.1 Matrix decomposition of SAR data ... 146
8.3.2 Image classification ... 149 8.4 Results and discussion ... 150 8.4.1 SAR Backscatter Responses ... 150 8.4.2 Canonical Discriminant Analysis ... 151 8.4.3 Classification of Radar Backscatter and Optical Data ... 155 8.5 Conclusion ... 156 8.6 Acknowledgement ... 158 Chapter 9 Summary ... 159 9.1 Thesis Contributions ... 159 9.2 Research Questions Answered ... 159 9.3 Conclusion and Recommendations ... 162 References ... 163 Appendix 1 Curriculum Vitae ... 179 Appendix 2 Publication List ... 182
5
List
of
Figures
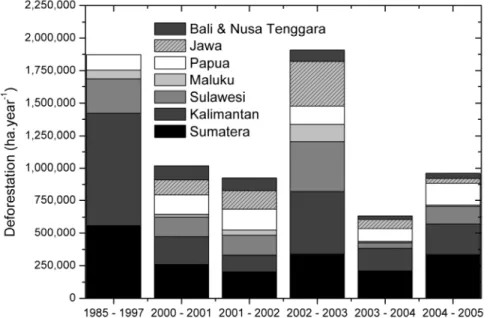
Fig. 1.1 Deforestation rate in five major islands of Indonesia from 1985 – 2005 (MoF,
2006) ... 3 Fig. 1.2 Logging roads along logged over secondary tropical forest in the Labanan
concession (a) and left over timber from illegal forest harvesting caused wide
gaps on forest canopies (b) (Photos by Yohanes Budi Sulistioadi) ... 8 Fig. 1.3 Two study areas in tropical forests of Kalimantan, Central Indonesia,
showing Labanan concession forest, a typical lowland dipterocarp forest in Indonesia (study site 1) and Tanjung Puting national park which comprises of tropical peatlands and swamp forests (study site 2) (Color figures is a
composite of Landsat ETM image band 5, 4 and 3 in RGB channels) ... 9 Fig. 1.4 Annual precipitation rate in the Labanan concession forest (source:
Indonesian meteorological and Geophysics organization, 2007)... 10 Fig. 1.5 Peatland forest in Central Kalimantan Province (a) and destruction of
peatlands due to forest clear cutting (b) (source: www.mongabay.com) ... 13 Fig. 3.1 Spectral responses of multispectral bands Landsat ETM data for different
land cover types (band 6 in the plot represents far infra red band of ETM band 7). The relative reflectance values clearly show the effects of atmospheric attenuations in partially corrected image (top of atmosphere reflectance
profiles) as compared to surface reflectance profiles ... 35 Fig. 3.2 Histogram comparison of the uncorrected ETM image and corrected images
based on a physical based MODTRAN method, and an image based DOS corrections approach. Both methods greatly reduced the attenuation effects in visual and near infra red bands and the histograms of the ETM image, either
corrected using MODTRAN or DOS methods, show similar data distribution. ... 37 Fig. 3.3 The result of topographic corrections in two subsets of the study site. The
topography effects that cause shadows in the back side of the slope were
reduced, although the study area is located in relatively flat region. ... 38 Fig. 3.4 Variogram plots of training data show the spatial variability of land cover
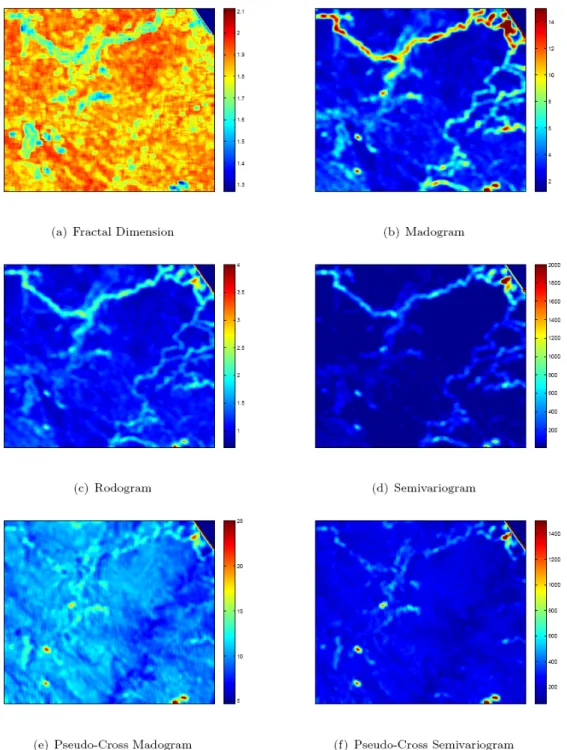
classes under study ... 44 Fig. 3.5 Texture features derived from Landsat ETM data using spatial variability
measures of Geostatistics and fractal dimension approach ... 45 Fig. 3.6 Accuracy assessments of classification results using different texture data.
Each bar represents different variations of texture features used in the
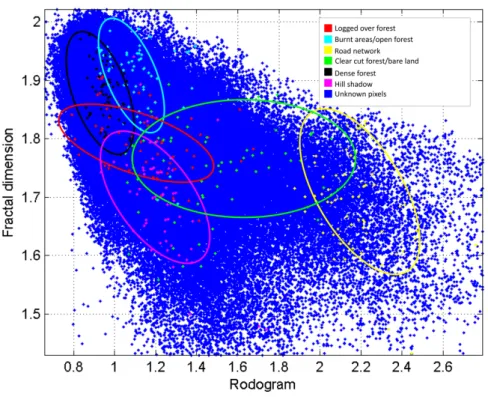
classification as explained in the figure legend ... 46 Fig. 3.7 Feature Space of rodogram and fractal dimension showing spatial
distribution of total pixels on the study area and training data of each land
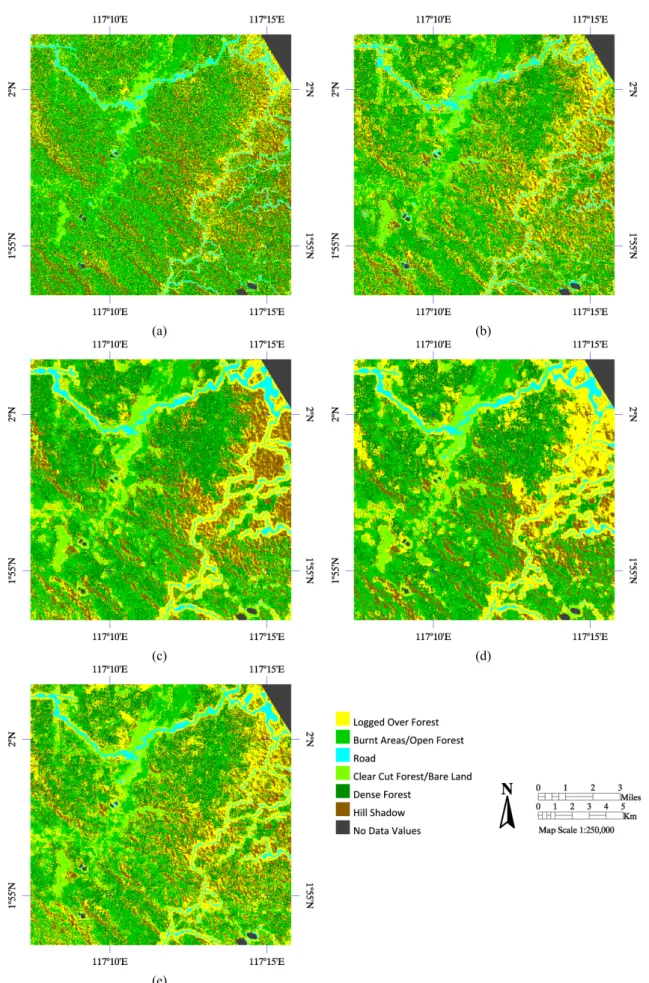
Fig. 3.8 Subsets of maximum likelihood classification using the input data of (a) ETM 12347, (b) ETM 12347 and fractal dimension, (c) ETM 12347, fractal, variogram, pseudo‐cross variogram, (d) ETM 12347, fractal, madogram, rodogram, pseudo‐cross variogram, and (e) ETM 12347, fractal dimension,
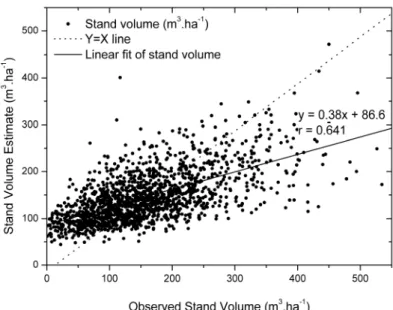
rodogram ... 51 Fig. 4.1 Plot of estimated and measured stand volume ... 65 Fig. 4.2 Comparison of biomass estimates. This study used stand volume – AGB
equations, which include correction factors for dead AGB, below ground biomass. The study by Samalca and Brown estimated AGB from the allometric
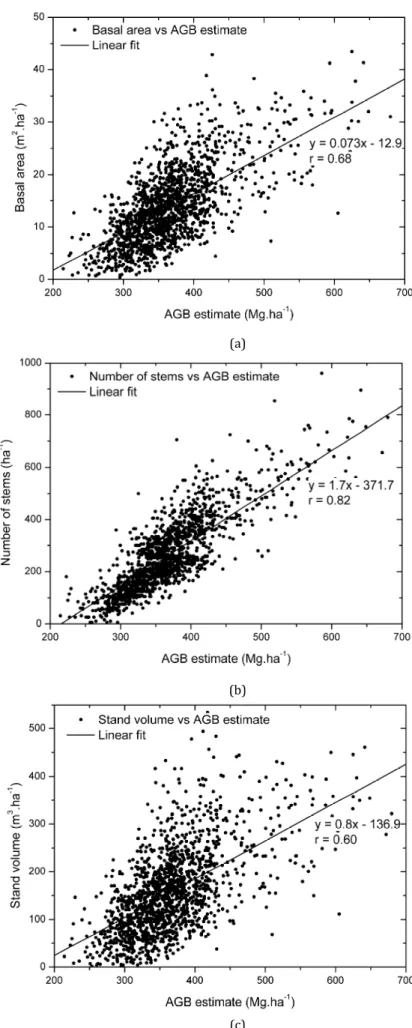
equation to relate dbh and AGB ... 66 Fig. 4.3 Comparison of biomass estimate with (a) basal area, (b) number of stems
per ha, and (c) stand volume ... 67 Fig. 4.4 Kriging interpolation results (a) and error estimate (b) ... 69 Fig. 4.5 Land cover map of the study area based on the interpretation of Landsat 7
ETM+ images and field survey (Modified from Berau Forest Management
Project, 2001) ... 70 Fig. 4.6 Biomass estimate of each land cover class ... 71 Fig. 5.1 Workflow of the study describes two main approaches for estimating the
AGB, using remote sensing method (left shaded box) and combination of field data and GIS method (right shaded box). The middle part of the workflow (non shaded area) explains the classification procedure of multi‐temporal ETM
images (2000 and 2003) performed in this study ... 80 Fig. 5.2 Plot of Stem volume/biomass and number of stems/ha vs. tree diameter
(DBH) ... 85 Fig. 5.3 Landsat ETM of the study area with ETM bands 453 as RGB combination (a),
and modified GIS land cover map of 2001 (b) ... 86 Fig. 5.4 Above ground biomass (AGB) and stem volume of each land cover type,
sorted with the most advanced vegetation structures, i.e. mature forest‐hilly, to
the least complex structures, i.e. shrubs ... 87 Fig. 5.5 Classified Landsat ETM images of year 2000 (a) and 2003 (b) showing
mature forest, very dense forests, dense forests, riparian forest, shrubs and bare soil. The bare soil class was masked out from the classification prior to the
estimates of AGB density and stem volume of each land cover type ... 91 Fig. 5.6 Distribution of GLCM Mean Texture of Different Land Cover Type ... 98 Fig. 6.1 Distribution of forest properties in different diameter at breast height (DBH) ... 115 Fig. 6.2 The linear regression and neural network estimations of basal area (a), stem
volume (b) and biomass (c) against the observed data. The forest attributes
include complete dataset (n = 338)... 121 Fig. 6.3 Comparison of multiple linear regression and neural networks predictions of
basal area (a), stem volume (b) and biomass (c) against observed data by forest classes and z‐test statistics of Wilcoxon signed rank sum test for paired
dependent sample data. The regression and neural networks were tested
separately against the observed test dataset (n = 112) ... 123 Fig. 6.4 Comparison of bitemporal ETM data showing the subsets of ETM00 land
cover classification (a) with the ETM00 above ground biomass (AGB) estimates (b), and the ETM03 land cover map (c) and the AGB predictions of the
radiometrically calibrated ETM03 image (d) ... 126 Fig. 6.5 Distribution of GLCM Mean Texture of Different Land Cover Type. ... 128 Fig. 7.1 Estimates of above ground biomass and stem volume ... 135 Fig. 7.2 Correlation between (a) HH vs AGB, (b) HV vs AGB, (c) HV/HH vs AGB, (d) HH vs stem volume, HV vs stem volume, and (e) HV/HH vs stem volume ... 136 Fig. 7.3 Fitting of AGB model ... 138 Fig. 7.4 Fitting of stem volume model ... 139 Fig. 7.5 Landsat ETM data with band 4,5,3 in RGB channel (a) and the AGB estimate modeled from HV band (b) ... 140 Fig. 8.1 Dual polarimetry SAR data: (a) RGB combination of HH, VV, HH‐VV bands, (b) scattering entropy, (c) anisotropy, and (d) alpha angle ... 147 Fig. 8.2 Radar backscatter, entropy, anisotropy, and alpha angle responses to
different peatland classes ... 151 Fig. 8.3 Sample data plotted on the alpha angle / scattering entropy segmentation
plane. In general, regions 1, 3 and 6 identify regions are dominated by multiple scattering, regions 2, 4 and 7 are dominated by volume scattering, and regions 5
and 8 characterize surface scattering mechanism ... 152 Fig. 8.4 Canonical discriminant function plot. The function 1 and 2 refer to the
functions generated using HH, VV, entropy, anisotropy, and alpha as predictors, employing the coefficient of discriminant analysis ... 154 Fig. 8.5 Comparison of classification accuracy using confusion matrices for each class label, namely shallow peat – secondary forest (PSS), very shallow peat – sparse forest (PVSp), deep peat – primary forest (PDP), shallow peat – primary forest (PSP), palm oil plantation (PO), cultivated lands (CL), non‐vegetated lands (NV) and water body (Wt) ... 155 Fig. 8.6 Maximum likelihood classification: (a) ETM Band 123457, (b) HH, VV, Alpha,
Entropy, (c) ETM Band 123457, HH, VV, Entropy and (d) ETM Band 123457, HH, VV, Entropy‐filtered with majority analysis. The water body (Wt) class label
is masked out for better visual representation ... 157
List
of
Tables
Tab. 1.1 Materials of the study ... 6
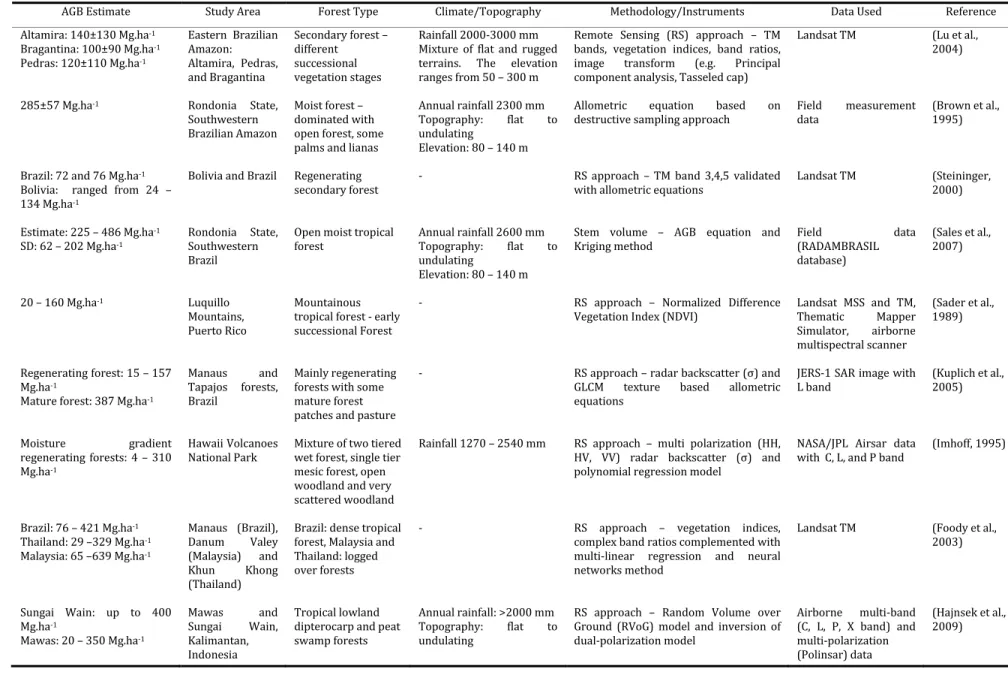
Tab. 2.1 Recent studies on forest biomass assessment ... 23
Tab. 3.1Variance matrix of forest cover classes training data based on Landsat ETM image ... 43
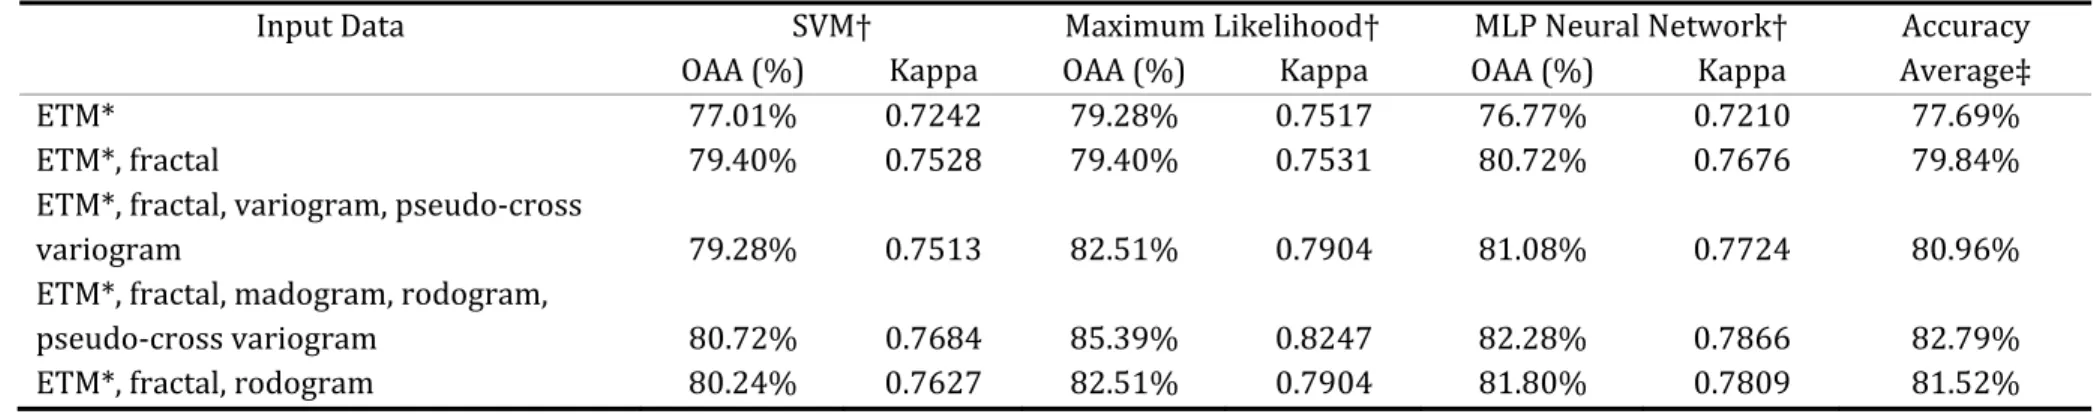
Tab. 3.2 Overall accuracy assessment (OAA) and Kappa statistics of spectral and geostatistics texture data classification ... 49
Tab. 4.1 Descriptive statistics of transect data ... 59
Tab. 4.2 Distribution of forest properties ... 63
Tab. 4.3 Prediction results of stand volume ... 64
Tab. 5.1 Descriptions of sampling plots describing parameters of different forest physiognomies ... 78
Tab. 5.2 Various simple ratios, different NDVIs, complex vegetation indices and image transform layers computed in this study to generate the biomass and stem volume equations ... 83
Tab. 5.3 Correlations between Remote Sensing Data, Stem Volume and Above Ground Biomass (AGB) ... 89
Tab. 5.4 Comparison of stem volume and AGB from complete and selected datasets ... 90
Tab. 5.5 Classification Accuracy of Landsat ETM 2000 and 2003 ... 92
Tab. 5.6 Comparison of AGB and stem volume estimates for particular land cover type ... 93
Tab. 5.7 Percentage of Land cover change from 2000 to 2003 based on Landsat ETM data classification (percentage is shown in brackets) ... 94
Tab. 5.8 Dynamics of Forest Biomass (AGB) and Stem Volume (Vol) from 2000 to 2003 ... 95
Tab. 5.9 Above ground biomass estimates computed in this study using different allometric equations developed for tropical forest environment ... 97
Tab. 6.1 Description of sample data showing number of plots, total stems, mean diameter at breast height (DBH), basal area and stem volume for different forest physiognomies ... 106
Tab. 6.2 Various simple ratio, different NDVIs, complex vegetation indices and image transform layers computed in this study to generate the biomass and stem volume equations ... 109
Tab. 6.3 Correlations between remote sensing data and forest biophysical parameters ... 117
Tab. 6.4 Statistics and validation of linear regression analysis ... 118 Tab. 6.5 Statistics and validation of neural networks regression analysis ... 119 Tab. 6.6 Ordinary least square regression on randomly selected training pixels (n =
105844) and the root mean square error (RMSE) calculated from the testing pixels (n = 52921); α is the fitted intercept, β is the fitted slope, σα and σβ are the
standard deviation, and r is the correlation coefficient. ... 124 Tab. 6.7 Comparison of mean intensities of randomly selected testing pixels (n =
52921) for the ETM 2003 before and after normalization against the image reference (ETM 2000), with paired t‐tests for equal means (p‐value = 0.01). The statistical tests were calculated from the uncalibrated ETM03 and ETM00 data ... 124 Tab. 6.8 Comparison of variances of the testing pixels (n = 52921) for the ETM 2003 before and after normalization against the image reference (ETM 2000), with F‐ tests for equal variances (p‐value = 0.01). The statistical tests were calculated from the uncalibrated ETM03 and ETM00 data ... 124 Tab. 6.9 Forest attributes estimated from the sampling plots locations using the
predictors of ETM00 and calibrated ETM03. The forest attributes were
predicted using the regression models generated using the ETM00 data. ... 125 Tab. 7.1 Statistics of forest biophysical properties ... 134 Tab. 8.1 Characteristics and carbon contents below the ground of different peatlands found in the study area ... 148 Tab. 8.2 Tests of Equality of Group Means ... 152 Tab. 8.3 Classification results and accuracy assessment based on cross validation (a,b) ... 154 Tab. 8.4 Accuracy assessment of the classification using ETM band 123457, HH, VV and entropy, and filtered with majority analysis using 3×3 moving window* ... 158
6
List
of
Abbreviations
AGB Above Ground Biomass
ALOS Palsar Advanced Land Observing Satellite/Phased Array type L‐band Synthetic Aperture Radar ARVI Atmospherically Resistant Vegetation Index ASTER Advanced Spaceborne Thermal Emission and Reflection Radiometer ATCOR Atmospheric Corrections AVHRR Advanced Very High Resolution Radiometer BA Basal Area BFMP Berau Forest Management Project BGB Below Ground Biomass
BMG Badan Metereologi dan Geofisika (Indonesian Metereological and Geophysical Institution)
BRDF Bidirectional Reflection Distribution Function
CIRAD Center of International Cooperation in Agronomic Research for the Development dbh Diameter at Breast Height DEM Digital Elevation Model DN Digital Number DOS Dark Object Subtraction EOS Earth Observation Satellite ETM Enhanced Thematic Mapper EVI Enhanced Vegetation Index FAO Food and Agriculture Organization FWI Forest Watch Indonesia GEMI Global Environmental Monitoring Index GFW Global Forest Watch GIS Geographic Information System GLCM Grey Level Co‐occurrence Matrix Gt Gigaton IDL Interactive Data Language JAXA Japan Aerospace Exploration Agency JERS‐1 Japanese Earth Resources Satellite, number 1 Lidar Laser Imaging Detection and Ranging LULUCF Land Use, Land Use Change and Forestry MAD Multivariate Alteration Detection Mg Megagram MIR Middle Infra Red MLC Maximum Likelihood Classification MLP‐NN Multi Layer Perceptron Neural Network MODIS Moderate Resolution Imaging Spectroradiometer MoF Ministry of Forestry
MONCER Design and Development of an Effective Monitoring and Certification System to Support Sustainable Management of Production Forest in Indonesia MSAVI2 Modified Soil Adjusted Vegetation Index 2 MSE Mean Square Error MSS Multispectral Scanner NDVI Normalized Difference Vegetation Index NIR Near Infra Red NSEW North‐South‐East‐West OAA One Against One OAA One Against All OAA Overall Assessment Accuracy PCA Principal Component Analysis Polinsar SAR Polarimetry and Polarimetric Interferometry Radambrasil Radar Mapping of Brazil RGB Red Green Blue RMSE Root Mean Square Error RS Remote Sensing RTRWP Rencana Tata Ruang Wilayah Propinsi (Provincial Land Use Planning) RVoG Random Volume over Ground SAR Synthetic Aperture Radar SAVI Soil Adjusted Vegetation Index SD Standard Deviation SEE Standard Error Estimate SIR‐C Spaceborne Imaging Radar, C‐Band SR Simple Ratio SRTM Shuttle Radar Topography Mission SSC Single Look Slant Range Complex
STREK Silvicultural Techniques for the Regeneration of Logged Over Forest in East Kalimantan SVM Support Vector Machine TC Tasseled Caps TM Thematic Mapper TOA Top of Atmosphere TSP Temporary Sampling Plot UNFCCC United Nations Framework Convention on Climate Change UTM Universal Transverse Mercator VI Vegetation Index WGS World Geodetic System
1
Chapter
1
Introduction
Introduction
ABSTRACT
The research presented in this thesis deals with the development of alternative approaches to improve the classification accuracy of remotely sensed data and to propose an alternative non‐destructive approach for mapping of above ground biomass over tropical forest landscape. This chapter introduces the background of the study, explaining tropical forest disturbance and monitoring and deforestation in Indonesia and its impacts on carbon storage. Also, research questions, scientific challenges and objectives, materials and methods used for the study, description of the study areas, motivations behind the present study, and a thesis outline are briefly explained.
Keywords: introduction, background, research questions, scientific challenge, objectives,
materials and methods
1.1
Tropical
forest
disturbance
and
monitoring
Forest is a specific territory of ecosystems and consists of vegetation formation with a continuous canopy of trees (FAO, 2003). Forest ecosystems are distinguished depending on the dominant vegetation type, stand structure, climate, soil type, and topography. Based on the local climate forest ecosystems may be divided as tropical, boreal and temperate forests. In the last two decades, tropical forest is the most severely degraded and deforested compared to other forest ecosystems, mainly due to anthropogenic factors and natural hazards. Tropical rainforests belong to the most heterogeneous ecosystems and exhibit the highest biodiversity in the world, comprising more than half of all the world plant and animal species (Butler, 2006). Although the tropical rainforests cover only less than 6% of land surface on the earth, they play an important role for the global carbon cycle, as tropical rainforests store 30% of all terrestrial carbon (up to 200 Mg/ha) and sequester about 12 Mg C/ha per year, i.e. 22% of all carbon fixed on Earth. Carbon dioxide is released from forest ecosystems during decomposition process or when the forest is disturbed or destroyed, either due to natural hazards or human activities. Tropical forest ecosystems recently have been severely devastated, mainly due to excessive forest encroachments, such as timber harvesting, conversion to agricultural land and settlement area, and exploitation of non‐ timber forest resource (Collins et al., 1991).
Monitoring of forest resources is essential to assess their carrying capacity and to observe the dynamics of forest cover changes. Mapping of forest cover is an ultimate way to assess forest cover changes and to study the forest resource within a period of time (Wijaya et al., 2008b). Estimation of forest biophysical parameters, such as stand volume and woody biomass is also important for forest inventory and management and for scientific purposes (Parresol, 1999).
1.2
Deforestation
in
Indonesia
and
its
Impacts
on
Carbon
Storage
Indonesia possesses one of the largest tropical forests after the Amazonian in Brazil and the tropical rainforest of the Republic of Congo, representing 10% of the remaining tropical forests in the world (FWI/GFW, 2002). With total terrestrial areas of 187.9 million hectares, the Indonesian Ministry of Forestry (MoF) noted that 133.7 million hectares or more than 70% areas were designated as forests (MoF, 2006). These do not include inland water ecosystems which cover 3.4 million hectares. Tropical forests in Indonesia support very high biodiversity and are considered among the richest ecosystems in the world. More than 16% of the entire world’s bird species, 11% of plant species, and 10% of all mammals are
found in the Indonesian tropical forests. Among the unique species found in this region are the endangered species orangutan and Sumatran tiger. Compared to other South East Asian countries, Indonesia has the highest deforestation rate, and this is of major local and global concern (MoF, 2002). We noted that about 1.87 million ha/year of Indonesian forests were deforested from 1985 to 1997. This situation worsened during a severe drought event of El Nino in 1997 – 1998 causing sporadic and devastating fires in most tropical rainforests in South East Asian region, especially in Indonesia (Page et al., 2002). After the El Nino drought event in 1998, the government updated the database recording forest losses in five main islands of Indonesia, and reported that deforestation rate from 2000 – 2005 was over 1 million ha/year, whereas in 2002 – 2003 the deforestation rate reached more than 1.9 million ha (Fig. 1.1).
Fig. 1.1 Deforestation rate in five major islands of Indonesia from 1985 – 2005 (MoF, 2006) Deforestation, peat degradation and forest fires are major contributors of carbon emissions in Indonesia (Sari et al., 2007). The amount of carbon released from deforestation and forest fires is five times greater than that of the non forestry sector, and the number of carbon released from the forestry sector has made Indonesia as one of the top five carbon emitters in the world (Sari et al., 2007). Of about 19 billion tons of terrestrial carbon stocks (80% of all terrestrial carbon) in Indonesia are stored in the forested lands, and a single devastated forest fire, such as El Nino event in 1997, had released 0.19 – 0.23 Gt (1 Gigaton = 1 billion tons) of carbon to the atmosphere only from peatland forests (Page et al., 2002). If this
of mean annual global carbon emission from fossil fuels were liberated in 1997 (Hoekman, 2007).
We consider it as scientifically challenging and desirable to develop accurate and adequate means of forest cover mapping and modeling the forest biophysical parameters, such as biomass, over larger areas. The research proposed here aims at the development of remote sensing and geographical information systems, which are relevant for the mapping of forest cover and the estimation of forest biophysical parameters. The application of remote sensing data is the only possible way for effectively and efficiently extracting this information over large areas.
1.3
Research
Questions
Several research questions are to be answered in this present work and explained as follows.
1. Which texture features are useful to improve the classification accuracy over tropical forest landscape?
2. How can multi‐source remote sensing coupled with in situ data improve the assessment of above ground biomass (AGB)?
3. Which types of remotely sensed data and vegetation indices are important for the modeling of the AGB?
4. How do land cover changes affect the dynamics of forest biomass?
5. How can AGB changes be estimated using bi‐temporal satellite data? What is the predictive ability of linear regression method as compared to a non‐parametric neural network model?
6. Which features generated from Synthetic Aperture Radar (SAR) data are more important to assess the biomass? How accurate is the estimated biomass model?
7. How does the combination of Landsat ETM sensor and SAR data improve the classification of peatland forest?
1.4
Scientific
Challenge
and
Objectives
The objectives of this thesis are:
1. To briefly review already published approaches for the mapping of forest cover and modeling of forest parameters, above ground biomass (AGB) in particular, defining the limitations of these approaches and identifying possibilities for innovation in mapping the forest biomass distribution.
2. To investigate the possibility of combining texture data with Landsat ETM data for improving the accuracy of land cover classification in complex forest landscape.
3. To develop a non‐destructive approach to model the spatial distribution of above ground biomass applying the spectral information and vegetation indices, modeled using neural networks method and kriging interpolation technique.
4. To develop a model to estimate the above ground biomass (AGB) using Landsat ETM data, vegetation indices, and digital elevation models (DEM), and to study the possibility to assess the AGB from a bi‐temporal dataset. 5. To investigate the potential of mosaic ALOS Palsar data for AGB modeling and to study the possibility for mapping the AGB over larger forest regions. 6. To combine the Landsat ETM data and SAR data for land cover classification in tropical lowland‐ and peatland forests, and to assess the drawbacks of the data combination. 7. To make an integrated assessment of the complexity of deforestation and forest
degradation in relation to the forest cover dynamics and the modeling of the AGB over a tropical forest environment.
1.5
Materials
and
Method
This thesis is generally divided into two main topics: (1) land cover classification in complex forest landscape using optical data and geostatistics texture features and (2) estimation of biophysical forest parameters employing optical data and synthetic aperture radar (SAR) image. Besides, a land cover map, precipitation data and digital elevation models were also collected as additional information (Tab. 1.1).
The Landsat ETM data preprocessing was conducted beforehand. Corrections of atmospheric and topographic effects were carried out using a standard method explained in Chapter 3. The SRTM DEM was resampled into a 30 m resolution to fit with the ETM data. The topographical map, land use map, and SAR data were georeferenced with the ETM data and projected into UTM coordinate system and WGS84 datum. Descriptions of the satellite data corrections, image preparation, filtering, classification technique, and the modeling of biophysical parameters from RS data are briefly explained further in each chapter.
Tab. 1.1 Materials of the study
Data type Acquisition date Path/Row Spatial
resolution
Season Description
Landsat ETM 31 May 2003 117/59 30 m Beginning of dry
season
Clear atmosphere, with almost no clouds
Landsat ETM 26 August 2000 117/59 30 m Dry season Hazy conditions, some clouds persist
Mosaic ALOS Palsar 2006 ‐ 2008 50 m Image preprocessing was conducted
by JAXA
SRTM DEM 117/59 90 m Downloaded from USGS website
TerraSAR X data 13 March 2008 6.5 m Mid wet season Single Look Sland Range Complex
(SSC) image, dual‐polarization (HH and VV)
Land use/land cover map of Kalimantan
2002 Generated from 1:50,000 topography
map and observation on the ETM data (National Surveying Agency of Indonesia)
Peatlands map of Kalimantan
2004 Provided by Wetlands International –
Indonesia Programme
Precipitation data Obtained from Indonesian
meteorological and Geophysics organization (Badan Metereologi dan Geofisika/BMG)
Forest inventory data April 1997 – March 1998
Circular sampling plot, data was
collected in transect.
Field work data September 2004 Circular sampling plot, data was
collected based on purposive sampling
Ground truth data March 2007 Collecting additional ground truth
1.6
The
Study
Areas
1.6.1
Labanan
concession
forest
(study
site
1)
Chapter 3, 4, 5 and 6 of this thesis consider the Labanan concession forest in Berau District, East Kalimantan Province, Indonesia. The concession area consists of mostly logged over/secondary forests mixed with some primary forest patches (Fig. 1.2). Several research projects have been conducted in this forest concession.
Silvicultural Techniques for the Regeneration of logged over forest in East Kalimantan (STREK) Project, a cooperation between the Center of International Cooperation in Agronomic Research for Development (CIRAD) and the Indonesian Ministry of Forestry (MoF) was conducted from 1989 to 1996 to develop silvicultural and management rules for sustainable forest productivity (Fauzi, 2001). Berau Forest Management Project (BFMP) was established from 1996 to 2002 as a cooperation between the European Union and the MOF of Indonesia continuing the related research to support sustainable forest management (BFMP, 1997).The Ministry of Forestry gave a special status to Labanan concession in 1999 as a research forest, which was then certified by ISO 14001 in 2001. Currently, design and development of an effective monitoring and certification system to support sustainable management of production forest in Indonesia (known as the MONCER project) is operating. This project aims to design and to implement a practical, purpose‐oriented, effective and efficient forest certification system for supporting a monitoring system of sustainable forest management (Widayat, 2005).
The study area is geographically situated along the equator at the coordinates of 1°45’ to 2°10’ N, and 116°55 to 117°20’ E and has a size of 83,240 hectares, of which 54,567 ha are production forests, 26,997 ha are limited production forests, and 1,676 ha are non‐ production forests (Fig. 1.3). According to Provincial land use planning (Rencana tata ruang wilayah propinsi: RTRWP), 81,564 ha were allocated for forest areas (kawasan budidaya hutan) and 1,676 ha were allocated for non‐forest areas (kawasan budidaya non‐ kehutanan) (Wijaya et al., 2005).
The forest area is mainly situated on inland of coastal swamps and consists of undulating to rolling landforms with isolated masses of highly and high mountain (BFMP, 1997). The lowland landscape is derived from sediments, mudstone, siltstone, sandstone and gravel, laid down in the Miocene and Pliocene periods, and recent alluvial deposits.
(a) (b) Fig. 1.2 Logging roads along logged over secondary tropical forest in the Labanan concession (a) and left over timber from illegal forest harvesting caused wide gaps on forest canopies (b) (Photos by Yohanes Budi Sulistioadi)
Fig. 1.3 Two study areas in tropical forests of Kalimantan, Central Indonesia, showing Labanan concession forest, a typical lowland dipterocarp forest in Indonesia (study site 1) and Tanjung Puting national park which comprises of tropical peatlands and swamp forests (study site 2) (Color figures is a composite of Landsat ETM image band 5, 4 and 3 in RGB channels)
Significant erosion has developed a landscape which is relatively low lying, but broken. Relative relief is seldom more than 50 m, although the elevation reaches almost 500 m above sea level in the hills to the west of the Labanan concession. Wetlands are not particularly important in the Labanan area with only limited swampy areas along the Segah and Kelai rivers. Soils are generally well drained, red clayey and highly leached, i.e. poor in nutrients, tropudults or paleudults (red‐yellow podzolics in the Indonesian classification), but with a relatively high silt and fine sand content. The soils are highly erosion prone. Land slides are common on road cuttings and on steeper uncleared land. Slopes in the region are generally rolling to steep and very steep in places, though slope lengths are not often long. Selective felling of the natural forest with reforestation of degraded areas is the best use for most of the forested land (Mantel, 1998).
Fig. 1.4 Annual precipitation rate in the Labanan concession forest (source: Indonesian meteorological and Geophysics organization, 2007)
The climate is wet tropics with rainfall ranging from 1800‐2000 mm per year on average at Tanjung Redeb (capital of Berau municipality), but rising rapidly inland to almost 3000 mm (BFMP, 1997). The months of June to October are drier; the wettest months are from November through to February. No months receive less than 30 mm on average, though extended dry spells do occur they are not annual or regular (Sist and Nguyen‐Thé, 2002). The average annual and monthly precipitation rates in the Labanan concession are 1840 mm and 51 mm, respectively (Fig. 1.4). Temperatures are between 23 ‐ 33 degrees Celsius with a long term average of 26 degrees Celsius. Relative humidity is 91% or higher and
winds seldom exceed 9 km/hour. The forest is a mixed lowland dipterocarp forest with Shorea, Dipterocarpus and Vatica as the predominant genera in the pristine forest followed by the Euphorbiaceae family (BFMP, 1997).
1.6.2
Tanjung
Puting
national
park
(study
site
2)
Chapter 7 of this thesis considers another study area over peatland forests in Central Kalimantan Province. The Borneo is actually the third largest island in the world that is comprised of Malaysian and Brunei Darussalam territories and for the most part the Indonesian provinces of Kalimantan. The Kalimantan is approximately 543,900 km2 or 73%
of Borneo and has a population of 11.3 million (Hecker, 2005). The Indonesian Borneo is divided into four provinces: Kalimantan Barat (West Kalimantan), Kalimantan Tengah (Central Kalimantan), Kalimantan Selatan (South Kalimantan), and Kalimantan Timur (East Kalimantan).
Peatland forests in Central Kalimantan are one of the few regions in the world, where unique and valuable tropical peatlands can be found. A peat layer of up to 20 meters deep mostly covers this area of more than 1 million hectares of peatlands in this province (Wetlands International, 2007). Unfortunately, a large portion of the peatlands is severely degraded and only small peat swamp forests remain. Nowadays, the degraded peatlands which were used for agriculture, industrial plantations, and settlements, are mostly abandoned. As a consequence, these areas continuously suffered from major forest fires and river floods (Wetlands International, 2007). This study considers the Southern part of Central Kalimantan province, which is one of the most problematic areas in terms of peatland degradation in SE Asia (van Beukering et al., 2008). The study site includes Tanjung Puting National Park, which has a total size of 400 thousand hectares and is mostly dominated by tropical heath forest, peat swamp forest and mangrove forest (Fig. 1.5). This national park is recognized as one of the world biosphere reserves by the United Nations and forms the largest protected peat swamp forests in the SE Asia. It is situated between 2°35’ – 3°20’ South and 111°50’ – 112°15’ East (Fig. 1.3) (Susilo, 1997). The national park has been highly degraded and deforested at an alarming rate, mainly due to illegal forest harvesting, opening of agricultural lands, and conversion to palm oil plantations.
1.7
Motivations
A considerable amount of research has been done in improving the accuracy of land cover classification and the modeling of biophysical properties over forested regions using remote
sensing data and approaches. Nevertheless, the following encourages this study which mainly has an ultimate goal to enrich scientific knowledge and references of this particular subject.
Transferability problem of available biomass models
Transferability of biomass model developed in tropical forest environments and estimated from remote sensing data is rather limited (Foody et al., 2003). This is because the allometric biomass models generated from a particular forest landscape cannot be easily applied for another forest region. We, therefore, are encouraged to generate the biomass model which is suitable for tropical forest environment in Indonesia, as well as to compare its performance with the existing model estimated from other forest regions.
To develop an alternative approach in combining optical and microwave sensors for land
cover classification
Data fusion is the seamless integration of data from distinctive sources. Optical and microwave RS are complementary to each other as their characteristics are different. Optical data basically measures the physical properties of ground objects, whereas the SAR data provides more information about geometric properties of the objects (Lillesand and Kiefer, 1994). Moreover, the capability of microwave data to penetrate the atmosphere under virtually all conditions can also give an advantage for the fused data.
The fusion of both data can be based on pixel‐level or feature‐level image fusion. Pixel‐level image fusion combines pixel by pixel of the reflectance of optical images and radar backscatter to generate the fused image, which has more information about object features (Wu and Chen, 2007). Feature‐level image fusion on the other hand, is conducted by combining both sensors in the classification processes employing the neural networks method (Kuplich, 2006), or by linking the optical and SAR data classification results applying Dempster‐Shafer evidence theory (Wu and Chen, 2007). Another alternative is to fuse optical and microwave sensors using a Bayesian approach which jointly uses the classification results of individual sensors to improve class labeling using statistical measures (Venkataraman et al., 2004). The fusion of optical and SAR data has recently been of great interest for land cover classification because SAR data are widely available, and due to the fact that the data fusion is promising resulting in more accurate information of the classified image.
(a) (b) Fig. 1.5 Peatland forest in Central to forest clear cutting (b) (source:
To enrich scientific studies on biomass over another tropical rainforests environment beside the Amazon A great number of studies, as exhibited in Tab. 1.1, has been conducted in the tropical forest of the Amazon, and only few studies were carried out in another tropical forest landscapes, such as in Indonesia. The forested lands in this region were heavily deforested at an alarming rate and greatly devastated especially after the severe El Nino drought and mass forest fires in the 1990’s (Stibig and Malingreau, 2003). Few references are found conducting forest biomass studies in the South East Asia region especially those implementing remote sensing data (Foody et al., 2001). We found even fewer studies conducting field measurement approach for estimating forest biomass in Indonesia (Samalca, 2007).
This motivates us to undertake this study in order to enrich the knowledge and scientific references on biomass estimation and modeling over tropical forest regions, especially in Indonesia.
1.8
Thesis
Outline
In chapter 2, the state of the art of research is briefly presented. A literature review of some recent publications on land cover classification is presented first, followed by a review of different image classification techniques applied in remote sensing. The review on forest biomass monitoring and assessment is explained afterwards, followed by some recent studies on the retrieval of forest biomass using remote sensing approaches. Finally, the issues of biomass model transferability and model accuracy are reviewed.
Chapter 3 of this thesis focuses on the classification of Landsat ETM data and geostatistical texture features to increase the classification accuracy of complex land cover mapping. We compared the conventional maximum likelihood method, support vector machine (SVM) classification, and neural networks algorithm. Different variations of the texture features were tested to find the best input combination for the classification.
The study proposing a non‐destructive method for estimating above ground biomass (AGB) from remote sensing is presented in chapter 4. Landsat ETM data combined with number of stems are used to model the AGB using neural networks algorithm and kriging method. The estimation is compared with recent studies and the results are discussed.
Chapter 5 presents the utility of remote sensing, GIS and field observation data to model AGB and stem volume, as well as their changes over time. Ancillary data from the Landsat ETM bands reflectance, e.g. vegetation indices, PCA bands and GLCM texture, are generated and used for the modeling. Two land cover maps are generated from the Landsat ETM 2000
and 2003 to predict the AGB over different forest classes. The biomass level and its changes over time are then estimated.
In chapter 6, the quantification of forest parameters in different successional forest stages is investigated. This information is useful for understanding the relationship between different regenerating stages and ecosystem changes. For the modeling of forest attributes, the multiple linear regression technique and neural networks approaches were used and compared. A possibility to estimate the forest attributes from bitemporal Landsat ETM data was conducted by normalizing the second Landsat ETM data using the multivariate alteration detection (MAD) method. The retrieval of AGB and stem volume from SAR data is experimented in chapter 7, where mosaic ALOS Palsar data is employed to model both forest properties. The radar backscatter and their ratios are used to model the forest properties employing non‐linear models. The results are discussed afterwards. Integration of SAR backscatter and optical data for peatlands classification is presented in chapter 8. The TerraSAR X data and Landsat ETM data are used to discriminate peatlands in tropical swamp forest of Central Kalimantan. Discriminant analysis is used to select the input data which are useful for the classification. Using a maximum likelihood classification technique, the fusion of SAR and Landsat ETM data is conducted and the accuracy is assessed using confusion matrices.
2
Chapter
2
State
of
the
Art
of
Research
State
of
the
Art
of
Research
ABSTRACT
This chapter presents a brief review on the application of remote sensing data approaches for land cover mapping and forest parameters modeling and estimation. It begins with a brief description on land cover classification using remote sensing data and approaches, followed by a description of image classification techniques. Subsequently, reviews on tropical forest biomass monitoring and assessment are explained. Some theoretical and practical definitions of biomass are also described, including the definition of biomass used for this particular study. Furthermore, references related to the retrieval of forest biomass using remote sensing data and the limitation of biomass model transferability and issues on the model accuracy are presented.
Keywords: image classification techniques, model transferability, forest, land cover
classification, remote sensing, biomass
The topics of land use, land use change and forestry (LULUCF) have become more critical issue for Indonesian rainforests for over the last two decades, since a large number of forests in the country has been severely degraded, deforested, and/or converted into another land use, such as for cultivation, urban areas, mining areas, etc. Forest management practices for supporting sustainable forest management greatly depend on the development of new methods and techniques based on scientific approaches. The importance of remote sensing data for forest inventory and management has increased since the conclusion of the first meeting related to global change issues, which was mainly encouraged by the discussions on carbon emissions explaining a huge number of mature tropical forests conversion into different landscape and/or various secondary forest stages (Ramankutty et al., 2007). This chapter explains the state of the art of the research of remote sensing applications, mainly focusing on land cover classification and biomass modeling and estimation.
2.1
Land
Cover
Classification
using
Remote
Sensing
Provision of accurate information on land use/land cover requires an accurate land cover map, mainly generated from the interpretation and classification of remote sensing data. Remote sensing and digital image processing research have produced many approaches to multi‐spectral land cover classification over the last two decades, with major differences in accuracies attributed to both training methods and classification algorithms (Yool, 1998). Optical sensors, e.g. Landsat data, are probably the most popular sensors for land cover classification because the data has relatively high temporal resolution and is widely available. Wide variations of spatial resolutions, e.g. 15m (ASTER), 30m (Landsat), 250m and 500m (MODIS), and 1km (AVHRR), have also given flexibility to the data applicability. Upon image corrections and preprocessing, the classification employing these data are relatively straightforward, and the complexity of the classification procedure greatly depends on the selected classification algorithm and methods. Spectral information (normalized digital number or DN) of the satellite data is usually used as input for the classification (Wijaya et al., 2008b).
Vegetation indices (VI’s) are commonly used as an additional input of spectral data to increase the discrimination of different forest classes or forest disturbances. Phenological changes of different tree species were captured using the conjunction of Landsat MSS and TM data, normalized difference greenness index (NDGI), and normalized difference vegetation index (NDVI) (Wolter et al., 1995). The indices, which can be generated from single bands, band ratios, vegetation indices and multivariate components of the Landsat
data, are also useful to assess burn severity due to forest fires (Epting et al., 2005). Despite of its advantage, the sensitivity of vegetation indices is rather limited to some wavelength windows, such as red or near infra red bands, and the saturation problem which commonly occurs for some VI’s also reduces their applications (Huete et al., 1997). In addition to spectral information, the utility of spatial information in the form of texture features may also be useful for the image classification. The inclusion of texture information involves the information from neighboring pixels which is important to characterize the identified objects or regions of interest in an image (Haralick et al., 1973). The texture data is particularly important if the classification involves no dominant distinct object (i.e. object with particular shape or boundary) and spatial correlation of neighboring pixels of that particular object forms similar texture variation (Jakomulska and Clarke, 2001). This study experimented with the classification of texture layers generated using geostatistics approach, as demonstrated in several recent studies (Chica‐Olmo and Abarca‐Hernandez, 2000; Miranda and Carr, 1994; Miranda et al., 1998; Zhang et al., 2004). These studies found that the classification accuracy is notably improved when the geostatistics texture layers were used as additional input for spectral data classification. Additionally, the inclusion of texture features calculated from fractal dimension is also experimented in the present study. Application of synthetic aperture radar (SAR) data for land cover classification is greatly encouraged by the problem of optical data particularly in humid and tropical regions due to the presence of persistent clouds (Salas et al., 2002). The utility of multi‐wavelength SAR data was demonstrated by Kuplich et al. (2005) combining JERS‐1, SIR‐C and XSAR and optical bands from Landsat TM for discriminating regenerating forest stages in the tropical Amazon. Classification of flooded and upland vegetation in tropical forest landscape was also conducted with success using L‐band JERS‐1 data (Miranda et al., 1998). Recent generation of ALOS Palsar data has been planned to cover global tropical forest environments to frequently map the forest cover over these regions. This is initiated by the Kyoto and Carbon Initiative Project and fully supported by JAXA, the provider of ALOS Palsar data (Rosenqvist et al., 2008). However, the great challenge in remote sensing study recently is to combine optical and microwave (i.e. SAR data) sensors for improving the classification accuracy and to generate better visual characteristics of the classified image (Lu, 2006). Attempts to combine optical and SAR data are also experimented in the present study, combining both sensors for the classification of peatlands in tropical swamp forest and to discriminate forest regenerating stages in a tropical lowland forest regime.
2.2
Image
Classification
Techniques
Multispectral image classifications are basically attempts for finding patterns in the spectral response in relation to land cover groups known to be present. The thematic map describing forest characteristics is often t