NBER WORKING PAPER SERIES
WHAT DO WE KNOW ABOUT CAPITAL STRUCTURE? SOME EVIDENCE FROM
INTERNATIONAL DATA
Raghuram G. Rajan Luigi Zingales
Working Paper No. 4875
NATIONAL BUREAU OF ECONOMIC RESEARCH 1050 Massachusetts Avenue
Cambridge, MA 02138 October 1994
Rajan thanks the Center for Research on Securities Prices while Zingales thanks the Graduate
School of Business for funding. This project was also made possible with a grant from the
Center for International Business Research at the University of Chicago. We thank Patricia
O'Brien, Douglas Diamond, Eugene Fama, Steve Kaplan, Anil Kashyap, Merton Miller, James Seward and Rob Vishny for helpful discussions, and participants in workshops at the Universityof Chicago (Finance and Junior Faculty Lunch Group), HEC-University of Montr6al, Indiana
University, University of Maryland, NBER Summer Institute, the Stockholm School of
Economics and the 1994 WFA meetings for comments. We are indebted to Eduardo Gonzales for excellent research assistance, and Andrew Alford for invaluable help in getting us acquainted with Global Vantage. This paper incorporates part of a C.R.S.P. working paper entitled "Notes on International Capital Structure". This paper is part of NBER's research program in Corporate Finance. Any opinions expressed are those of the authors and not those of the National Bureau of Economic Research.© 1994 by Raghurarn G. Rajan and Luigi Zingales. All rights reserved. Short sections of text,
not to exceed two paragraphs, may be quoted without explicit permission provided that full
Thirty six years and hundreds of papers aner Modigliani and Miller's seminal work, what do we really know about corporate capital structure choice? Theory has clearly made some progress on the subject.We nowunderstand the most important departures from the Modigliani and Miller assumptions that make capital structurerelevantto a firm's value. However, very little is known about the empirical relevance of the different theories. Empirical work has unearthed some stylized facts on capital structure choice, but this evidence is based on tirms in the United States alone, and it is not at all clear how these facts relate to different theoretical models. Without testing the robustness of these fmdings outside the environment in which they were uncovered, we cannot determine whether these empirical regularities are merely spurious correlations, let alone whether they support one theory or another.
l'his paper attempts to start tilling this gap in our knowledge. Our primary objective is to establish whether the choice of capital structure in other countries is based on factors similar to those influencing capital structure of U.S. firms. In doing so. we do not restrict ourself to attempting to reproduce the regularities found in the U.S. in other countries, but we try to go deeper in understanding the theoretical rationale behind them. The use of international data provides an unique opportunity for this analysis. To the extent other countries are similar to the U.S.. they provide an independent sample to test the received wisdom. To the extent they have different institutional structures, they increase our ability to discriminate among alternative theories.
The cost of using an international sample is that some time has to be spent in analyzing the differences between the countries, ranging from accounting practices to legal and institutional environments. Thus, we start by presenting the typical balance sheet in each of the G-7 countries (the US, Japan, Germany, France. Italy, the U.K., and Canada). This analysis highlights the effects of different accounting rules, and also points to the corrections that need to be made so that measures of leverage are comparable across countries. After correcting for differences in reporting and valuation, we find that the extent to which firms are levered is fairly similar across the G-7 countries, with only the U.K. and Germany being relatively less levered.
We then continue by analyzing the major institutional differences across countries and their likely impact on financing decisions. Although the G-7 countries are fairly homogeneous in their level or
economic development (in addition to data availability, this is another good reason to focus on them), their institutions — as exemplified by the tax and bankruptcy code, by the market for corporate control, and by the historical role played by banks and securities markets — arefairly different. Apart from establishing a framework within which to understand between-country differences, the review of institutions is important because they may affect the within-country cross-sectional correlation between leverage and factors such as firm profitability and firm size. This discussion can help us better identify the true economic forces underlying the factors.
The within-country cross-sectional analysis indicates that factors correlated with leverage in the United States are, in general, correlated in the same way in other countries also. But it is much harder to link these factors to specific theories of capital structure choice. For example, leverage increases in size in all countries except Germany. A possible explanation is that larger firms are better diversified, and have a lower probability of being distressed. Lower expected bankruptcy costs enables them to take on more leverage. But in Germany, the bankruptcy code ensures that firms entering bankruptcy are usually liquidated. Since liquidation values are generally lower than going concern values, bankruptcy is potentially more costly in Germany. So there should be a stronger positive correlation between size and leverage in Germany. Why then do we observe a significant negative correlation? This suggests that either our understanding of the economic underpinnings of the factors (e.g., size), or ourunderstanding of the influence of institutions (e.g.. bankruptcy laws), or both, is flawed. More research isclearly called for.
We are not the first to examjne capital structure across countries. Much of theprevious literature, though, focuses on aggregate differences in capital structure. Rutherford (1988) is one of the first to compare leverage across different countries using O.E.C.D. data, and she points out possible biases in accounting. Mayer (1990) analyzes financing choices in different countries with flow of funds data. The majority of these studies conclude that the Anglo-American economies (the U.S., the U.K. and Canada) are less levered than those of Continental Europe and Japan. A number of authors have explained these
2
We recognize the enormous differences in accounting and reporting standards across countries. What is
surpnsing is the extent to which countries look similar, after correcting for important differences. This is why we
aggregate differences as due tO differences in the extent and nature of financial intermediation (see Borio (1990)), differences in institutional Structures governing bankruptcy and debt renegotiation (see Frankel and Montgomery (1991)), and differences in the market for corporate control (see, for example, Bergiof (1990)). Others, such as Mayer (1990), suggest that certain institutions like the tax code cannot explain aggregate differences. We argue that while institutional differences may drive whatever aggregate differences in capital structure that do, indeed, exist, their influence may be more subtle than previously thought.
Because of the paucity of data, few authors have gone beyond aggregate data. Early attempts to explore the cross sectional determinants of capital structure in different countries were undertaken by Remmers, et al. (1974) and Stonehill, et a!. (1975). Both studies analyze a sample of large firms from four selected industries in five countries (U.S., Japan, France, Norway, and the Netherlands) in the period 1966-72. They find that industry and firm size are not important determinants of leverage, while profitability and firm growth generally are.' A more recent study is Kester (1986), who compares leverage in Japan and the U.S.. He finds that after controlling for a number of determinants, there are no major differences in the extent to which firms are levered in the two countries. We add to this literature, not simply by presenting correlations between factors and leverage, but by attempting to unearth the underlying economic forces.
The rest of the paper procedes as follows. Section I describes the aggregate leverage in each country after implementing the necessary accounting adjustments. Section II overviews the major institutional differences across the G-7 countries, in section III, we undertake a comparative study of the cross-sectional determinants of capital structure choices and attempt to find an explanation for the observed regulariues. Section IV concludes.
'Toy ci al. (1974) also conduct a survey on the objective of financial executives in different countries. Although their limited sample prevents from wide generalization, it is interesting to mention some of their findings. In all the counines managers think about capital structure targets in book value (and not in market value) terms. Furthermore,
their main goal appears to be guaranteeing the financial stability of their company and the availability of funds
needed rather than maximizing shareholders' value.
I. Data Description.
A. Dala.Previous studies that attempt to compare capita! structures in different countries have been hampered by the lack of consistent accounting and market information outside the United States. A recently compiled international tinancial database. Global Vantage, helps us. at least partially, address this problem. The database contains accounting data and monthly stock pric for approximately 8.000 companies from 31 countries since i982 GIçbal Vantage started to collect the data only in 1987. From• that year onward it included all the companies present in the Morgan Stanley Capital International Index, in the Financial Times Actuaries World Index or in the local market index.4 Pre-1987 data were backfilled arid therefore suffer from a survivorship bias. For this reason we concen'ateourilysis—tjn the 1987-1991 period, using pre-1987 data only as a robustness check.
We limit our attention to the largest economies where there are sufficient firms represented to make comparisons meaningful. In particular, we focus on non financial corporations of the G-7 countries
(the USA, Japan. Germany, France, Italy, the UK, and Canada). In 1991, Global Vantage covers more
than two thirds of the companies (representing more than 90% of the market capitalization) in countries with a small stock market (France, Germany and Italy). In the other major countries Global Vantage covers between one third and one half of the companies traded, representing more than 75% of the market capitalization. We eliminate banks and insurance companies from the sample because their Operations are very different and they are substantially affected by government regulation. The final sample covers between 30% and 70% of the companies listed in every country, and represents more than 50% of the market capitalization in each country.
There are a least two potential biases we should worry about. First, the sample selection criterion utilized by Global Vantage biases the sample towards the largest listed companies in each country. Given (he figures on coverage, this bias does not appear to be major. A potentially more severe selection bias
'For the U.S., Japan, Germany, France, Italy,the U.K.. and Canada (the seven countries we consider) the local market index is respectively S&P500, Nikkei 500. FAZ Share Index. CAC General Index. MIB Current Index. FT
anses from the tact that only listed companiesie reported. The fraction of listed firms differs widely across different countries, and so does the average size of companies listed. Edwards and Fischer (1993) estimate thai listed companies accounted for 30.5%of corporate turnover in the U.K. in 1986. while listed Aktiengesellschaft (the closest German equivalent to public limited liability firms) accounted for just 10.6% in Germany. Pagano and Roell (1990) find that the market capitalization of the average company traded in Frankfurt or Milan is approximately 60% larger than that of the average company traded in London.
It is important to understand why these differences arise, but this paper has more modest aims. ..
Thefigures above suggest that while the companies followed by Global Vantage are fairly representative of listed companies, these, in turn. may represent only a small (and varying) proportion of firms in a country. While listed companies, the tip of the proverbial iceberg, are perhaps of greatest interest to the financial communty, the interests of academicians are broader. Unfortunately, it is hard to establish beyond doubt whether the tip of the iceberg is representative of the larger mass hidden below. But to the extent that common institutions within a country influence both the tip and the mass below, the information gathered from an analysis of tips will have broader implicaiions.5 We will attempt to check for possible biases in the data throughout this paper. But ultimately, international data cannot be made perfectly homogeneous. and the reader will have to interpret our results withj.J_th.c.& tsiamind.
To explore the magnitude of these biases and the homogeneity of our sample across countries we sort all the companies into deciles according to the market value of their assets (in U.S. dollars) at the
nd of 1991 .
As Table I shows, the size distribution of companies within each country is fairly homogeneous across countries with the exception of Japan. Anglo American countries (the USA, the UK and Canada) have relatively more firms that are smaller than the overall median (respectively 59%, 57%3One might be concerned that, given the different institutional environments, only the best firms have access to the public equity market in Germany and haly. We do not think this is true. Very few firms went public in
Germany after World War II and therefore being public can be regarded as exogenous from our point of view. This is true in Italy also, though to a lesser extent. Furthermore. The Economist (7124/1993) reports that a McKinsey study finds unlisted firms in Italy perform twice 'as well' as listed ones.
'More precisely the quasi-market value of assets, defined as book value of assets minus shareholders' equity
and 56%). By contrast, in Germany, France and Italy the sample is slightly cihed towards larger companies (only respecuvely 35%, 34% and 46% are below the median). Only Japan has almost the entire sample (97%) of firms larger than the overall median. Given the wide differences in the industrial structure in the G-7 countries, the differing levels of the stock market, and the existing deviations from purchasing power panty that existed in 1991, the sample can be considered fairly homogeneous. However, in presenting the results we will attempt to correct for the possibility that difference in size influences the results.
B. Balance sheets
Considerable insight can be obtained simply by comparing the average balance sheets of the firms in our sample. In doing so, we note three major sources of differences in accounting practices. First, not all countries require firms to report consolidated balance sheets, although the majority of firms in each country do it (in 1991, the countries with the least proportion of finns reporting consolidated balance-sheets are Germany and Japan with 76%). Companies with unconsolidated balance balance-sheets may (incorrectly) appear to be less leveraged than otherwise identical companies that report consolidated statements. These firms have the leeway to leave the most indebted associated firms off their balance sheets. Alternatively, in an attempt to window-dress their balance sheet, they may place the debt they take on in less visible affiliated companies and then borrow it back via interfirm credit.7 For ease of comparison, this paper focusses on firms reporting consolidated balance sheets, and Table II reports average country balance sheets for all firms in the sample that reported consolidated balance sheets in
1991.
Second, the valuation of assets at historical cost or current value) may differ substantially across countries. For instance, it is generally believed (Nobes and Parker, 1991, p25) that German accounting p'aces greater emphasis on "conservatism' and less on "true and fair' considerations. Assets value of German companies may therefore be understated relative to asset values in many other countries.
This is not to say that consolidated firms themselves do not pose problems for a study such as ours. Multinationals may consolidate foreign subsidiaries. We will incorrectly attribute all the leverage to the parent firm. This will automatically diminish differences between countries. The increasing globalization of the operations of largefirmsshould reduce the differences between the capital structures of firms in different countries.
Conversely, the Finance Acts of 1978 and 1979 made revaluaxion compulsory for French companies (Nobes and Parker, p17).Thereis rio easy way to correct for this, and our results on book values must be interpreted with the appropriate caution.
The third difference relates to what is included and what is excludedfrom a balancesheet in different countries. Lease reporting varies substantially: financial leases appear on the balance sheet in the U.S., Canada and in the U.K. (especially in the latter half of the Eighties) but not regularly in Japan. and Continental Europe. As the extent of leasing increases, however, more of these countries are forcing companies to report them. Another difference is that in Germany, unlike the practice in the U.S.. both the funded and unfunded portion of pension liabilities are reported on the balance sheet (as are the assets held against pension liabilities). Furthermore, generally accepted German accounting practices allow firms to set aside greater provisions for future potential Liability in profitable years. This reserve is then used to smooth accounting income in lean years. Thus, in Germany, earnings may be less representative of true earnings than those in the U.S.( see Afford et a!. . 1993).An indication of the importance of these differences is that 29% of the liabilities of a German company are included in the category 'Liability Other' (in no other country does this item represent more than 8%). Approximately 50%of'Liability Other' is represented by pension liabilities, the remaining 50%consistsof special reserves for potential liabilities. We will correct for some of these differences when we discuss leverage.
Bearing the above caveats in mind, clear differences emerge between countries in Table II. Firms in Anglo American economies have proportionately more fixed assets and less current assets in their
Rutherford (1986) reports that leasing accounted for 17.1 % of gross capital formation in the U.S. corporate
sector in 1980. 8.7% in the U.K.. 4% in Japan. 3.2% in France. and 1% in Germany. Barclay and Smith (1993) find that lease obligations represent 9% of the total debt for a large sample or U.S. firm drawn from Compustat. This fiure probably represents an upper bound of the error produced by lease undereporting in other countries. where leasing is less widespread. An error of this magnitude is not likely to affect our results in a major way.
Anecdotal evidence on this issue reveals the magnitude of the problem. Nobes and Parker (1991, p. 27
report that AEG Telefunken succeeded in generating exactly zero earnings for three years in a row. More recently, in 1994. Daiinler Benz revealed its earnings restated according to U.S. standards while seeking a listing on the New York Stock Exchange. Daimler Benz had suffered substantial reverses in vanous markets, so one would expect its
smoothed earnings to be higher than true (U.S. restated) earnings. But the extent of the difference. DM3 billion
approxi.mately $2 billion), wa.s surprisingly large. All this suggests that the objective of smoothing income may sometimes conflict with the objecuve of presenting a con.servauve picture.
balance sheet: 40% versus approximately 30% for Germany, France, Italy and Japan.'° However, the
composition of current assets differs greatly in this latter group.Japanesecompanies have a larger amount
of cash and short term investments (18% of assets versus at most 11% for other countries), and this accounts for most of the difference in current assets with respect to the United States. In Contmental Europe. however, the larger size of current assets is because the level of inventories and accounts receivable is higher. We now turn to the liability side of the balance sheet.
C. Leverage.
Given the observed differences in the composition of liabilities, before undertaking any investigation of leverage it is appropriate to define what we mean by this term. Clearly, the extent of
leverage — and the most relevant measure --depends on the objective of analysis. For irist.ance. the
agency problems associated with debt (Jensen and Meckling (1976), Myers (1977)) largely relate to how the firm has been financed in the past. and thus on the relative claims on firm value held by equity and debt. Here, the relevant measure is probably the stock of debt relative to firm value. Others (see Aghiori and Bolton (1992)) have focussed on leverage as a means of transferring control in bad times from the hands of shareholders (or their fiduciaries) to the hands of bondholders (or their fiduciaries). Here, the important question is whether the firm can meet its fixed payments, and consequently, a flow measure like the interest coverage ratio is more relevant. Rather than exploring all possible theories and their associated measures of leverage, we use the ones suggested by the discussion above as illustrative.
The broadest definition of stock leverage is the ratio of total liabilities over to total assets. This
-
s
a measure of what is left for shareholders in case of liquidation. However, it does not provide a goodI,
indication of whether the firm is at risk of default any time soon, neither does it provide art accurate picture of past financing choices, because it is greatly influenced by non financial factors. To the extent that much of trade credit is used for transactions purposes, and not as financing, including accounts payable may distort the level of leverage)1 Similarly, pension liabilities arising from labor market
'°Thelarger proportion of fixed assets in Canada may simply be because a disproportionately large fraction
28%) of the Canadian companies in the sample are in Oil and Mining.
However in countries, or speciric classes of firms who use trade credit as a means of financing, accounts
contracts will influence this ratio.
A more appropriate definition of financial leverage is provided by the ratio of debt (both short term and long term) to total assets. This measure, however, fails to incorporate the fact that there are some assets that are offset by specific non debt liabilities. For example, an increase in the gross amount of trade credit is reflected in a reduction of this measure of leverage. Given that the level of accounts payable and accounts receivable may jointly be influenced by industry considerations, it seems appropriate to use a measure of leverage unaffected by the gross level of trade credit.
We thus define leverage as the ratio of total debt to net assets, where net assets are total assets less accounts payable and other liabilities. Although this measure abstracts from trade credit, it does not eliminate the influence of other non financial markets on the measure of leverage. For example, assets held against pension liabilities may decrease this measure of leverage. Therefore, the effects of past financing decisions is probably best represented by the ratio of otal debt to capital (defined as total debt plus equity).
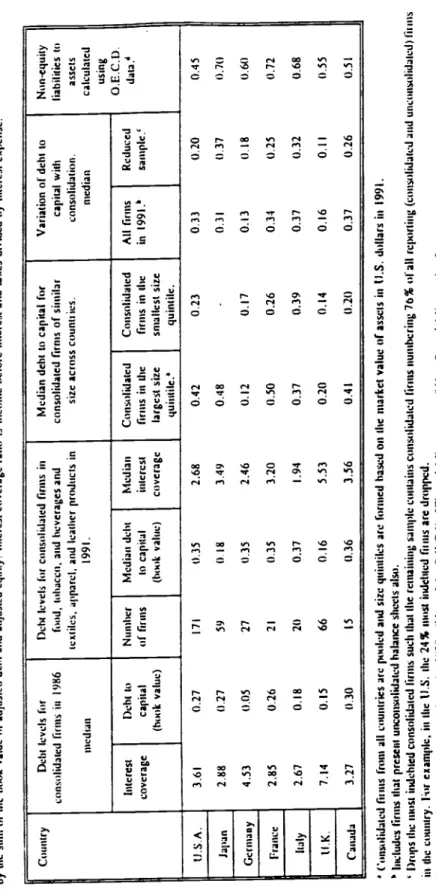
A good measure of the risk that equity holders are not able to make fixed payments and have to ive up control is the coverage ratio. i.e.. the ratio of EBIT to interest expense. Implicit in this ratio is that investments equal in rnagn.iti.ide to depreciation are needed to keep the firm a going concern. If no investments are needed, a better measure is to define coverage as the ratio of EBITDA to interest expense. A common problem for both measures is that they assume that short term liabilities like accounts payable and short term debt will be rolled over, which need not be true in times of distress. Furthermore. as Jensen 1989) argues, an inability to make fixed payments at low levels of debt may have very different implications for the control of the firm than an inability to make those payments at high levels of debt. The former is more likely to lead to liquidation while the latter may lead to reorganization .especiallv if the debt is closely held). Another problem is that these measures are very sensitive to income fluctuations. With these caveats in mind, we report in Table III a the above mentioned definitions of leverage for different countries. The stock measures are computed both at book value and quasi-market
values .—wherethe book value of equity is replaced by the market value of equity. At this stage. we do
riot attempt to adopt a more homogeneous standard for the balance sheets.
According to the first definition (non-equity liabilities to totai assets) Anglo-American economies have considerably lower median leverage in 1991 (about 0.56)thanthe economies of Connnenral Europe and Japan (0.70). This is hardly surprising given the biases mentioned above. This figure, in a sense. offers an upper limit of the amount of leverage in different countries. If market values are used. Japan is not considerably more levered than the Anglo-American countries, while the countries of Continental Europe still seem to have higher leverage.
Moving on to debt to total assets, our findings change considerably. Now Germany and the U.K. appear to have low levels of leverage, both as a fraction of book value and market value of assets. Of course, part of the Low leverage for Germany may be because of the way pension liabilities are treated. We will correct for this shortly. According to the debt to net assets ratio, Japan. Italy. France. and Canada appear substantially more levered than the other countries. Again, this result does not survive for Japan if we look at leverage in market value terms, but it is still true for the other three countries.
If leverage is defined as debt over capital, the North-American countries and Germany have a similar leverage around 38%, UK appears substantially less Leveraged (28%), while France. Italy and Japan substantially more leverage (respectively 48%, 47%, and 52%). However, the figures for Japan may be mainly due to the potential undervaluation of assets. In fact, leverage appears a more normal 29% if it is measured at the 1991 market value (recall that at the end of fiscal year 1991. the Japanese sock market had fallen approximately 50% from its peak, so the 'bubble' is not necessarily driving these resuIts) Market value measures, however, confirm the higher level of stock leverage in France and Italy. We also compute median interest coverage ratios. In the second last column of Table lila we report the ratio of income before interest arid taxes to interest expense. In the last column, depreciation is added to the numerator of the coverage definition. Despite the potential downward bias in German data, the interest coverage figures corroborate our earlier findings that Germany and the U.K. have lower leverage than the other countries in our sample.
Although country rankings are somewhat a function of the measure used, one major fact emerges: neither German nor Japanese companies are very highly levered by US standards. Germany, in particular. comes across as a surprisingly low levered country. This result is contrasts sharply with the conclusions
of previous researchers (for example, Berglof(1990), Borio (1990)). According to Berglof, Continental Europe and Japan with their so-called banking-based systems, are more highly levered than the Anglo-American countries with their market-based financial systems.
Before drawing strong conclusions from this exercise, we have to check if these findings are robust to adjustments for differences inreportingstandards. We list the minimal adjustments that may
be desirable. First, consider cash balances. Although we do not know how much cash and short term investments are really needed to run a business, it is probably not a bad approximation to treat it as excess liquidity, offset it by an equivalent amount of debt, and remove both from the balance sheet. There are other items which assume special importance in some countries because of accounting differences. For instance, unlike U.S. firms. German companies do not net out pension assets and pension Iiabilirv in their balance sheets. While we do not know the level of pension assets, a first approximation is to assume that pensions are fully funded, and we subtract pension liabilities from assets in Germany.
There are three additional adjustments that need to be made. First, deferred taxes should really be considered a component of shareholders' equity. Given that the importance of this item varies across countries, it seems appropriate to analyze the impact of adding it to the book value of equitY. Second. the value of US assets may be exaggerated with respect to those of the other countries by the wave of acquisitions of the l980s. This is because the premium paid in an acquisition is recorded as goodwill and depreciated over thirty years. Evidence of this possible distortion can be found in the dramatic increase rn intangibles in the U.S. over the 1980s (2.2% of assets in 1982 to 7.6% in 1991). and the much smaller number in other countries texcept for France). To eliminate this potential bias we subtract the value of intangibles from the book value of equity in all the countries (and reduce assets accordingly). Finally. we argued that a big fraction of German liabilities is composed of dubious provisions for future liabilities. which are really equity. Therefore. for the sake of comparison, we reclassify these liabilities as shareholders' equity in all countries.
The net effect of all these adjustments is in Table Ifib. The amount of leverage in every country except Canada drops substantially. In particular the ratio of adjusted debt to capital in Japan drops from 53% to 37% and in Germany from 38% to 18%. But, if anything, the results seem to strengthen our
claim that corporate leverage is fairly similar across the 0-7countnes with the exception of the United ,)fingdornandGermariy, where firms are substantially less levered. In everything that follows, we use the
adjusted measures of leverage.
There are a number of additional checks for robustness that can be performed. To check that our results on leverage are not special to the year chosen, we look at the interest coverage ratio and the debt to capitalization ratio in 1986, a year that for many countries represented the peak of the economic expansion2 As Table Ill c indicates. interest coverage is again high for Germany and the U.K., while is approximately equal for the other countries. The debt to book capitalization measure corroborates this.
It is also possible that across country differences in leverage may be simply due to differences in the industry composition of the 0-7 stock markets. For instance, 28% of Canadian firms are Mining and Oil companies (as compared to 6% in the overall sample). We therefore recompute the measures for a homogenous group of firms, those in food, tobacco, beverages, textiles, apparel, and leather products. Again, the United Kingdom is relatively unlevered while Italy appears most highly levered. The remaining countries have more or less equal leverage.
Differences in leverage can be attributed to the different size composition of the G-7 country sample. For this reason, we compare leverage of companies belonging in the smallest 20% and in the largest 20% of he distribution of firms sorted by the dollar market value of assets in 1991. Independent of the size of the firm, firms in the United Kingdom and Germany are less levered while all the other countries are approximately at the same level.
-
-Somecountries have a greater number of state owned firms than others. Firms in those countries may appear to have higher leverage because we do not account explicitly for state guarantees to debtholders. We identified the state owned companies in our sample for France and Italy, the countries with the largest state sector. There are 21 such companies in all. Median adjusted debt to capital for these
2 It
would appear that the best measure of leverage for Germany is debt to capitalization, where capitalization is defined as the sum of debt, equity, and untaxed reserves. Interest coverage may understate the amount of leverage because income from the pension assets held on the balance sheet will also count as income, and it may overstate
leverage because of the propensity to hide income (though the latter effect may be small when we average over firms and time periods).
firms is 0.83 in France, which is much higher than the median for firms in the private sector, 0.33. But for Italy, the medians are closer together, at 0.42 and 0.38 respectively. Since state owned firms are such a small proportion of our sample. dropping them does not alter our conclusions. In the rest of the analysis, they are dropped from the sample.
Another source of concern is that by restricting our attention to firms with consolidated balance sheets,we might have a significantly biased measure of leverage for some countries. This concern is particularly valid for Japan and Germany, where 24% of the sample is eliminated by the consolidation requirement (for all the other countries the loss is less than 10%). Including firms that do not present consolidated balance sheets in the sample does no change the overall picture, it actually further reduces leverage in Japan and Germany. However, this finding is hardly surprising if we think that firms may choose not to consolidate in order to hide debt (though this effect will partially be offset by the fact that the incentive to hide debt increases as a firm becomes more highiy levered).
During the 1980s. firms were under an increasing pressure to present consolidated balance sheets. both from local authorities and from financial markets. In 1989 alone. 109 Japanese firms in our sample moved to consolidated accounts. An estimate of the impact of consolidation can be obtained by looking at how the level of leverage changes when a firm starts to report consolidated balance sheets. We estunate this difference country by countr In all the countries except the U.K., we find that in the 'ear when a firm moves to consolidate accounts, its debt to capital ratio increases relative to the previous 'ear by about five percentage points. This difference is always statistically significant. In the U.K., the difference is only two percentage points and is not statistically significant. This suggests that the absence of consolidated accounts for all the companies may lead us to underestimate the amount of leverage in Japan and Germany. Assuming that, on average, the finns that do not consolidate have 10 percentage points more unreported leverage than they actually report (in other words, we assume twice the average increase when firms change reporting status>, the adjusted debt to capital ratio in Japan would go up to
310 Canada and the U.S. all firms report on a consolidated basis. Theretbre. our estimates are for the remaining Live countries.
0.395. andthat in Germany to 0.205. This does not overturn our main results.14
A fmal source of concern is that our findings are different from most of the previous literature because of differences in the samples used and not because of differences in the way leverage is computed. In the last column of Table IIlc. we present the liability to asset ratio calculated using O.E.C.D. data. Given that OECD statistics include both listed and unlisted finns, there is remarkably little difference between this measure and the unadjusted equivalent measure in our sample. Interestingly, the difference is largest for the United States where we have the most number of firms. This evidence suggests that the sample covered by Global Vantage is not unrepresentative of the whole universe of companies present in each country.
What all this suggests is that leverage comparisons between countries are sensitive to what we include as debt and assets, and whether we value the assets at book or market value. It appears that previous studies based on O.E.C.D. data have over-emphasized the higher level of non-equity liabilities
in Continental Europe and Japan. even though this may largely stem from differences in accounting and from the presence of long term non-debt liabilities (like pensions). Furthermore, these studies have not accounted for possible misvaluation of assets —wherea market leverage or coverage measure may be better than a book leverage measure. Using different measures of leverage and correcting for major differences in accounting, we can conclude that: (I) the U.K. and Germany have the lowest leverage among the G-7 countries: ii) all other countries have approximately the same amount of leverage, with some changes in ranking based on the specific measure.
D. The Flow of Financing at the Aggregate Level.
Up to this point we have restricted our analysis mainly to stock-based measures of the existing
'
Weassume twice the average level because the decision to start reporting on a consolidated basis may not be independent of the amount of hidden leverage that a company has. if this is the case, our estimate of 5 percent will represent only a lower bound of the impact of consolidation. Another way to control for this possibility is thefollowing test: the worst case scenario for the results is that the firms that choose not to report on a consolidated
basis arc the most highly levered. Then to put Germany and Japan on an equal footing with the other countries we
truncate the samples for other countries at the 76 percentile of leverage. Even with this, Germany appears to be
less levered than all other countries except the United Kingdom (see Table HI c. column 9), and the other countries are higher.
'5OECD data are presented in an aggregate way, therefore it is not possible to compute leverage using some of the definitions we use.
capital structure. Now we analyze the choice of financing with flow ot funds data. Such an analysis is important for at least two reasons. First, the actual capital structure of a firm is just the outcome of a series of prior financing choices. Therefore, by comparing results based on flow of funds data with those obtained from the level of stock we can check the robustness of our findings. Second. data on capital structure do not distinguish between equity built through retained earnings and equity obtained through stock offerings. As Myers (1984) points out. the costs associated with these two forms of
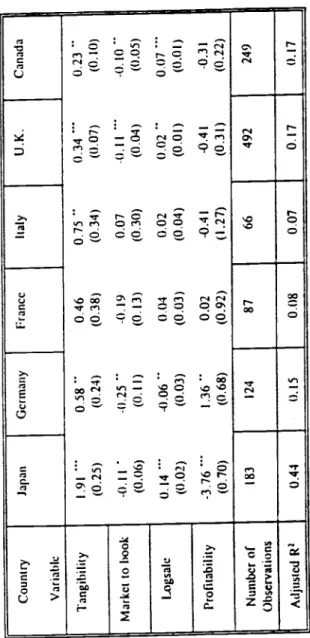
financing are very different. Also, the relative preference between the two can be very different in different institutional environments. In Figure 1, we plot the fraction of external financing (financing from sources other than retained earnings) for the four countries for which we have flow of funds data. For the U.S., U.K.. and Canada. external financing is smaller than internal financing, with firms in the United States raising the least from external sources. But firms in Japan consistently raise more money externally than internally. Unfortunately, much of the period we have data for coincides with the
dramatic rise in the Japanese stock market, so we do not know if this observation is specific to the period. In all the countries, external financing shoots up in 199O91. not so much because financing requirements increase but because retained earnings drop dramatically in the recessionary period.
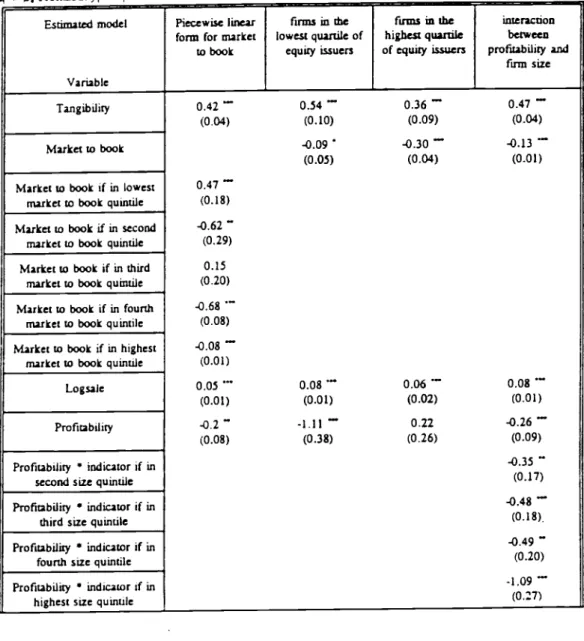
In figure 2. we plot net debt issuances as a fraction of total financing. This shows that the reason U.S. and Canadian firms are so highly levered despite using so little external finance is because external finance has consisted largely of debt (throughout the 1980s for U.S. firms, and the latter half of the I 9SOs for Canadian firms). The L1S figures are extreme, perhaps because of the intense activity in the market for corporate control over this period. In Japan, the greater amount of external finance has been offset by a lower amount of debt iii external finance, except in the early 1990s when the plunge in the stock market led to a complete ban on equity issues.'6
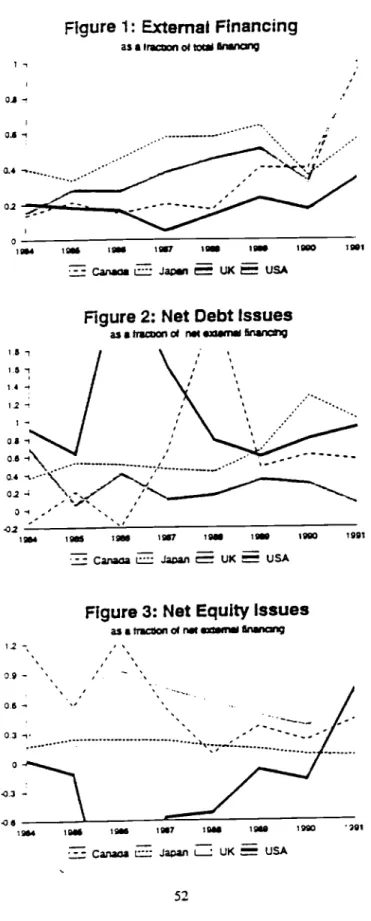
Finally, in figure 3, we plot the net equity issuances in each country) Firms in both the U.K.
One has to be cautious in auributing all the net equity issues to new issuances. Some of the equity 'issuance' may actually be conversion of debt into equity. Similarly, some of the net debt issuance may actually be the issuance of quasi equity instruments like convertibles.
'Note that in Germany and Japan. stock repurchases are forbidden by the law. In other countnes like the U.K. and Italy. they may take place but only uswg retained earnings. Therefore, firms in some of these countries do no have the flexibility US firms have in releveragng a company.
and Canada (in the early 1980s) issue significant amounts of equity. Theextremely low leverage for the U.K. despite substantial levels of external financing is a result of a conscious emphasis on equity issuances rather than debt as a source of external financing. At! this suggests that the_levels of leverage that we see in different countries do not arise randomly, but are a consequence of conscious financing choices made by firms.
II. Institutional differences and leverage.
In the previous section we showed that differences in leverage across the G-7 countries are not
as large as previously thought and that only the United Kin_gom and Germany appear to be
ubstantiaIly less leveraged. These findings beg the question of why countries with such diverse institutions (like Japan and the United States) have a similar amount of leverage and why countries with similar capital markets and financial institutions (like the United Kingdom and the United States) have such different levels of debt. Much of the previous literature has focussed on a classification of countries based on the size or power of the banking sector, hence the term 'bank oriented' (Japan, Germany, France, and Italy) and 'marker oriented' countries (the U.S.. the U.K.. and Canada). In this section. we argue that this is just one, and perhaps not the most important, institutional difference between the G-7 countries. The tax code. bankruptcy laws, development of bond markets, and patterns of ownership also may matter though these may not be independent of importance of the banking sector. Far from settling the issue of whether institutions influence aggregate capital structure, we raise questions that need to be addressed in future research.A. The effect of taxes on aggregate leverage.
We first examine the effect of the tax code on aggregate leverage. The existing empirical literature on international capital structure differences (see, for example. Mayer (1990)) claims that taxes have no explanatory power. However, the literature fails to consider personal taxes, and for a very good reasom a precise computation of the effective tax rates, taking into account the income and wealth levels of the population. and the marginal corporate tax rate for firms, would require an entire study like the one undertaken by King and Fullerton (1984) for the 1970s. In this section, we finesse the issue of calculating the effective tax rate by assuming, in Table IV. that the marginal investor pays the highest personal tax rate and the marginal corporation issuing debt pays taxes at the statutory rate. Our modest
goal here is to raise the possibility that the previous wisdom that taxes do not explain cross country
differences in leverage may be reversed if personal taxes are considered.
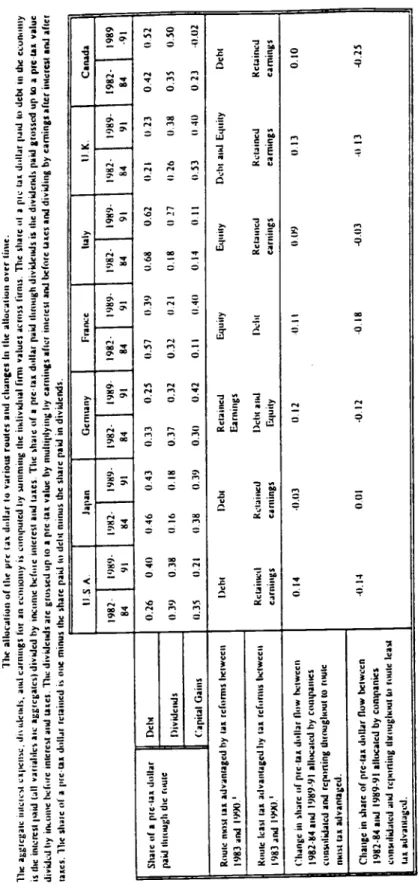
In some countries corporate income may be taxed differently depending on whether it is retained or distributed. Furthermore, different sources of personal income are taxed at different rates. Therefore. Table IV also reports the corporate tax on distributed profits, the highest tax rates on interest income. dividend income and capital gains, as well as the tax rebate on dividend income. From these, we calculate the after tax value of a dollar of pre-tax income as it flows to an investor through different routes. We compute this for each country in 1983 and 1990, first under the assumption that the effective marginal capital gain tax rate is the highest statutory one.
The first three rows in Table V show how a dollar of pre-tax income is divided into the three streams in each country.'9 Japan and Italy have among the largest tax advantage of debt over retained earnings and dividends in 1990. These countries also have relatively high fractions of pre-tax earnings flowing to debt (43% and 62% respectively in the period 1989-91), and the lowest payments to
dividends (18% and 27% respectively in 1989-91). The United States is an anomaly here, because it
has a high fraction flowing to dividends despite dividends being relatively tax disadvantaged. Conversely, debt is actually tax disadvantaged relative to retained earnings and equity in Germany, and was so in the U.K. until 1988. These countries have the lowest fractions flowing to debt (25% and 23% respectively in the period 1989-91).
A sharper test of the effects of taxes can be obtained by looking at how changes in the relative tax advantage of debt, dividends, and retained earnings over the 1980s affect their share of the pre-tax dollar. In Table V. we list the effect of changes in the tax code between 1982 and 1990 on the amount of the pre-tax dollar that finally reaches the individual through the different routes. For instance, in the L'S.. the 1986 tax reform was such that, for every dollar of pre-rax income paid out through the debt
1Local and city taxes arc included in the computations. Whenever these differ inside a country we chose the tax rate of the region where the major stock exchange is located. Data were collected from Coopers & Lybrand (1984) and various issues of Price Waterhouse publication 'Doing Business in
Total debt payments are obtained by summing interest expenses across companies. total dividends are similarly obtained and then grossed up to a pre-tax rate by multiplying by the ratio o1 total pre-tax income to total after tax
income (This overstates true dividends if the tax on distributed profits is different from the tax on retained earnings. Unfortunately, we have no way of systematically correcting for this). Total pre-tax retained earnings are obtained by subtracting (pre-tax) dividends and debt payments front pre-tax earnings. All these are normalized by total pre-tax earnings. We calculate these numbers over three year periods so as to minimize the noise from poor economic conditions in any single year. The findings are nor qualitatively different if we restrict ourselves to the years 1982 and 1990.
route. an investor would receive $0.20 more than he received before the reforms. The corresponding increase for the dividend and the capital gain routes are $0.15 and $0.03.
If taxes matter, we should observe a shift in the allocation of the pretax dollar towards the route chat has increased its after tax value the most. At the same time the route that is most penalized (or least advantaged) by tax reform should experience a reduction in its flow. This is in fact what we see. and the results are reported in Table V. For instance, in the U.S. the debt route, which is the most tax advantaged by the 1986 reform, increases its share of the pre-tax dollar from $0.26 to S0.40 between 1982-84 and 1989-9 1. By contrast, retained earnings are the least tax advantaged by the reforms in the U.S. and their share decreases from $0.35 to $0.21. The share of the pre-ta.x dollar going to the route that is most tax advantaged by tax reform between 1982 and 1990 increases in 5 of the 7 countries — with a mean
increase in share of 6 cents (t 1.75). Conversely, the route least advantaged by tax reforms between 1982 and 1991 saw a mean decrease in share of 12 cents (t=-3.6); with decreases in 6 of 7 countries. A T test for differences in means suggests that there is a significant effect of taxes at the 5% level.20
All we have shown is the possibility that personal taxes may matter. If we change assumptions, for instance, by making the effective capital gains rate zero, the most tax advantaged and disadvantaged route change only for one country, Canada. But given our small sample size, this is enough to make the
ests inconclusive. So this sub section shows that in order to reach any conclusion on the effect of taxes on aggregate leverage, it is important that the researcher include both personal and corporate taxes. Moreover, in order to reach the right conclusion, it is imperative that researchers obtain the right
effective race.
B. Bankruptcy Law.
As Harris and Raviv (1992) suggest, bankruptcy law should be regarded as an integral aspect of a debt contract. The G-7 countries vary considerably in their bankruptcy procedures and especially in the amount of power they leave to creditors in bankruptcy (see for example. White. 1993 or Kaiser and Kaiser. 1993). Therefore, the use of debt contracts in the G-7 countries should be affected by these differences in bankruptcy proceedings.
Bankruptcy law has at least two important effects. On an ex-ante basis, strict enforcement of creditor rights enhances contractibility. Furthermore, it commits creditors to penalizing management and equity holders if the firm gets into trouble, and this gives the latter the incentive to stay on the straight
:o Because wo countries, Germany and the U.K.. have two routes which change by the same amount, we only have 12 independent observations for this test.
and narrow. On an ex-post basis, this is not necessarily true. Efficiency considerations will suggest that it is sometimes optimal for firms to renege on past promises to creditors. The optima! trade-off between ex-ante and ex-post efficiency is. therefore, really an empirical question.
The countries with the strongest enforcement of creditors' rights are probably Germany.and the U.K.. In the U.K., creditors whose claims have not been paid appoint receivers, who can then sell the firm's assets to repay debt owed to the appointing creditor. Once a receiver is appointed, the firm cannot
-
file for bankruptcy to effect a stay on her actions. This makes reorganization difficult, and infrequent. In Germany creditors have significant rights during reorganization so that few German firms are reorganized in bankmptcy.n In contrast to firms in Germany and the U.K.. finns in the U.S., France. and, to a less extent. in Japan. Italy and Canada are more easily reorganized, at the expense of the rights of the creditors.Therefore, countries where the cx ante contract is most strictly enforced are also ones where firms / have the least debt. Is this coincidence or is it because firms are liquidated much too often, and consequently do not lever up? Or is it because managers fear losing their specific human capital1/
investment, and inefficiently maintain very low leverage? The answers await future research.
C. Bank versus market based countries. I
As discussed earlier, previous studies have emphasized differences in the importance of banks relative to public financial markets as explanations for differences in capita! structure. The two polar cases
are probably represented by Germany and the United States. In Germany, banks are allowed to underwrite corporate securities and to own equity in industrial companies. In the United States, significant limits are placed on both activities (see Kroszner and Rajan (1994). James (1994)). Although recent studies Ifor example. Franks and Mayer. 1994) have highlighted the relatively modest direct stockholdings of banks in Germany, it is generally believed that banks are able to influence a large sector of the
:: Reorganization plans must pay unsecured creditors at least 35% of the amount of their claims or 40% if
Davmeot is to te dela-ed by more than a year. Creditors vote on he plan. and it must be accepted by at least a rnatorttv of creditors, and at least 50% of the firm's debt by value (see White. 1993).
:: In the (iS., management has a signincant amount of time. and consequently bargaining power. to propose
a reorganization plan. Furthermore, cramdown procedures can be used to force reorganization through. In France. the court-appointed bankruptcy official represents the interests of the state rather than that of creditors. Liquidation
cannot occur until a mandatory observation period of 18 months has passed. Furthermore, the court, and not creditors, approves the reorganization plan. In Japan. the receiver is usually a bank or a trust who serves as a
corporate angel' who will put the firm back on its feet. The receiver has one year in which to propose a plan.
Creditors rarely, if ever. propose plans. It should also be noted that much of the reorganization in Japan gets done out of bankruptcy (Frankel and Montgomery, 1991).
economy in that country, through the use of proxies and the vast network of cross-ownership (see, for instance, Cable (1985)). While space constraints prevent us from detailing banking powers in each country, banks in Japan, France. and Italy are believed to play a somewhax greater role in financing large lu-ins than banks in United States, U.K.. or Canada (see Dermirie (1990)),n
While we do not fInd that aggregate differences in leverage can be explained solely by differences in perceived bank influence, it is a fact that countries with strong banking sectors have relatively underdeveloped public markets, where by this term we imply not only the stock market but also the corporate bond market. In Table VI. we present the total capitalization of each country's equity and bond market in 1991 normalized by the Gross Domestic Product in the same year (all figures are in U.S. dollars). Both Germany and Italy have minuscule bond markets while France has a relatively small stock market. The exception is Japan where much of the growth in equity markets and bond markets came in the 1980s when the strong hold of banks over corporate financing was relaxed (see Hoshi. Kashvap, and Scharfstein (1990)).
In light of our evidence, it would appear that the difference between bank oriented countries and market ortented countries is really reflected in the choice between public (stocks and bonds) and private financing (bank loans; rather than in the amount of leverage. This is not surprising even from a theoretical point of view. While it might appear that the closer monitoring and control of firm management provided by banks should enable firms to take on more debt in bank oriented countries. recent work (Rajan (1992), and Sharpe (1990)) has emphasized the costs of excessive bank debt. So firms in bank oriented' countries may not want to borrow beyond a point from banks, even though financing is available. An alternative explanation is that banks in these countries have sufficient stakes in firms that even equity becomes a viable instrument of control. So firms in bank oriented countries do obtain more financing but some of this takes the form of privately placed equity and does not reflect in the leverage ratio. Which of the explanations. if any. is correct, is a question for future research.
D. Ownership and Control.
Another major institutional difference across the G-7 countries is the level of ownership
Nore that the disunccion is made more on an cx post basis (i.e., looking ax the outcome) rather than on an cx ante basis (i.e.. looking at the differences in rei.ilacion;. In fact, in France and Italy until recenny banks could not
own equity in indu.rjaj firms. Bycontrast,in the U.K. there is no restriction on stockholdings by banks, but these
generally abstain from holding equity.
concentration and the working of the market for corporate control (Berglof, 1990 and Franks and Mayer. 1994). The U.S., the U.K. and to a much lesser extent, Canada are characterized by a diffuse ownership and by an active market for acquisitions. By contrast, in Continental Europe and Japan. ownership is highly concentrated, thanks to the use of inter-company cross-holdings, pyramiding of ownership and dual class stock. As a consequence. hostile acquisitions are almost unheard of. Franks and Mayer (1994' report only three attempts of hostile acquisitions in Germany in the entire post World War II period. The effect of ownership concentration on capital structure is far from obvious. On the one hand, the presence of large shareholders in the board of directors should reduce the extent of asymmetric information and facilitate equity issues. On the other hand, if some of these large shareholders are banks they might have a vested interest in reducing the amount of outside sourcing of their clients, forcing them into borrowing from them.
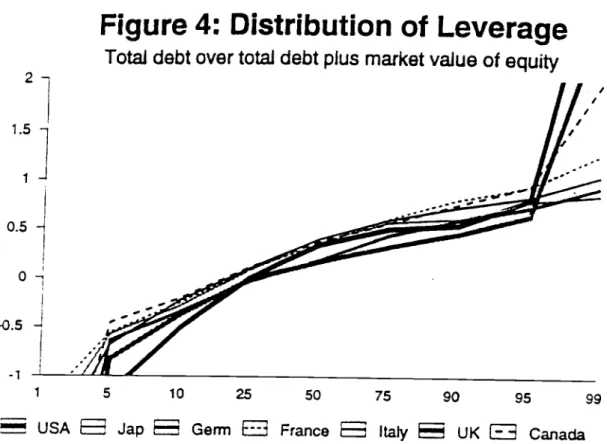
Even abstracting from asymmetric information problems; it is not a priori clear what the difference between the capital structure preferred by a large shareholder and the capital structure preferred by managers should be. Novaes and Zingales (1994) show that self interested managers may sometimes prefer to underleverage and other times to overleverage a company with respect to what is optimal for shareholders. In particular, the higher their quality as managers or the lower the pressure from the corporate control market, the more likely it is that managers will underlever their company. By contrast, the lower their quality or the higher the external pressure, the higher is the amount of debt managers will use to defend themselves. An implication of this model is that countries with diffused ownership and active markets for corporate control should have a more dispersed distribution of leverage and this dispersion especiaIlv the higher tail) should increase when the external pressure increases. Figure 4 reports the distribution of leverage in the G-7 countries. The distribution of leverage in Anglo-American countries appear to have much fatter tails. Furthermore, the right tail of the distribution did increase over the 1980s. Therefore. institutional differences may well have an impact on the distribution rather than on the mean of leverage.
Ill. Cross Sectional Evidence.
Thus far, we have examined aggregate differences in capital structure across countries. The major difference appears to be that firms in the United Kingdom and Germany are less levered than firms in the other G-7 countries. Differences in institutions do seem o have some explanatory power for the differences in aggregate capital structure. but section II also suggests a broader interpretation of institutions than the previous literature has focussed on. While a division of countries according to
whether they are bank oriented' or 'market oriented' does not seem enough to explain differences in leverage, the bankrupwy code, the tax code, and the market for corporate control seem to be important components of future explanations of the differences.
We have concentrated thus far on identifying and explaining beween-country differences in capital structure. We now shift our focus to exIaining cross-sectional differences within countries. To the extent that institutions are relatively similar within a country, the change in focus enables us to identify more primitive factors influencing leverage. The question we address is whether the same underlying factors determine capital structure in all the G-7 countries.
In what follows, we update the major findings of previous studies on U.S. firms, using Global Vantage data on the U.S.. We then go on to examine if these stylized relationships hold in other countries. Finally, we attempt to establish why each factor has the relationship with leverage that we document. In other words, the use of international data has two purposes: the first is simply to document the relationships, the second -andmore important one -isto try and explain the cross-country variation in these factors. If, for instance, a factor does not 'work' in the predicted way in another country (conditional on no measurement or econometric problems), it must be either because the theoretical rationale for the factor working in the U.S. is spurious, or because institutional differences alter how the factor works.
A. The Determinants of Leverage
According to Harris and Raviv (1991). the consensus is that 'leverage increases with fixed assets. noridebt tax shields, growth opportunities. and firm size and decreases with volatility, advertising expenditure. bankrupcv probability, profitability and uniqueness of the product'
Because of data limitations we focus on four of the above mentioned factors: tangibility of assets (the ratio of fixed to total assets), the market to book ratio, firm size, and profitabi1ity. Clearly, each of these factors will have different effects on the relative attractiveness to firms of debt vis a vis equity (the demand side) and the price lenders vill charge for debt vis a vis equity (the supply side). It ishard to identify these equations without being more confidant about the relevance of the theories we are trying to test. This is why we restrict our analysis to the simple correlations of these factors with leverage.
Unforrunaiely, Global Vantage is not as comprehensive as one might wish. For example, very few firms abroad report R&D and advertising expenditures separately. Furthermore, stock prices are available only at a
monthly interval, making beta estimates very imprecise. These data limitations have an impact on the choice of our regressors.
If a large fraction
of a firms
assets are tangible. then assets should sex-ye as collateral. diminishing therisk of the lender suffering the agencycosts ofdebt (like risk shifting). Theyshould also retain more value in liquidation. Therefore. the greater the proportion of tangible assets on thebalance sheet (fixed assets divided by total assets), the more willing should lenders be to supply loans,
and leverage should be higher.
Highly levered companies are more likely to pass up profitable investment opportunities (Myers (1977)). Therefore, firms expecting high future growth should use a greater amount of equity finance. As suggested by Myers, we use the ratio of the market value of assets to the book value of assets as a proxy for growth opportunities.
The effect of size on equilibrium leverage is more ambiguous. Larger firms tend to be more diversified and fail less often, so size (computed as the logarithm of net sales) may be an inverse proxy
for the probability of bankruptcy. If so, size should have a positive impact on the supply of debt.
However, size may also be a proxy for the information outside investors have, which should increase their preference for equity relative to debt. Also, the largest firms are more immune to takeover pressure so they ax-c less likely to be forced to take on debt as a commitment to pay out cash or refrain from negative NPV projects.
Finally, there are conflicting predictions from the theory on the effects of profitability on
leverage. Myers and Majluf(1984) predict a negative relationship, because firms will prefer to finance with internal funds rather than debt. Jensen (1986) predicts a positive one if the market for corporate control is effective and forces firms to commit to paying out cash by levering up. If it is ineffective. however, managers of profitable firms prefer to avoid the disciplinary role of debt. which would lead o a negative correlation between profitability and debt. On the supply side, suppliers should be more .illing to lend to tirrns with current cashtlows. We measure profitability as cash flow from operations divided be book value of assets.
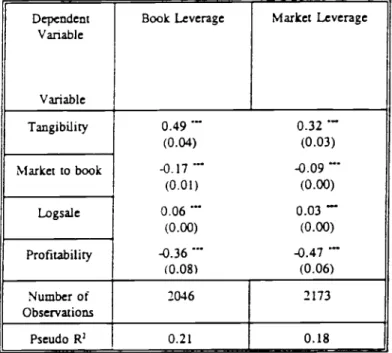
13. Cross-sectional determinants of leverage in the United States. The basic regression we estimate is
Leverage [Firm i I
a
17, Tangible assetsj7 Market to Book Ratio
173 Log Sales + Il4 Return on Assets ,
We use two measures of leverage based on the adjusted debt to capitalization ratio in 1991 When equity is measured at book value, we term the measure book leverage, when it is at market value.
we call it marketleverage. For consistency, only companies reporting a consolidated balance sheetare
included in what follows.6 All the regressors are four year averages (1987-90) of the corresponding
variables.l Table Vila reportstheestimated coefficients for theU.S. obtained using a censoredTobit
model21
In column (i). we report theestimation when the dependent variable is book leverage, It is not
surprising that all thecoefficients have the signfound inprevious work(see Harris and Raviv (1991)),
and are significant at the 1% level. A one standard deviation increase in tangibility, the market to book
ratio, log of sales, and profitabilitychange book leverage by 23%, -37%. 23%, and
-
11% ofits standarddeviation respectively.9 Column (ii) contains the estimates when the dependent variable is market
leverage. All the coefficients retain their expected sign.
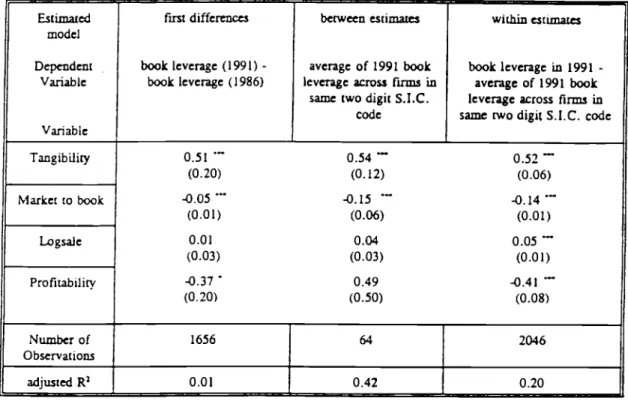
Before we examine why the partial correlations turn out as above, it is important that we check
whether the findings are robust. Rather than repeat this exercise withbothmeasures ofleverage, Table
VII b reports estimates when the dependent variables are a function of book leverage. It is possible that
some of the partial correlations may obtain because theexplanatory variables arecorrelated withsome
firm specific omitted variables. Given the parsimony of ourspecification,
it
is important that we test for this. In Table VII b, column(i), thedependent variable is book leverage itt 1991 lessbook leveragein 1986. The explanatory variables arealsodifferenced (we subtract the 1982-85averagefrom the
1987-90 average of the variable). Because the Ordinary Least Squares estimates are similar to the Tobit estimates (and are more appropriate for first differences), this is what we report in the rest of the table. All the coefficients have the same sign as in the levels regression. though the magnitudes of the
coefficients on market to book and log sales are substantiallylower. Both tangibility and the marketto
book ratio are likely to be highly autocorrelated. So by taking first differences, we largely obtain noise. Therefore, itisnot particularly surprising that the coefficient for the market to book ratio is small. In fact, it is surpdsin that we obtain the expected coefficient size for tangibility, because we would expect
6In a previous version we estimated the model includingalso companies reporting unconsolidated balance
sheets. The results were qualitatively similar.
7We average the explanatory variables to reduce the noise and to account for slow adjustments. We lag the
explanatoryvariablesone period to reduce the problem of endogeneity.
11n some cases the adjustment generates a negative value of leverage. To eliminate outliers we truncate the sample at -I. For this reason we compute Tobit regressions. The OLS results are very similar.
a similar decree of autocorrelation in tha variable. The first difference of size is asset growth. so the size coefficient may pick up both the positive effect of size on leverage and the negative effect of
growth on leverage. This couldalso explain the increase inthe standard errors for thesizecoefficient. Profitability is stronglynegativesuggestingthat itdoes not proxy for some omitted quality variable but directly influences leverage.
Next. check whether between industryvariations or within industry variations are largely
driving the
estimates. In column (ii) in Table VII b.
wereport between' estimates where the
observations are the average in the two-digit S.I.C. industry. In column (iii).we report 'within'
estimates where the observations are differences from the industry means. What is apparent from the magnitude of the coefficients in the two columns is that tangibility, the market to book ratio, and size seem to be characteristics of both the industry the firm is in and of the firm itself. Interestingly, the negative relationship between profitability and leverage appears to be specific to the within-industry regression. For the between industry regression. the coefficient is positive.To summarize, Table VII a and VII b suggest that the positive relationship between tangibility or size and leverage, as well as the negative relationship between the market to book or profitability and leverage is robust across models and specifications of leverage.
C. Cross-sectional relationships in international data.
We now move on to international data to see how many of these relationships hold up when confronted with new data. In Table VIII. we present estimates for the G-7 countries other than the U.S.. Tables V Ill a. b follow Tables VII a, b in that we first present estimates when the dependent variable
is book leverage in Table VIII a. and then conduct robustness checks in Table Vilib. Rather than examine each country separately, we outline broad patterns across countries, and then draw attention to exceptions.
In Table VIII a, tangibility is positively correlated with leverage in all countries. In the first difference regression in Table VIII b (i), the relationship is never significant. suggesting, as we anticipated. that tangibility is highly autocorrelated so that first differences are noise. Tangibility seems to be important both between industries and within industries (see Table VIII b (ii) & (iii)) except in C3naaa where itis important only in the between industry regression.
In the level regression in Table VIII a, the market to book ratio enters with a negative
coefficient in all countries except Ital. Again the estimated coefficient in first differences ma not have much meaning because of the high degree of autocorrelation. But market to book seems to both have a between industry component and a within industry component. So the idiosyncratic market to book
ratio fir a firm matters as much as the industry market to book. We will return to this finding shortly. Size is positively correlated with leverage in the levels regression, except in Germany where it is negatively correlated. Recall from Table 11 c that the largest quintile of fu-ms in Germany had much lower median leverage than the smallest quintile. so this correlation is not simply driven by outliers. The correlation continues to be negative for Germany even in first differences and within industry. But between industry the coefficient is insignificantly different from zero. So large lu-ms in Germany. in contrast to large firms in other countries, have lower leverage than small firms, and this is not simplY an industry effect.
Profitability is negatively correlated with leverage in all countries except Germany. It is economically insignificant in France. As in the U.S.. profitability is negative in first differences and is important in the within industry regression but not in the between regression.
Overall, the factors found to be important in determining capital structure of U.S firms seem to work' in other countries as welt. Based on these factors alone we can explain between 7% and 44% of the cross sectional variations of leverage in each country. Their "success" out of sample seem to provide a confirmation of their validity. However, we know that the relationship between the theories and the empirical proxies is at best weak. Therefore, before concluding that the existing theories have significant explanatory power in explaining capital structure, we should probe deeper into the theoretical underpinnings of these factors.
D. What is behind these factors?
That all the factors work' with only a few exceptions may actually be a cause for concern about our understanding of the theoretical underpinnings of those factors. For instance, an important determinant of capital structure around the world seems to be the ratio of fixed to total assets (what 'e call 'taneibilitv'). The rationale underlying this factor is that tangible assets are easy to collateralize and thus they reduce the agency costs of debt. Berger and Udell (1994) argue that firms with close relationships with creditors need to provide less collateral because the relationship (and more informed monitoring by creditors) substitutes for physical collateral. If so. we should find tangibility mattering less in the bank oriented' countries. While cautioning the reader about the obvious caveats that accompany comparisons of coefficient estimates across countries, it is interesting to note that a standard deviation increase in tangibility increases leverage by about 20% in all countries except Japan where it increases leverage by 55%. So tangibility is most important in Japan. a country with relatively weak enforcement of creditor rights and relatively strong bank firm relationships.
The market to book ratio is generally included as a proxy of the investment opportunities (see
for example. Smith and Watts, 1992). An obvious test. then,isto replace market to book with thefuture growth rate in assets in the level regression, and check whether growth race is negatively correlated with
leverage. We use the 1986 value of leverage and the growth rate in assetsinthe period 1986-1991. The
other regressors are averages over the 1982-85 period (estimates not reported). In the U.S. and Japan,
the future growth rate has the expected sign and it is statistically siificant. However, in no other
country is it significant, and in two, the coefficient is positive. When both market to book and future growth are included, the former is generally significant while the latter is not. This suggests that while the market to book ratio may be related to growth, that cannot be the whole picture.3°
There may be other potential reasons for why the market to book ratio is negatively correlated with leverage. For instance, the shares of finns in financial distress (high leverage) may be discounted at a higher rate because distress risk is priced (as suggested by Fama and French (1992)). If this is the dominant explanation, the negative correlation should be driven largely by firms with low market to
book ratios. In Table VII!. column (i), we estim