2007-5
Impact of Electronic Trading Platforms
on the Brokered Interdealer Market
for Government of Canada
Benchmark Bonds
by Natasha Khan
February 2007
Impact of Electronic Trading Platforms
on the Brokered Interdealer Market
for Government of Canada
Benchmark Bonds
by
Natasha Khan
Financial Markets Department Bank of Canada
Ottawa, Ontario, Canada K1A 0G9 [email protected]
Bank of Canada working papers are theoretical or empirical works-in-progress on subjects in economics and finance. The views expressed in this paper are those of the author.
No responsibility for them should be attributed to the Bank of Canada.
ii
I would like to thank Scott Gusba for his assistance with the CanPX dataset. I would also like to thank Chris D’Souza, Toni Gravelle, Bob Hannah, Scott Hendry, Graham Johnson, Ingrid Lo, Jon Witmer, Lorie Zorn, as well as participants at the Bank of Canada departmental seminar for their helpful comments and suggestions.
iii
This study examines the impact of increased transparency, brought about by the introduction of three electronic trading systems, on the brokered interdealer market for Government of Canada benchmark securities. Using the CanPX dataset for the 2-, 5-, 10-, and 30-year benchmarks, the paper finds some evidence of decreased bid-ask spreads for the 30-year benchmark in the months following the introduction of the electronic platforms. Bid-ask spreads are not significantly different in the pre- and post-transparency periods for the 2-, 5- or 10-year benchmarks. The price-impact coefficient, calculated using dollar value as a measure of order flow, also decreased in the post-event period for the 30-year benchmark but is not statistically different for any of the other benchmarks. Overall, there is little evidence that liquidity improved or was lowered by the introduction of the electronic systems.
JEL classification: G10, G14
Bank classification: Financial markets; Market structure and pricing
Résumé
L’auteure examine l’incidence que la hausse de la transparence due à l’implantation de trois systèmes de négociation électroniques a eue sur le marché intercourtiers des titres de référence du gouvernement canadien. D’après les données de CanPX relatives aux obligations de référence à 2, 5, 10 et 30 ans, les écarts entre les cours acheteur et vendeur des obligations à 30 ans ont diminué dans les mois qui ont suivi la mise en place des plateformes électroniques; toutefois, l’avènement de celles-ci n’a pas eu d’effet notable sur les écarts acheteur-vendeur des obligations des trois autres échéances. Même constat pour le coefficient qui sert à quantifier l’incidence du flux d’ordres (mesuré en dollars) sur les prix : il a baissé dans le cas des obligations à 30 ans, mais il n’est significativement différent pour aucune des autres échéances. Somme toute, il y a peu d’indices que l’introduction de systèmes électroniques ait entraîné une amélioration ou une détérioration de la liquidité.
Classification JEL : G10, G14
1. Introduction and Motivation
This paper studies the impact of increased transparency in the Government of Canada bond market, brought about by the introduction of electronic trading platforms. Transparency refers to the degree to which
information about trading activity, both before a trade occurs (pre-trade) and after a trade occurs (post-trade), is publicly available. Pre-trade transparency refers to the visibility of the best price at which any incoming order can potentially be executed, while post-trade transparency refers to the public visibility of the recent trading history in terms of traded price or volume or both.
The appropriate level of transparency in fixed-income markets has been the subject of recent policy debates globally.1 Central to the transparency debate is the theoretical relationship between transparency and liquidity. For most markets greater transparency of trading information is thought to improve price
discovery, promote market efficiency, and increase investor confidence which enc ourages greater investor participation leading to greater liquidity (International Organization of Securities Commissions, 2004). However, for dealership markets the relationship between transparency and liquidity is complex. If increased transparency forces market makers to make their trades public before they have had time to unwind or hedge their inventory positions, it will increase the risk that the positions will be unwound at a loss. This increased risk will increase trading costs which will eventually be passed on to investors (Gravelle, 2002). Also some firms make markets to obtain order -flow information which they exploit in subsequent trading. If increased transparency makes this information public, these firms will not have an incentive to make a market thereby decreasing liquidity (Grossman and Stiglitz, 1980).
The existing literature suggests a non-linear relationship between transparency and liquidity implying that some degree of transparency improves market liquidity but there is a point beyond which additional transparency may impair liquidity (Casey & Lannoo, 2004). This eventual trade -off between greater
1
In September 2005, the Financial Services Authority published a discussion paper seeking comments on transparency issues in the UK bond markets (FSA, 2005). The International Organization of Securities Commissions issued a report in May 2004 asking member countries to assess the appropriate level of transparency in their corporate debt markets (IOSCO, 2004). In April 2005, The Bond Market Association released a paper discussing the implications of price transparency for European bond markets. In its paper, The Bond Market Association urged regulators to examine the effect of transparency on liquidity before formulating policy with respect to increases in transparency (BMA, 2005). The Centre for European Policy Studies has also urged a “measured and deliberate action on the part of regulators” before they devise regulation to increase transparency in European bond markets (Casey and Lannoo, 2005, pg. 113). In Canada, the Canadian Securities Administrators recently extended the current exemption from transparency requirements for government securities until 31 December 2011.
transparency and market liquidity for fixed income markets indicates that there is some optimal level of transparency and that full tra nsparency may not be optimal. However, both the theoretical and empirical literature is not conclusive in further explaining the relationship between transparency and liquidity. The market microstructure literature suggests that the impact of greater transparency depends on the structure of a particular market (Gravelle, 2002; Financial Services Authority, 2005). Most studies investigating the relationship between transparency and liquidity have focused on equity markets.2 However, as Gravelle (2002) note s, it is difficult to apply results obtained from equity studies to bond markets due to several differences between these markets. In addition, most previous studies on
transparency in fixed-income markets have focused on the corporate and municipal bond sector. Also there have been no studies, to the best of our knowledge, which have considered the issue specifically for the Canadian marketplace. This paper adds to the literature by examining the impact of increased transparency on the liquidity of the Government of Canada bond market.
Traditionally, bond markets have been opaque but recent regulatory initiatives in some jurisdictions have increased the level of post-trade transparency for corporate bonds. In Canada, the Canadian Securities Administrators (CSA) introduced transparency rules for listed and unlisted corporate bonds in December 2003 but exempted the government debt market (CSA, NI 21-101).3 In the United States, the TRACE initiative , launched in July 2002, increased the level of post-trade transparency for US corporate bonds. For government bond markets in the US and Canada, currently there is no mandated post -trade
transparency but the market has developed initiatives to disseminate post trade information voluntarily. For instance, in Canada inter-dealer brokers provide, on a voluntary basis, trade information to CanPX for dissemination for actively traded government bonds in the wholesale market. In the US, all voice-based interdealer bond brokers, except one, voluntarily provide trade information to GovPX for real-time dissemination4 (International Organization of Securities Commissions, 2004).
More recent technological innovations have contributed to increasing the level of pre-trade transparency (visibility of best bid and offer quotes) by encouraging the development of electronic trading platforms known as Alternative Trading Systems (ATSs). In Canada three such platforms, CanDeal, Collective Bid
2
More recently there have been three studies investigating the impact of greater transparency in the US corporate bond market.
3 The Canadian Securities Administrators recently extended the current exemption from transparency requirements for
government securities until 31 December 2011.
4
Even though disclosure on GovPX is not regulated, the system was initially developed under a regulatory threat by the SEC. The value of GovPX has dimished with the introduction of electronic trading platforms including BrokerTec and eSpeed.
(CBID), and Bloomberg’s Bondtrader, have been operating since mid-2002. All three systems are multi-dealer to customer markets; however, the anonymous nature of CBID allows intermulti-dealer trading.5
The three systems came into operation at about the same time. CanDeal received approval to operate as an ATS in August 2002 with its first trade occurring on 10 September 2002.6 CanDeal operates a Request for Quote (RFQ) system which displays indicative best bid and offer prices from a large number of dealers allowing institutional customers to request for firm quotes from four dealers simultaneously. CBID
operates two platforms: a retail and an institutional platform. CBID received regulatory approval to operate its retail ATS in March 2002. It launched a separate market place for institutional trading in early July 2002 making it the first institutional ATS in Canada (IDA, 2005). CBID operates an anonymous central order book where dealers and institutional investors directly enter their bid and offer prices. The platform displays the firm, executable best bid and offer quotes to all participants. Because the platform is anonymous, dealers can trade with other dealers and even customers can trade directly with other customers. In September 2004, CBID added Request for Quote trading for less liquid securities to its existing live, order -driven anonymous market. Bloomberg’s Bondtrader was officially launched in July 2002 and is an order-driven institutional market where only dealers populate the order-book with firm quotes.7
The development of these electronic platforms has increased the level of pre-trade transparency in the Canadian fixed income market by making quote data available to institutional investors. Has this increase in transparency had an impact on liquidity? The increased transparency induced by the three platforms creates a natural experiment whereby we can assess the impact on liquidity. However, due to lack of data availability, we are unable to investigate the impact of these systems on the liquidity of dealer-customer markets. Nonetheless, data is available for the brokered interdealer market before and after the introduction of the three electronic systems.
5 A dealer to customer market enables institutional investors (e.g., pension funds, insurance companies, etc.) to trade with
dealers.
6
When first launched, the dealers on CanDeal included RBC Dominion, CIBC World Markets, TD Securities, Scotia Capital, National Bank Financial, and BMO Nesbitt Burns. Today all major dealers operating in Canada are providing liquidity on the CanDeal platform.
7
The liquidity providers for the Bondtrader platform include JP Morgan Canada, HSBC Canada, Deutsche Bank, and Desjardins Securities.
There is some evidence that the brokered interdealer and dealer-customer markets are linked. D’Souza, Gaa, and Yang (2003) state that “given the large and unpredictable inventory shocks typically faced by dealers in their trades with customers, interdealer debt markets have developed to facilitate inventory management and risk-sharing” (pg. 8). Also Bjonnes and Rime (2005) study the foreign exchange market, which like the fixed-income market has a decentralized multiple dealer structure, and find evidence that dealers use the interdealer market to manage positions from their customer business. In fact “access to customer orders is regarded as the most important source of private information” (Bjonnes & Rime, 2005, pg. 574). Furthermore, customers can view IDB screens and hence have access to quote information in the IDB market (even though only dealers are allowed to post quotes or trade in the IDB market). Hence it is plausible that an increase in pre-trade transparency in the dealer -customer market induced by fixed-income ATSs may have influenced liquidity in the IDB market.
This paper tests this hypothesis, that is, what impact (if any) has the introduction of the electronic platforms had on the liquidity of the brokered interdealer market for the Government of Canada Bond market? We choose the government market for a number of reasons. First of all, the ATS exemption for government securities expires by the end of 2006.8 As propos ed by the Financial Services Authority (2005) and The Bond Market Association (2005), it is prudent to examine the relationship between transparency and liquidity before formulating policy with respect to transparency of government securities. Second, recent academic literature investigating the impact of increased transparency has focused on the corporate bond market. However, good quality information on government bond pricing is essential when pricing corporate issues as it provides a riskless benchmark yield curve.
The results present some evidence of decreased bid-ask spreads in the months following the introduction of the three electronic platforms for the 30-year benchmark. Regression models which define liquidity as the dollar bid-ask spread, and control for factors such as macroeconomic news events, trading value, and volatility, indicate that bid-ask spreads were significantly narrower for the 30-year sector in the post-transparency period. The results are similar when the price-impact coefficient (calculated by defining order flow as the value of buyer-initiated trades minus the value of seller-initiated trades) is used as a measure of depth. The bid-ask spread or the price-impact coefficient is not significant ly different for any of the other benchmarks.
8
In Canada, the Canadian Securities Administrators recently extended the current exemption from transparency requirements for government securities until 31 December 2011.
It is important to note that this paper is analyzing the impact of a change in the dealer-to-customer market on the inter-dealer market. Even though the two markets are linked, as discussed above, the test would have been stronger if it was possible to test the effect of the change in transparency in the dealer-to-customer market itself on the dealer-to-customer market. Furthermore, this paper examines the impact of a change in pre-trade transparency brought about by market innovation whereas the recent policy debates are more focused on the effect of post-trade transparency mandated by regulation.
The remainder of this paper is structured as follows: the next section discusses previous literature; section 3 describes the data set while section 4 explains the methodology; section 5 presents the results; and section 6 concludes the paper.
2. Literature Review
The academic debate over the effect of increased transparency on liquidity is on-going. Analysis of existing literature, however, seems to suggest that some degree of transparency improves market liquidity but beyond a certain point further increases in transparency may impair liquidity (Casey & Lannoo, 2004). This indicates that there is some optimal level of transparency and that full transparency may not be optimal. However, both the theoretical and empirical literature is not clear in further explaining the relationship between transparency and liquidity.
2.1 Competing Hypotheses
Intuitively it seems that greater transparency should lead to greater efficiency and higher liquidity. As Glosten (1999) states “increased transparency should lead to a greater commonality of information” (pg. 1). This should reduce the adverse selection problem and lead to faster incorporation of information and thus more efficient prices, and smaller spreads due to less fear of being picked off by informed traders (Glosten, 1999).
However, alternative theories suggest that a lack of transparency may lead to lower initial spreads because dealers compete to get or der flow and use the information they acquire from the order flow to gain profits in subsequent rounds of trading (Glosten, 1999). As Grossman & Stiglitz (1980) note, traders who spend resources to gather information expect to be compensated for it and “the only way informed traders can earn a return on their activity of information gathering, is if they can use their information to take positions in the market which are ‘better’ than the positions of uninformed traders” (Grossman & Stiglitz, 1980, pg. 404). The ability to learn from trade and quote information can reduce the need to compete through prices (Bloomfield & O’Hara, 1999).
Also, uninformed traders may prefer less transparent markets which allow them to “hide” their liquidity needs from the market (Bloomfield & O’Hara, 1999, pg.10). Grossman and Stiglitz (1980) argue that speculative markets will be thinner if the “percentage of individuals who are informed is either near zero or near unity” (pg. 395). They claim that individual beliefs may be identical in one of two situations: (1) when all individuals are uninformed (which is the only possible equilibrium when there is very little noise in the price system and hence prices convey all information and there is no incentive to purchase information) or (2) when all individuals are informed (when costs of information are very low because for sufficiently low costs all uninformed individuals will desire to be informed). Since a major determinant of trade among individuals is differences in beliefs, Grossman and Stiglitz (1980) contend that “when information is very inexpensive, or when informed traders get very precise information, then equilibrium exists and the market price will reveal most of the informed traders’ information” but “such mar kets are likely to be thin because traders have almost homogeneous beliefs” (pg. 404). There is therefore “a fundamental conflict between the efficiency with which markets spread information and the incentives to acquire information” (Grossman & Stiglitz, 1980, pg. 405).
Most empirical studies investigating the relationship between transparency and liquidity have used equity market data. These studies suggest that transparency affects liquidity, trading costs, and the speed of price discovery but the results are mixed. The next section discusses these papers.
2.2 Empirical Research in Equity Markets
Natural Experiments:
Madhavan, Porter, and Weaver (2005) study the effect of pre-trade transparency on the market by
analyzing the natural experiment created when the Toronto Stock Exchange publicly disseminated the limit order book on both the traditional floor and on its automated trading system on 12 April 1990. Since real-time detailed information on the limit order book is publicly displayed simultaneously on both platforms, they are able to control for stock-specific factors as well as the type of trading system. The ir results suggest that the higher level of transparency achieved after the limit order book is publicly displayed does not improve market quality. Rather an increase in transparency increases execution costs even after controlling for other factors and thus reduces liquidity and increases volatility (Madhavan, Porter, & Weaver, 2005).
Boehmer, Saar, and Yu (2005) reach the opposite conclusion when they study pre-trade transparency by examining the January 2002 introduction of the New York Stock Exchange’s (NYSE) OpenBook service which allows off-exchange traders to observe depth in the limit order book in real time at each price level for all securities. They find that effective spreads fall with the improvement in pre-trade transparency. They also find a higher cancellation rate, a shorter time-to-cancellation, and smaller limit orders after the increase in transparency. They conclude that the increase in pre -trade transparency thus reduces spreads and improves certain dimensions of market quality (Boehmer, Saar, and Yu, 2005).
Madhavan, Porter, & Weaver (2005) study the Toronto Stock Exc hange (TSX) , whereas, Boehmer, Saar, and Yu (2005) ana lyze the NYSE which operates under a “specialist system” and has features of both order-driven and quote-driven markets9. Boehmer, Saar, and Yu (2005) believe that the conflicting results are not due to differences in market structure since Madhavan, Porter, and Weaver (2005) study the floor of the TSX that “features Registered Traders who are similar to specialists” (pg. 807). They attribute the conflicting results to developments “in information processing, order-handling, and trading technologies”
9 In an order-driven market (auction-agency market), buy and sell orders are brought together on the order book of the exchange
and matched according to the exchange’s standard matching procedures. In a quote-driven market (dealer market), market makers (dealers) quote bid and ask prices and traders choose whether to buy or sell at the quoted prices. Under the NYSE’s specialist system, specialists match buy and sell orders on their order books (like an auction market). However, specialists are also obligated to provide liquidity to the market as market makers when orders disappear from one side of the market. They perform this function by quoting bid and ask prices and being ready at all times to transact at their quoted price (like a dealer market).
(pg. 807) that occurred over the time frame between the two events studied, the TSX in 1990 versus the NYSE in 2002.
Hendershott and Jones (2003) examine pre-trade transparency by investigating the effect of Island
electronic communications network’s September 2002 decision to stop displaying its automated limit order book in three most active exchange -traded funds in response to regulatory enforcement. They find that Island’s trading activity and price discovery falls and price discovery moves to the futures market. Also as a result of zero transparency on Island, its effective and realized spreads increased when it went dark while effective and realized spreads decrease d in other markets. However, the increase in spreads on Island more than offsets the decrease in other markets, increasing overall trading costs and decreasing overall market quality (Hendershott & Jones, 2003).
Gemmill (1996) analyzes the relationship between post-trade transparency and liquidity by studying block trades under different post-trade transparency regimes on the London Stock Exchange (LSE). There were three different regimes for the publication of last-traded prices (immediate publication, 24-hour delayed publication, and 90-minute delayed publication) on the LSE between October 1986 and January 1996. Gemmill (1996) finds that, contrary to arguments made by dealers, “delaying publication does not change block spreads and so does not improve liquidity” (pg. 1767). He finds that it is market volatility and not the speed of publication that explains the size of spreads on block trades relative to small trades (Gemmill, 1996).
Laboratory Experiments:
Changes in transparency regimes are infrequent and as suggested by Glosten (1999) “hardly ever exogenous” (pg. 2). This creates a challenge for developing a clear test with an exogenous change in transparency. To overcome this difficulty, some researchers have proposed laboratory experiments for testing the theories. When designing experiment al markets, the researcher can control for factors other than transparency and thus isolate the effect of a change in transparency. However, experimental designs vary in the degree to which they correspond to actual markets and the extent to which behavioral restrictions are imposed on the participants (Glosten, 1999).
Bloomfield and O’Hara (1999) design a laboratory experiment to study the effects of pre-trade and post-trade transparency on spreads, price efficiency, and post-trader welfare. The ir experimental market uses humans and robots (computerized traders) to trade against two market makers (dealers) but does not allow dealers to trade with each other. The trading session is divided into distinct trading rounds with trading taking place in three different settings with varying degrees of transparency (transparent, semi opaque, and
opaque). The results show that higher post-trade transparency results in greater informational efficiency of prices but also results in higher opening spreads, perhaps by reducing incentives for market makers to compete for order flow. Spreads in later rounds are less affected by transparency because information is already contained in market prices and there is less benefit to capturing late round order flow. They conclude that trade disclosure (post-trade transparency) benefits market makers at the expense of liquidity traders and informed traders. They also find that pre-trade transparency (quote disclosure) has no visible effect on market performance.
Flood et al (1999) also design a laboratory experiment to study the effects of market transparency but reach roughly opposite conclusions to Bloomfield and O’Hara (1999) , namely that higher transparency results in lower spreads and higher trading value but less efficient prices (Flood, Huisman, Koedijk, & Mahieu, 1999). However, t he differences in experimental design between the two papers make a direct comparison of results difficult. For instance, the Flood et al (1999) market allows for pre-trade transparency (live quotes) only, and uses actual securities dealers as subjects as opposed to MBA students used by Bloomfield and O’Hara (1999). Also the Flood et al (1999) market has seven market makers (dealers), allows dealers to trade with each other , and the trading session is continuous.
2.3 Bond Market Research
As stated previously, most empirical research investigating the impact of changes in transparency regimes on market liquidity have focused on equity markets. The theoretical research and experiments discussed earlier also construct equity market models. However, as Gravelle (2002) discusses, several differences between government bond markets and equity dealership markets may “make results garnered from the recent multiple-dealer equity research inapplicable to GS [government securities] markets” (pg. 2). The paper discusses three intrinsic differences between equity markets and government bond markets. First, equity market models are based on the assumption that a subset of investors has private information about
the fundamental value of the security. Gove rnment securities, however, depend on the “term structure of the underlying risk-free interest rates” which in turn depends on “macroeconomic factors about which investors do not have private information” (pg. 3). Second, equity securities have an infinite maturity while government bonds have a finite term to maturity. Third, there are more instruments available to hedge government securities than equities. Thus, equity models are inappropriate for studying bid-ask spreads for government securities (Gravelle, 2002). This section discusses studies investigating effects of different transparency regimes specifically for fixed-income markets.
Municipal bonds:
Green, Hollifield, and Schurhoff (2005) estimate measures of dealer bargaining power by analyzing trades between dealers and customers in municipal bonds. They use a sample collected by the Municipal
Securities Rulemaking Board. The data they study are made public after an initial time lag of one day for bonds that trade more than four times during a day and one month for all other trades. Over the sample period though, the time lag is shortened in several steps thus creating a natural experiment to study the effect of increased transparency. Green, Hollifield, and Schurhoff (2005) cannot associate individual trades to specific dealers and have to infer them indirectly. They develop a theoretical model to decompose the dealer’s profits into a portion that reflects the dealer’s costs and a portion due to the dealer’s market power. Their results show that dealers’ market power is highest for small to medium sized transactions and the market power decreases with trade size.
Harris and Piwowar (2004) design an econometric model to estimate transaction costs for a sample of U.S. municipal bond trades collected by the Municipal Securities Rulemaking Board (MSRB). They find that municipal bond trades are significantly more expensive for retail investors than institutional investors (average effective spreads of about 2 percent for retail trades of $20,000 ve rsus 1 percent for institutional trades of $200,000). They also find that municipal bond trading costs decrease with trades, do not depend on trade frequency, and are substantially more expensive than similar sized equity trades. They attribute their results to the lack of price transparency in municipal bond markets (Harris & Piwowar, 2004) .
Corporate bonds:
In the U.S. the level of post-trade transparency increased significantly for corporate bonds when the National Association of Securities Dealers (NASD) launched the Trade Reporting and Compliance Engine
(TRACE) in July 2002. Initially TRACE publicly disseminated information on 500 corporate debt securities including 50 high-yield bonds but over time additional groups of bonds were added. The
structural change in post-trade transparency initiated by TRACE has provided researchers with the unique opportunity to investigate the impact of increased transparency.
Goldstein, Hotchkiss, and Sirri (2006), commissioned by the NASD, perform a controlled experiment to investigate the impact of increased post-trade transparency on liquidity of the BBB bond market. Using TRACE data, the authors choose 90 BBB bonds for which the NASD began public dissemination in real-time on 14 April 2003. They simultaneously match the 90 disseminated bonds on industry, trading activity, bond age, and time to maturity to construct a control sample of 90 non-disseminated bonds. The authors also select a separate matched-pair sample of 30 thinly traded BBB bonds that were publicly disseminated with a control sample of 30 bonds that were not disseminated.
Goldstein, Hotchkiss, and Sirri (2006) use two different methods for calculating spreads. The first is a direct measure of the round-trip cost of trading a bond while the second is an estimate calculated by
regressing the difference between the transaction price and a bid price on a dummy variable that equals one for customer buys and zero for customer sells. The second method uses estimated rather than actually observed dealer bid prices (they use dealer bid prices reported by Reuters). They find that the effect of transparency varies by trade size. The results show that spreads decrease for bonds whose prices become transparent with the strongest impact on intermediate trade size. However, they do not find any effect of transparency on the very thinly traded bonds (either positive or negative) and conclude that overall increased post-trade transparency has a neutral to positive impact on market liquidity as measured by an estimated bid-ask spread. They do not find any increase in daily trading value or number of transactions per day after the increase in transparency.
Edwards, Harris, and Piwowar (2005) use TRACE data to investigate the effect of introducing price transparency on corporate bond transaction costs. They estimate transaction costs using an econometric model, where the price at which the trade occurred is equal to the unobserved fundamental price of the bond, plus or minus a price concession that depends on whether the trade initiator was a buyer or a seller. The authors find that transaction costs are lower for transparent bonds than for similar opaque bonds and that transparency decreases investor transaction costs by roughly 5 basis points. Their results suggest that retail investors benefit the most from enhanced transparency as the decline in transaction costs for bonds
that are made TRACE-transparent is greater for small trades than for large ones and the cost of trading decreases significantly with trade size. Edwards, Harris, Piwowar (2004) also find that average transaction costs for corporate bonds (approximately 138 basis points) are considerably larger than for stocks (less than 40 basis points). The authors attribute this cost disparity across markets to differences in market structures, the most important one being transparency.
Bessembinder, Maxwell, and Venkataraman (2005) estimate trading costs for institutional trades in
corporate bonds before and after the initiation of TRACE. They argue that this allows them to determine if transaction reporting and thus improved information for some bonds allows better valuation and hence quality than of other non-reported bonds. Their results support the argument since they find that trading costs decrease by 20% for non-TRACE-eligible bonds (average one-way reduction of 4 bps) and 50% for TRACE-eligible bonds (average one -way reduction of 6-7 bps). They conclude that transparency is important even for relatively sophisticated institutional investors.
All three papers reach the conclusion that improved transparency has reduced transactions costs and thus not adversely affected liquidity as feared.10 However, it is important to note some general caveats of this research. First, there has been some criticism that these papers have not accounted for the broader changes, such as the growth of the credit derivatives market, that have taken place in recent years (Financial Services Authority, 2006).11 In addition, TRACE data does not include the actual bid-ask spread and hence these studies use econometric models to indirectly estimate bid-ask spreads.12 Furthermore, the US corporate bond market is structurally different from the Canadian government bond market. For instance direct retail participation is much higher in the US corporate bond market than the Canadian government bond market. Hence, the TRACE experience in the US corporate bond markets may have little relevance for the
Canadian government bond market.13
10 Although some anecdotal evidence from dealers suggests that TRACE has increased volatility and hampered liquidity
particulalry in the high-yield market (BondWeek, 2005).
11
Credit derivatives drive price formation in cash corporate bond markets and hence enable dealers to offer lowe r bid-ask spreads and improve liquidity and efficiency of cash markets.
12 Goldstein, Hotchkiss and Sirri (2006) also use a direct “dealer round trip” method to estimate spreads. It is, however, still an
estimate of the actual spread.
13
3. Data
The CanPX dataset is used for this study for the period 25 February 2002 to 28 February 2003 for the 2-, 5-, 10-, and 30-year benchmarks. The dataset has been previously used by D’Souza, Gaa, and Yang (2003) and D’Souza and Gaa (2004). Following D’Souza, Gaa, and Yang (2003) , we define benchmark secur ities based on the Government of Canada’s issuance calendar.14
Launched on 1 May 1999, CanPX consolidates the feeds of IDBs on one screen and displays the best bid and best ask price and yield quotes as well as the minimum size across all participating dealers for actively traded government bonds (D’Souza, Gaa, and Yang, 2003) . CanPX data has the advantage that it contains both quote and trade information and includes bid-ask spreads (price and/or yield), the value offered and bid at each quote, whether the trade is buyer-initiated or seller-initiated, trade price, trade value , and broker identity. The four brokers during the sample period are Freedom International Brokerage Company, Prebon Yamane (Canada) Ltd., Shorcan Brokers Limited, and Tullet Liberty (Canada) Ltd.
The raw data is downloaded from the CanPX screen each time the screen changes. This compilation procedure results in significant duplication (for instance, if the information on the screen changes for the 5-yr benchmark bond, the entire screen is downloaded again including bonds for which the information remained unchanged). The data thus requires filtering prior to conducting tests. The initial filtering methodology is described in D’Souza, Gaa, and Yang (2003) Appendix A.15
In order to analyze the data, we follow D’Souza, Gaa, and Yang (2003) and divide each day into 144 discrete 5-minute intervals from 6am to 6pm. For each bond, the quote data (ask price, value offered, ask yield, bid price, value bid, bid yield) reflects the most recently updated information over the interval. For trade information, trade value is calculated as the cumulative value traded within the interval (buyer-initiated and seller-(buyer-initiated), trade price is the volume-weighted average price for all trades within the interval, and trade frequency is the cumulative number of trades within the interval. We also keep a separate record for buyer-initiated trades and seller-initiated trades in order to construct measures of order flow.
14 The banchmark is “based on the final auction at which that security’s cumulative issuance crosses into the specified range of
$7 to $10 billion for the 2 -year sector, $9 to $12 billion for the 5 -year sector, and $12 to $15 billion for the 10-year and 30-year sectors” (D’Souza, Gaa, and Yang, 2003).
15
In order to obtain information on the total secondary Government of Canada bond market, we also download data from the Market Trade Reporting System (MTRS) database. The MTRS database,
introduced in 2000 by the Investment Dealers Association (IDA) and the Bank of Canada, is “an automated interface for secondary market transactions in domestic bonds and money markets” (IDA, 2003). The reports include weekly data from Thursday to Wednesday. The MTRS database reports trading activity in Government of Canada bonds separately for banks, inter-dealer brokers, investment dealers, etc., as well as term to maturity (0-3 years, 3-10 years, over 10 years). However, data is not collected separately for
benchmark securities so for instance, total trading in the 2-year benchmark is aggregated with all GoC securities maturing within 3 years.
4. Methodology
Analyzing the impact of transparency on liquidity is particularly challenging because changes in a
transparency regime are rare which makes it difficult to isolate the effect of a change in transparency. The task becomes even more challenging if different transparency regimes stretch over a long period of time , which makes isolating differences introduced by the passage of time especially difficult.
The level of pre-trade transparency for the customer-to-dealer segment of fixed-income markets in Canada changed with the introduction of three electronic platforms in mid-2002. This created a natural experiment providing the opportunity to study the relationship between transparency and liquidity. Two of the ATSs, CBID and Bondtrader, began operations in July 2002 while CanDeal, the third and now the largest by dollar value traded, had its first trade in September 2002. Given the close proximity of the dates, it is not possible to isolate the effect of each indiv idual system. Thus this study analyzes the combined impact of the three systems and does not attempt to isolate the effect of each different system.
It is plausible that prices may change in anticipation of an event (Boehmer, Saar, Yu, 2003). Thus market prices may have changed following the regulatory approval of the ATSs (before they became fully operational). However, the three systems became operational soon after they received regulatory status (e.g., CanDeal received regulatory status in August 2002 and had its first trade on 10 September 2002). Also, pre-trade transparency increased only after the systems were operational and quotes became visible to
subscribers. Thus this study defines the event period as the three months July, August, and Septembe r of 2002. In order to identify the liquidity effects of the change in pre-trade transparency, we measure liquidity before and after the event. The pre-event period is chosen as the four month period from the beginning of March to the end of June 2002. To give the market time to adjust to the changed transparency regime and reach an equilibrium state, we chose the post-event period as the five month period from the beginning of October 2002 to the end of February 2003. 16
4.1 Hypothesis Development
Liquidity
Measuring market liquidity, however, is complicated by the fact that it is a multi-dimensional concept. Usually liquidity comprises at least one of three dimensions including tightness, depth, and resiliency (D’Souza, Gaa, and Yang, 2003; CGFS, 1999; Kyle, 1985). Tightness is the cost of turning around a position over a short period of time. The most commonly used measure of tightness is the bid-ask spread17 (Kyle, 1985; CGFS, 1999). Depth is the size of a transaction that can be absorbed without changing prices and it is usually measured by the number of orders on the order book at a given time (D’Souza, Gaa, and Yang, 2003; CGFS, 1999; Kyle, 1985). Resiliency is the speed with which prices recover from a random, uninformative shock (Kyle, 1985). There is no consensus on an appropriate measure for resiliency but it is considered useful since it measures potential market depth which cannot be observed from current order flow (CGFS, 1999) .18
Other measures have also been used as readily observable proxies of market liquidity. For instance, D’Souza, Gaa, and Yang (2003) propose a range of liquidity measures in addition to bid-ask spreads including trading value , trade frequency, quote size, trade size, and price-impact coefficients. However, they find that bid-ask spreads and price-impact coefficients are the most appropriate measures of liquidity for the Government of Canada securities market (D’Souza, Gaa, Yang 2003). Therefore, in this study we
16
We also conduct rob ustness tests using different pre- and post- event periods and obtain similar results.
17
There are several possible ways to measure the bid -ask spread including quoted spread, realized spread, and effective spread (see CGFS, 1999 for detailed definitions).
18 Immediacy is another concept defined as “the time necessary to execute a trade of a certain size within a certain price range”
but since it encompasses elements of the other three dimensions it is not “strictly speaking a separate dimension” (CGFS, 1999 , pg. 13, footnote 5).
use these two measures of liquidity and test the null that liquidity in the brokered interdealer market is unchanged before and after the introduction of the transparency enhancing ATSs.
Previous bond studies have used econometric methods to estimate spreads because the data they used did not allow spreads to be measured directly (for example, TRACE data does not include pre-trade quote information and hence studies using this data have to develop models to estimate spreads ). We are fortunate that the CanPX dataset used for this study includes both quote and trade data making it possible to directly measure the quoted spread. Our first measure of liquidity (tightness) is calculated as the difference between the quoted bid and ask prices divided by the mid-point {(Pask – Pbid) / (Pask + Pbid)/2}.
Order flow contains directional information and impacts prices and yields. For instance, a greater number of buyer-initiated trades versus seller-initiated trades are expected to put upward pressure on prices. One dimension of liquidity implies that a liquid market can absor b incoming orders without a huge impact on prices. Brandt and Kavajecz (2004) find that the effect of order flow on yields in the U.S. treasury market is strongest when liquidity is low, consistent with “market participants paying more attention to order flow when the subjective valuations are relatively uncertain (and liquidity is therefore low)” (pg. 2626). Thus a high price-impact coefficient implies reduced liquidity. We follow D’Souza and Gaa (2004) and calculate the price-impact coefficient (ß1), our second measure of liquidity, by using Kyle’s (1985) model and
regressing log changes in bid/ask midpoint prices (Q) on one of two measures of order flow (OF) over a 5-minute interval:
Log (Qi,t) – log (Qi,t -1) = ß0 + ß1OFi,t + µi,t (1.1)
The first measure of order flow is calculated as the dollar value of buyer-initiated trades minus the value of seller-initiated trades cumulated over the 5-minute interval while the second measure is calculated as the number of buyer-initiated trades minus the number of seller-initiated trades over the 5-minute interval.
Wider bid-ask spreads and higher price-impact coefficients imply reduced liquidity and indicate dealers’ unwillingness to make markets during times when prices may change sharply.
Control Variables
As noted above, there are several factors other than transparency that impact liquidity. It is, therefore, imperative to control for these factors, which are discussed in this section:
a. Macro-news
Macroeconomic news events and auctions greatly influence market liquidity for fixed-income securities. D’Souza and Gaa (2004) find a two-stage adjustment process to macroeconomic news announcements for the Government of Canada bond market. They only consider 8:30am Canadian and US news
announcements19 and report that “in the first stage, bid/ask spreads widen in the 5-minute interval before and after an announcement”. In an extended second stage, price volatility, trading values, and trade and quote activity increase to higher-than-normal levels following the 8:30 a.m. macroeconomic news release, with statistically and economically significant effects persisting in some cases up to 25 minutes following the event…” (D’Souza and Gaa, 2004, pg. 18). Also, price-impact coefficients are significantly lower on announcements days in the 60 to 90 minute interval after the release of macro-news.
They also report that “spreads are lower on auction days in the 5 to 10 minutes prior to an auction cut-off” and that “spreads widen after the auction cut-off time, and do not return to normal levels for up to two hours” (D’Souza and Gaa, 2004, pg. 17). For the sample period, bond auctions were held at 12:30 pm with results released at 12:45 pm before 9 December 2002 and 12:40 pm starting 9 December 2002 (D’Souza and Gaa, 2004). In order to control for macroeconomic news events and auctions, we limit regression analysis to the 10:1 0 am to 12:00 pm time period. That is, for each day in the pre- and post-event period, we only use the data in the 10:10 am to noon time frame when running the regression models.
b. Dollar Trade Value
Dollar spreads are known to decrease with dollar value according to both asymmetric information and inventory control models of dealer behaviour (Madhavan, Porter, and Weaver, 2005; Boehmer, Saar, and
19
In Canada, all major economic data is released at 8:30am with the exception of CPI and Labor Force Survey released at 7:00am, Housing Starts released at 8:15am and Ivey Purchasing Manager Index released at 10:00am.
Yu, 2005).20 In fact, there is such a strong correlation between trading volume and liquidity that trading volume is widely cited as a proxy for market liquidity and markets that have a relatively large amount of trading activity are considered to be the most liquid (D’Souza, Gaa, and Yang, 2003). Therefore, in this paper we control for dollar trade value, defined as the total value of securities traded in the 10:10am to noon interval for each day.
c. Trade Volatility
Inventory control and asymmetric information models of microstructure theory suggest that liquidity is negatively correlated with volatility. Dealers increase spreads during periods of increased volatility to decrease their risk of being caught on the wrong side of the trade. Thus spreads increase with return volatility (Madhavan, Porter, and Weaver, 2005; Boehmer, Saar, and Yu, 2005). We therefore include volatility as a control variable in the models analyzed in this study.
There are several measures of volatility proposed in the literature including squared return, high-low measures (also known as range-based or extreme-value measures), standard deviation, and realized volatility. 21 Since bonds are not traded as frequently as equities, we do not necessarily have a trade price for every 5-minute inter val. Hence we decide against calculating realized volatility using intraday squared returns at 5-minute intervals. Instead we follow Madhavan, Porter, and Weaver (2005) and use standard deviation of trade price as a measure of volatility.22
4.2 Model Specification
The dependent variable is one of two measures of liquidity and the independent variables include the control measures of trade value, volatility, and a dummy variable that take s the value of 1 for the post-event period and 0 otherwise. This mode l specification is similar to the econometric specifications in Boehmar,
20 Microstructure theory suggests that order flow affects prices through two channels in a dealership structure. According to the
asymmetric information model, dealers adjust price in response to order flow that may reflect private information. According to the inventory control model, dealers adjust price to control inventory fluctuation due to order flow (Lyons, 1995).
21 Variance, square of standard deviation, is also used as a volatility measure but it is less stable and less desirable for computer
estimation. Also standard deviation has the same unit of measure as the mean making it more convenient and intuitive than variance.
22
Saar, and Yu (2005) and Madhavan, Porter, and Weaver (2005). As stated earlier, we use two measures of liquidity. The first is the quoted bid-ask spread while the second is the price-impact coefficient.
Model 1A – Pooled spread regression
The first model is specified as:
Si,t = a0 + a1Valuei,t + a2 Sigmai,t + a3 Post + µi,t (1.2)
where, Si,t is the quoted bid -ask spread for bond i in period t (daily measure using observations in the
10:10am to noon period) calculated as {(Pask – Pbid) / (Pask + Pbid)/2}, Valuei,t is the trade value for bond i in
period t, Sigmai,t is the volatility expressed as the standard deviation of trade price, and Posti,t is the
dummy variable that takes the value of 1 for the post-event period and 0 for pre-event observations. All benchmarks are pooled together in this model. This specification uses the constant coefficient or pooled regression model by assuming that there are neither significant security effects nor significant temporal effects in the panel data (so both the intercepts and slopes are constant).
Model 2A – Dummy variable spread regression
As stated earlier, this study examines four benchmark securities. Since bonds behave differently based solely on their term to maturity it is plausible that there is an unknown variable that differs between the four securities but is constant over time. If this unobserved variable is correlated with the explanatory variables in the above models then the least squares estimators will be biased and inconsistent due to the omitted variable (Greene, 2003). However, in such an instance a model may be employed which requires that the fixed effects be independent of the error terms but they may be correlated with the other explanatory variables (Davidson and MacKinnon, 2004).
We therefore specify a dummy variable regression and assume constant slopes but intercepts that differ according to the cross-sectional benchmark by using three dummy variables for the four benchmarks. This model is specified as:
where, Si,t, Valuei,t, Sigmai,t, Posti,t are defined as above. Mat5 is 1 for the 5-year benchmark and 0
otherwise, Mat10 is 1 for the 10-year bond and 0 otherwise, and Mat30 is 1 for the 30-year benchmark and
0 otherwise.
To further explore the results, we extend the above model by including interaction dummies and running the model specified as:
Si,t = a0 + a1Valuei,t + a2 Sigmai,t + a3 Post + a4 Mat5 + a5 Mat10 + a6 Mat30 + a7 Post*Mat5 + a8
Post*Mat10 + a9 Post*Mat30 + µi,t (1. 4)
Model 3A – Benchmark spread regression
In order to allow the intercepts and slopes to vary across the benchmarks, we run separate regressions for each security. Thus we specify the following four equations:
S2t = a0 + a1Valuet + a2 Sigmat + a3 Post + µt (1.5)
S5t = a0 + a1Valuet + a2 Sigmat + a3 Post + µt (1.6)
S10t = a0 + a1Valuet + a2 Sigmat + a3 Post + µt (1.7)
S30t = a0 + a1Valuet + a2 Sigmat + a3 Post + µt (1.8)
where S2t,S5t, S10t, andS30t are the percentage quoted spreads in period t for the 2-, 5-, 10-, and 30-year
benchmarks respectively.
Model 1B – Pooled price-impact coefficient regression
We also specify a two-step model where, in the first step, the price-impact coefficients are calculated using equation (1.1). In the second step the values for the coefficient ß1 are collected and used as a measure of
liquidity instead of the percentage quoted spread. Hence, the model is specified as:
PIi,t = a0 + a 1Valuei,t + a2 Sigmai,t + a3 Post + µi,t (1.9)
where, PIi,t is the beta coefficient collected from equation (1.1) for bond i in period t (daily measure estimated
using 22 5-minute observations in the 10:10am to noon period), Valuei,t is the trade value for bond i in period t,
Sigmai,t is the volatility expressed as the standard deviation of trade price, and Posti,t is the dummy
variable that takes the value of 1 for the post-event period and 0 for pre-event observations. Similar to model 1A, all the benchmarks are pooled together in this model as well.
Model 2B – Dummy variable price-impact coefficient regression
Similarly we specify equation (1.3) and (1.4) using the beta coefficient collected from equation (1.1) as the dependent variable (PIi,t) instead of the percentage quoted spread.
PIi,t = a0 + a1Valuei,t + a2 Sigmai,t + a3 Post + a4 Mat5 + a5 Mat10 + a6 Mat30 + µi,t (1.10)
PIi,t = a0 + a1Valuei,t + a2 Sigmai,t + a3 Post + a4 Mat5 + a5 Mat10 + a6 Mat30 + a7 Post*Mat5 + a8
Post*Mat10 + a9 Post*Mat30 + µi,t (1.11)
Model 3B – Benchmark price-impact coefficient regression
Again in order to allow the intercepts and slopes to vary across the benchmarks, we repeat equations (1.5 to (1.8) using the price-impact coefficient (PIi,t) as the left-hand variable resulting in the following four
equations:
PI2t = a0 + a1Valuet + a2 Sigmat + a3 Post + µt (1.12)
PI5t = a0 + a1Valuet + a2 Sigmat + a3 Post + µt (1.13)
PI10t = a0 + a1Valuet + a2 Sigmat + a3 Post + µt (1.14)
PI30t = a0 + a1Valuet + a2 Sigmat + a3 Post + µt (1.15)
5. Results
This section presents some descriptive statistics and univariate tests as well as the results for the regression models specified above.
5.1 Descriptive Statistics
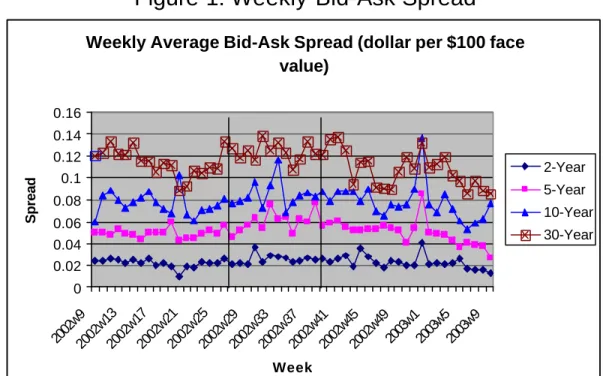
Figure 1 shows the weekly average bid -ask spread (dollar per $100 face value) over the entire CanPX day (6am to 6pm) from 26 February 2002 to 28 February 2003. As expected, spreads widen with term to maturity, reflecting the greater market risk associated with longer maturity. The 2-year benchmark has the lowest spread and hence is the most liquid followed by the 5-year, 10-year , and 30-year sectors
respectively. Figure 2 shows the weekly cumulative trading value ($ million) over the entire CanPX day (6am to 6pm) from 26 February 2002 to 28 February 2003. The 2-year benchmark has the highest weekly trading value while the 30-year has the lowest.
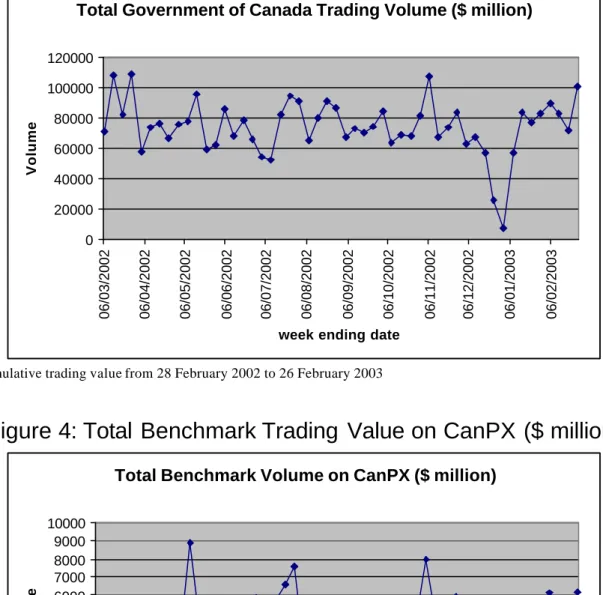
Figure 3 shows the weekly total trading value for all Government of Canada securities from 28 Febr uary 2002 to 26 February 2003 using MTRS data. Figure 4 shows the weekly total trading value for benchmark securities on CanPX during the period 26 February 2002 to 24 February 2003.23 The graphs show a somewhat similar pattern of trading.24
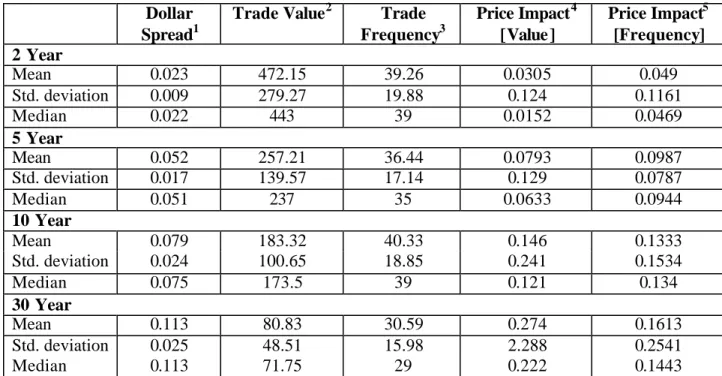
Table 1 shows the mean, median, and standard deviation for daily average bid-ask spread (dollar per $100 face value), daily cumulative trading value ($ million), and total number of trades per day respectively over the entire CanPX day (6am to 6pm) from 26 February 2002 to 28 February 2003 for each of the sectors.
The 2-year benchmark has the narrowest mean spread of $0.023 per $100 face value and the highest mean daily trading value of $472 million. The 10-year benchmark is traded more often than the 2-year and 5-year sectors but the cumulative dollar value traded for the 10-year benchmark is lower (mean trading value of $183 million versus $258 million for the 5-year). The 10-year benchmark is the most frequently traded sector with an average of 40 trades per day. The 2-year benchmark is traded on average 39 times per day followed by the 5-year sector with an average of 36 trades per day, and the 30-year benchmark with an average of 31 trades per day.
Table 1 also shows the daily average price impact coefficients from 26 February 2002 to 28 February 2003 for each of the benchmark bonds. The average daily price impact coefficient, calculated by using the value of buyer-initiated trades minus the value of seller-initiated trades as the measure of order flow, is the highest for the 30-year benchmark (0.27*10-4) and lowest for the 2-year bond (0.03*10-4). The average daily price impact coefficient, calculated by using the number of buyer-initiated trades minus the number of seller-initiated trades as the measure of order flow, is also the highest for the 30-year and lowest for the 2-year benchmark.
23 The MTRS database collects weekly data from Thursday to Wednesday while the weekly CanPX data is cumulated from
Tuesday to Monday.
24
The graphs display decreased trading value for the first week of 2003 (four trading days between 2 - 7 January 2003) which reflects a seasonal effect. All tests are re-run excluding data for these days and results are consistent.
5.2 Univariate Tests
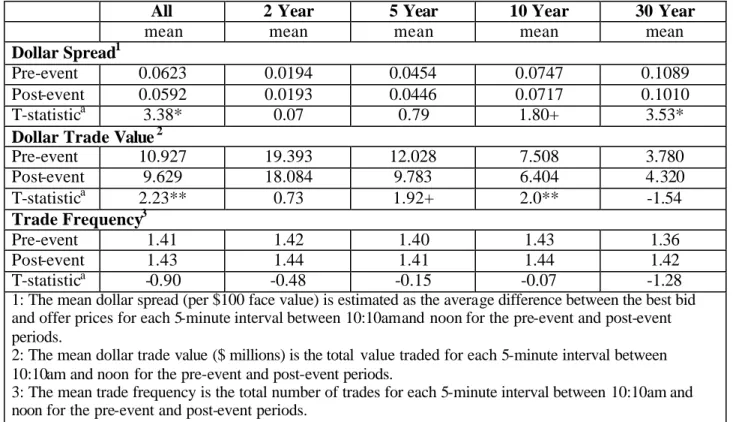
The mean dollar bid-ask spread, trade value , and trade frequency are presented in Table 2 for the pre- and post-transparency periods for each benchmark using 5-minute interval data for each day between 10:10am and noon. The pre-event period runs from 4 March 2002 to 28 June 2002 while the post-event period runs from 1 October 2002 to 28 February 2003. The table also presents the t-statistic for the test that the difference between the mean of pre- and post-transparency periods is zero for each of the variables. The null for the t-test is:
Ho: mean(pre-event) – mean(post-event) = 0
As the table shows the mean spread for the pre-event period for all benchmarks is $0.0623 (per $100 face value) while the mean spread for the post-event period is $0.0592 (per $100 face value). This difference is significant (t =3.38) at the one percent level suggesting that spreads are significantly narrower in the period following the introduction of the ATSs. However, the results for each benchmark show that the results are driven mostly by the 30-year benchmark. The average spread for the 30-year benchmark is lower at the one percent level of significance in the post-event per iod (t-stat =3.53 and average spread of $0.1089 in the post-event period versus $0.1010 in the pre-event period). The mean spread for the 10-year is significantly lower but only at the ten percent level with a t-stat of 1.8.
The table also shows that the mean dollar trade value is lower in the post-event period at the five percent level (t = 2.23). Further investigation shows that trade value was significantly lower for the 5- and 10-year benchmarks only in the post-event period. There is no statistically significant difference in trade frequency (number of trades per 5-minute interval in the 10:10am to noon period) between the pre- and post- event periods for any of the benchmarks .25
Univariate tests were also conducted to determine if there was a significant change in the overall dollar trading volume, as measured by MTRS, for Government of Canada bonds before and after the introduction of the electronic platforms. Table 3 presents the results of parametric and non-parametric tests for the pre-event (28 February 2002 to 26 June 2002) and post-pre-event (17 October 2002 to 28 February 2003) periods. The results show that the mean weekly total trading value in all Government of Canada securities is lower
25
Non-parametric tests, that do not rely on the assumptions that the variables are normally distibuted, were also conducted. The results are largely consistent with the parametric t-tests.
in the post-event period ($70,760.04 million) than the pre-event period ($77,184.09 million). The
difference, however, is not statistically significant as overall trading value for GoC bonds did not change significantly in the pre- and post periods.
Overall, these tests show that spreads decreased significantly for the 30-year benchmark (one percent level) and the 10-year benchmark (ten percent level) after the introduction of the electronic platforms. Trade volume as measured by the dollar value ($ millions) was significantly lower for the 10-year benchmark (five percent level) and the 5-year benchmark (ten percent level) after the introduction of the platforms. Trade volume as measured by the frequency of trades was not significantly different for any of the benchmarks. This seems to support some of the argume nts that increased transparency may reduce
transaction costs but at the expense of decreasing the dollar value traded. It is important, however, to note that the above univariate tests do not control for other factors that impact liquidity. Hence it is difficult to attribute these results to the change in transparency regime. The next section presents the results of the various multivariate regression models developed in this study.
5.3 Regression Results
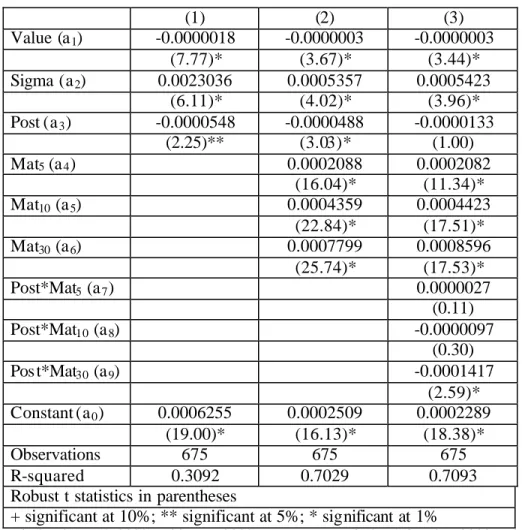
Table 4 provides the results for the regression equation (1.2). As the table shows the coefficient on the dummy is negative and significant at the 5% level (t = 2.25). This appears to suggest that even after controlling for macro-news, trade value , and price volatility, percentage bid-ask spreads are significantly lower in the post-event period. The table also shows that trade value and volatility are both significant variables as theory predicts. Higher value is associated with narrower spreads (negative coefficient) while an increase in volatility is ass ociated with wider spreads (positive coefficient).
However, results for the regression equation (1.4), also presented in Table 4, suggest that the above result of lower spreads in the post-event period is driven by the 30-year benchmark. To further verify this,
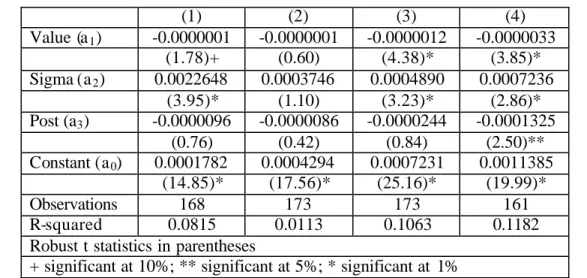
equations (1.5) to (1.8) are run. The results for these separate regressions for each benchmark are presented in Table 5 and confirm that spreads narrowed in the post-event period for the 30-year benchmark only while spreads are not significantly different in the pre- and post -event periods for any of the other benchmarks.
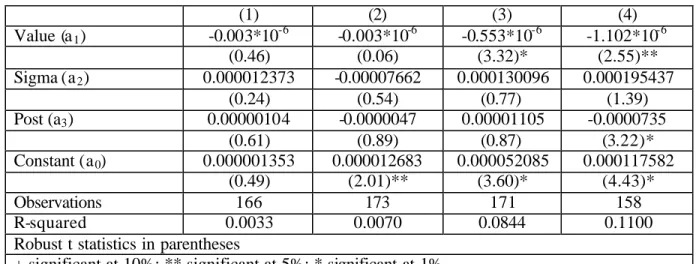
The above equations are re-run using the price-impact coefficient as the dependent variable instead of percentage quoted spread. The results, presented in Table 6 and 7, are consistent with the above regressions and suggest that the price impact coefficient, calculated using value as a measure of order flow, decreased in the post-event period for the 30-year benchmark but is not statistically different for any of the other benchmarks. However, the price-impact coefficient calculated using frequency as a measure of order flow is unchanged for all maturities.
6. Conclusions
The introduction of three electronic trading platforms in mid-2002 increased the level of pre-trade transparency for fixed income securities in Canada. This created a natural experiment providing the rare opportunity to study the impact of a changed transparency regime on liquidity. This paper uses detailed univariate tests and multivariate regression models to test the null hypothesis that liquidity for the brokered interdealer market remained unchanged before and after the introduction of the electronic platforms.
This paper uses the bid-ask spread and the price-impact coefficient to measure liquidity. The results of the regression models indicate statistically lower bid -ask spreads in the post-event period for the 30-year benchmark with spreads for the other benchmarks remaining unchanged, suggesting that increased transparency had a neutral to positive impact on liquidity.
It is important, however, to note several caveats before using the results to formulate policy. Firstly, the three systems were introduced at about the same time and hence it is not possible to isolate the impact of each system separately. Therefore, in this study, we assume that a single event brought about the change in transparency. As with all studies in the finance literature that investigate the impact of single events, it is statistically difficult to attribute the changes in liquidity to the single transparency-shifting event.
Furthermore, even though efforts are made to control other factors, it is not possible to control all other factors that may also influence liquidity. This problem is further magnified since the event is assumed t o occur over a three month period. It is also particularly difficult to control factors that may be specific to a particular benchmark. Hence, it is plausible that a factor other than the changed transparency regime may have resulted in lowering the bid-ask spreads and price-impact coefficient for the 30-year benchmark. There are several factors that are specific to the 30-year benchmark and may be driving the results. One
example is the increased demand for the 30-year benchmark in recent years from institutional investors, particularly pension funds, seeking to achieve cash-flow matching of their liabilities.26
It should also be noted that the actual benchmark bond issued over the sample period changed for all sectors except for the 30-year benchmark during the event period. For example, the 5-year benchmark was the Sep 06 (5.75%) from 25 February 2002 until the auction on 14 August 2002 when the September 07 (4.75%) became the benchmark. Thus the pre- and post-periods use different bonds as benchmarks. We believe that this is not a major limitation since the post-period used starts in October giving the marketplace ample time to adjust to the benchmark change. We, therefore, assume that the bonds in the pre- and post-event period behave in a similar fashio n.
In addition and more importantly, this paper is analyzing the impact of a change in the dealer-to-customer market on the inter -dealer market. Even though the two markets are linked, as discussed in an earlier section, the test would have been much stronger if it was possible to test the effect of the change in transparency in the dealer-to-customer market itself on the dealer-to-customer market.27 It should also be noted that this paper examines the impact of a change in pre-trade transparency brought a bout by market innovation whereas the recent policy debates are more focused on the effect of post-trade transparency mandated by regulation.
26
Another may be the existence of futures markets for shorter maturity sectors. It has been argued that price formation for government bonds is driven by the associated futures markets (Financial Services Authority, 2006). Since fu tures markets are very transparent, it can be argued that due to arbitrage relations cash securites that have a related futures market will be exposed to some indirect transparency even before a change in transparency regime and any additional direct increase in transparency may not have any significant impact on the liquidity for these sectors. On the other hand, cash securities that do not have an associated futures market are more opaque and the direct incremental increase in transparency may have a significant impact on the liquidity for these securities. In Canada, there is no futures contract for the 30-year sector. For lower maturity contracts, there was an active market for the 10-year Government of Canada futures contract (CGB) during the sample per iod for this paper. The 2-year Government of Canada futures contract (CGZ) was launched after the sample period but there was an active market for 3-month Canadian Bankers’ Acceptance futures contracts (BAX). Bankers’ Acceptances (BAs) are short -term money market instruments with the payment of principal and interest guaranteed by one of Canada’s major banks. It is possible to trade a strip of consecutive 3-month BAX futures contracts maturing in successively deferred months in combination with a position in the 2-year GoC benchmark. However, it should be noted that BAX contracts maturing many months in the future may not be very actively traded.
27
References
Andersen, Jens Verner, and Per Plougmand Baertelsen, 2004, Liquidity and transparency in the Danish government bond market, Monetary Review, Danmarks Nationalbank, 2nd Quarter.
Bessembinder, Hendrik, William Maxwell, and Kumar Venkataraman, 2005, Optimal market transparency: evidence from the initiation of trade reporting in corporate bonds, Journal of Financial Economics,
forthcoming.
Bjonnes, Geir Hoidal, and Dagfinn Rime, 2005, Dealer behavior and trading systems in foreign exchange markets, Journal of Financial Economics 75, 571-605.
Black, Fischer, 1971, Toward a fully automated stock exchange, Part 1, Financial Analysts Journal, 27, 28-35,44.
Bloomfield, Robert, and Maureen O’Hara, 1999, Market transparency: Who wins and who loses?, The Review of Financial Studies 12, 5-35.
Boehmer, Ekkehart, Gideon Saar, and Lei Yu, 2005, Lifting the veil: An analysis of pre-trade transparency at the NYSE, The Journal of Finance 60, 783-815.
BondWeek, 2005, High-yield players hit by downside of TRACE.
Brandt, Michael, and Kenneth Kavajecz, 2004, Price discovery in the U.S. treasury market: The impact of orde rflow and liquidity on the yield curve, The Journal of Finance 59, 2623-2654.
Casey, Jean-Pierre, and Karel Lannoo, 2005, Europe’s hidden capital markets: Evolution, architecture and regulation of the European bond market, Centre for European Policy Studies, 1-129.
Committee on the Global Financial System, 1999, Market liquidity: research findings and selected policy implications, Bank for International Settlements, 1-56.
Davidson, Russell, and James MacKinnon, 2004, Econometric Theory and Methods, Oxford University Press.
Department of Finance Canada, 2005, Debt management strategy 2005-2006.
D’Souza, Chris, Charles Gaa, and Jing Yang, 2003, An empirical analysis of liquidity and order flow in the brokered interdealer market for Government of Canada bonds, Bank of Canada Working Paper 2003-28. D’Souza, Chris, and Charles Gaa, 2004, The effect of economic news on bond market liquidity, Bank of Canada Working Paper 2004-16.
Edwards, Amy, Lawrence Harris, and Michael Piwowar, 2005, Corporate bond market transparency and transaction costs, working paper.