September 2, 2005
Working Paper
Economics DepartmentMonetary policy predictability in the euro area: An international comparison
by
ISSN 0801-2504 (printed) 1502-8143 (online)
ISBN 82-7553-312-0 (printed), 82-7553-313-9 (online)
Working papers from Norges Bank can be ordered by e-mail: [email protected]
or from Norges Bank, Subscription service, P.O.Box. 1179 Sentrum
N-0107Oslo, Norway.
Tel. +47 22 31 63 83, Fax. +47 22 41 31 05
Working papers from 1999 onwards are available as pdf-files on the bank’s web site: www.norges-bank.no, under “Publications”.
Norges Bank’s working papers present research projects and reports (not usually in their final form) and are intended inter alia to enable the author to benefit from the comments of colleagues and other interested parties.
Views and conclusions expressed in working papers are the responsibility of the authors alone.
0107 Oslo
Telefon 22 31 63 83, Telefaks 22 41 31 05
Fra 1999 og senere er publikasjonene tilgjengelige som pdf-filer på www.norges-bank.no, under “Publikasjoner”.
Working papers inneholder forskningsarbeider og utredninger som vanligvis
ikke har fått sin endelige form. Hensikten er blant annet at forfatteren kan motta kommentarer fra kolleger og andre interesserte.
Synspunkter og konklusjoner i arbeidene står for forfatternes regning.
INTERNATIONAL COMPARISON
by Bjørn-Roger Wilhelmsen* and Andrea Zaghini**
Abstract
The paper evaluates the ability of market participants to anticipate monetary policy decisions in the euro area and in 13 other countries. First, by looking at the magnitude and the volatility of the changes in the money market rates we show that the days of policy meetings are special days for financial markets. Second, we find that the predictability of the ECB’s monetary policy is fully comparable (and sometimes slightly better) to that of the FED and the Bank of England. Finally, an econometric analysis of the ability of market participants to incorporate in the current money rates the expected changes in the key policy rate shows that in the euro area policy decisions are anticipated well in advance.
Key words: Monetary policy, Predictability, Money market rates JEL Classification: E4, E5, G1
Contents
1. Introduction... 1
2. Are policy meetings’ days different days? ... 3
3. Predictability around policy decisions... 6
3.1 The Hit-Rate ... 6
3.2 The money market adjustment ... 11
4. Market anticipation and pass-through of monetary policy ... 13
5. Conclusion ... 16
Appendix ... 19
References ... 23
* Norges Bank – Bankplassen 2, 0107 Oslo. Tel +47-22-316744; Fax +47-22-316050; E-mail:
** Banca d’Italia, Servizio Studi – Via Nazionale 91, 00184 Roma. Tel 47922994; Fax
+39-06-47923178; E-mail: [email protected]. We would like to thank Tom Bernhardsen, Nuno Cassola, Francesco Drudi, Hans-Joachim Klöckers, Michele Manna, Wolfgang Modery, Marcello Pericoli, Jorge Sicilia, an anonymous referee and participants to the XIII Tor Vergata Conference on Banking and Finance for very helpful suggestions and discussions. The paper does not necessarily reflect the views of the Banca d'Italia and the Norges Bank.
possible, but that its action is predictable” (Woodford 2003).
1.Introduction
The modern monetary policy literature has stressed the importance of a clear understanding of Central Bank’s actions by financial markets in the formation of expectations about future interest rates developments. This is so because correct expectations help the Central Bank in its conduct of the monetary policy. While Central Banks only control short-term interest rates, theory and empirical evidence indicate that longer-term interest rates and arbitrage conditions in financial markets matter the most for the transmission of monetary policy impulses to the economy. Longer-term interest rates, in turn, reflect expectations of future short-term rates and the credibility of the Central Bank. Hence, successful monetary policy is to a large extent a matter of shaping market expectations about the way in which short-term rates are likely to evolve not only in the period leading to the next policy decision but also later on.
Market participants’ ability to predict future monetary policy decisions is often viewed as a direct consequence of the Central Bank’s transparency. A transparent overall monetary policy framework is therefore seen as highly desirable. This has come to be widely accepted by Central Bankers over the past decade. It is also acknowledged that a credible and predictable Central Bank can achieve its objective with smoother interest rate movements and at lower interest rate levels than a Central Bank with lower credibility.1
In this paper we would ideally like to evaluate the degree of financial markets understanding of the conduct of monetary policy (i.e. the Central Bank predictability) by investigating the extent to which market expectations of the future development in the key policy rates are in line with the view of Central Banks at every point in time. This is,
1 Since the effectiveness of the monetary transmission mechanism depends heavily on the ability of
monetary policy to affect the course of interest rates through financial market expectations, it is often argued that monetary policy should induce “rule like” behaviors on the part of market participants (see for instance Issing, 1999). This leads them to react to new developments in a manner consistent with the monetary policy strategy, thus aiding the smooth conduct of the monetary policy.
however, hard to test. What can instead be done is to assess whether Central Banks had been predictable in the past, which is exactly the aim of the paper.
The economic literature has proposed several ways to measure the predictability of Central Banks, ranging from survey and case-study approaches to statistical/econometric techniques (sometimes model-based) analyzing the development in the money market interest rates. However, given that perfect predictability may not be attainable, it should not be taken as the benchmark. In this respect, a cross country comparison offers a number of advantages, including the possibility to examine the Central Bank’s predictability across countries (and currency unions) with distinctive monetary policy frameworks and communication strategies. Trying to take advantage of this possibility, although the focus of the paper is on the performance of the ECB relative to that of the FED and the Bank of England, we examine the ability of financial markets to correctly anticipate policy announcements in 14 Central Banks -- from both industrialized and emerging market economies -- over the past 5 years using the changes in 1-, 3- and 12-month money market rates on the days of monetary policy meetings.
The heterogeneous sample we consider in this paper requires rather direct measures of predictability that can easily be applied to all the countries. The examination covers four different methodologies. In Section 2 we employ a preliminary analysis of both the volatility and the magnitude of the changes in the money market rates in the days of policy meetings. This analysis provides a straightforward and intuitive response to the hypothesis that monetary policy meetings are special days for financial markets. Section 3 proposes two different measures of predictability based on the money market behavior in the days of policy meetings. First, we calculate the movements in financial markets rates relative to a given benchmark that divides the monetary policy announcements into “correctly anticipated” and “surprises”. This part involves an investigation of the robustness of the results against different benchmarks, which is the strength of the approach. Second, we estimate the financial markets reaction to monetary policy moves. This analysis enables us to quantify the average response by financial markets to the change in the Central Banks’ policy rates. In addition, in Section 4 we estimate the statistical lead and lag properties of the policy rates with respect to financial markets rates. This enables us to investigate how much
in advance market participants are able to incorporate in the current money rates the expected changes in the key policy rate. Section 5 concludes.
2. Are policy meetings’ days different days?
In the paper we use data from 13 countries and 1 currency union: Australia, Canada, the Czech Republic, the euro area, Hungary, New Zealand, Norway, Poland, South Africa, Sweden, Switzerland, Thailand, the United Kingdom and the United States. The motivation behind the choice of sample must be seen as balancing the desire to investigate predictability in a relatively large set of Central Banks against the availability of adequate financial instruments to measure predictability.2 The sample period starts at the beginning of 1999, when the single monetary policy of the ECB began, and ends in April 2004..
Recently, several papers have investigated how well markets are able to anticipate the monetary policy by the Fed (Krueger and Kuttner; 1996, Poole and Rasche; 2000, Kuttner; 2001, Demiralp and Jordà; 2004) and the ECB (Gaspar et al.; 2001, Perez-Quiros and Sicilia; 2002, Ross; 2002, Bernoth and von Hagen; 2004), while Bernhardsen and Kloster (2002) and Coppel and Connolly (2003) provided a cross-country comparison of some OECD economies. The main finding of this literature is that market participants in industrialized countries are nowadays better able to anticipate monetary policy decisions than in the 1980s or early 1990s. It seems plausible to assume that the improvement in predictability is at least in part related to the increased public availability of information about the monetary policy strategy and how decisions are taken. Previously, secrecy was the byword in central banking. Now, this habit has changed and there has been a clear progress towards increasing openness and transparency during the last decade.
However, previous research reveals that there is a variety of different techniques available to model predictability. Given the large cross section dimension of our sample, a simple framework, which can be easily applied to all countries, would be highly desirable. A
2 Data for the correct financial instruments were not readily available for several countries that otherwise
would have been included in the study, such as Brazil, Chile, Mexico and South Korea. Also note that we have omitted Japan from the analysis, because strong deflationary pressure during the past 10 years has forced the Bank of Japan to keep nominal interest rates close to the zero lower bound level since 1995.
first intuitive approach to measure the extent to which market participants are surprised by a monetary policy decision is to compute the change in money market interest rates on the days of the policy meetings. That is, the value:
1 − − = t t t i i δ ,
where it is the market interest rate on the day of the meeting (using close of day data). The rationale behind using δ as a measure of monetary policy predictability is as simple as the following: the higher the degree to which the market anticipates the policy decision, the more muted the response in the short-term interest rates on the day of the announcement. Thus, not only the magnitude but also the standard deviation of the changes in the market interest rates to policy decisions can be compared among Central Banks. In fact, when a policy decision is correctly foreseen also the market volatility should not be influenced by the announcement.3
Which financial instrument should be used to measure the market response to policy announcements? In the literature a wide range of market instruments has been used to extract this information.4 Every interest rate has its own advantages and disadvantages. In particular, the existence of several sources of bias, as term premia and differences in the liquidity, complicates the extraction of a “pure measure” of predictability, especially for very short-term rates. Furthermore, the availability of market instruments varies substantially across countries. In this paper, we calculate the market responses to the monetary policy decisions using daily money market rates at 1-, 3- and 12-month maturity. These rates were readily available for all the countries in the sample.5
3 While the analysis of short-term rates is mostly used in the literature, other approaches are also employed
to assess the predictability of Central Banks. For instance, Sager and Taylor (2004) analyze the news effect of monetary policy disclosure by the ECB on the foreign exchange market, while Bomfim (2003) looks at the influence of FED announcements on the US stock market.
4 See, for instance, Perez-Quiros and Sicilia (2002) for a discussion about the different instruments that can
be employed for the euro area and Cochrane and Piazzesi (2002) for an investigation on the relevance of the interest rate maturity for the relationship between FED funds target rates and market interest rates in the US.
5 An alternative option would have been to consider intra-day data. However, such data were not available
for the majority of the countries considered in this paper. In a separate Annex we report the details about each country data.
Table A1 (in the Appendix) shows the standard deviation of the daily changes in the money market rates on the days when monetary policy meetings took place, between January 1999 and April 2004. The table also reports the standard deviation of all daily changes and distinguishes between announcements of decisions to alter the key interest rate and “no change” announcements.
Looking at the volatility in the 1-month market rates on the policy meeting days, it is possible to detect a strong heterogeneity across the 14 countries. However, a standard F-test shows that for each country, with the exception of Thailand in the 1-month market and Poland in the 12-month market, the null hypothesis of identical variances between “normal” days and days of policy meetings can be rejected at the 5% level of significance. This result suggests that even in the more mature economies of the sample the volatility in the money market on the days of policy meetings is larger than usual.6In addition, the market volatility around days of meetings seems to depend on the policy decision. The standard deviation of the changes in the money market rates when a modification in the official policy rate is decided is significantly larger than when the monetary policy authority does not change the official rate.7
A second, more direct, way of investigating whether the market behavior is different in meetings’ days is to run a regression of the (absolute) changes in the money rates on a time dummy accounting for monetary policy meetings:
(1) δjt =cj+θjDjt+εjt j=1,...14;
where cj is a constant and Djt is a dummy variable which takes the value of 1 in policy
meetings’ days and 0 elsewhere, for each country j.
It turns out that the dummy’s coefficient θ is always strongly significant all through the sample, thus supporting the idea that the days in which the board of the monetary policy authority meets are special days for financial markets also as concern the magnitude of the interest rate changes.
6 For the euro area, this result is consistent with the findings in Bernoth and von Hagen (2004), in which the
authors analyse the Euribor future rates.
3. Predictability around policy decisions
3.1 The Hit-Rate
A first measure of Central Banks’ predictability is here constructed by comparing the changes in the money market in the days of policy meetings to a benchmark. Changes in excess of the benchmark would signal a “surprise” and thus the failure of the market in anticipating the Central Bank behavior. The “hit rate” is computed as the number of times (in per cent) the market was able to correctly anticipate the monetary policy announcement.8
In order to set the benchmark, and thus to identify a surprise, we use two different measures: a) two times the standard deviation of all daily changes (regardless whether there was a policy meeting or not) and b) 12.5 basis points. Formally, for all countries, a monetary policy surprise is defined as:
(a) δk = ik −ik−1 >2σδ and/or
(b) δk = ik −ik−1 >0.0125
where k refers to the day of the selected meeting and σδ is the standard deviation of the change in interest rates on all days of the sample.
Measure a) compares market rate changes around monetary policy meetings with the general behavior of the market. A change outside the selected “confidence bands” of two times the standard deviation is considered a significant deviation from the “normal” market rate volatility, thus we say that the market has been surprised by the Central Bank. Measure b), instead, is consistent with the idea that a standard monetary policy action is an increase or a decrease of minimum 25 basis points in the policy rate. Thus, a change of more than 12.5 basis points -- 50% of the overall change -- in the market rates on the day of a monetary policy meeting suggests that market participants were surprised by the policy
8 The use of the hit rate is common in the literature on monetary policy predictability: see for instance
announcement.9 It should also be kept in mind that the hit rate does not focus exclusively on the markets reactions to changes in policy rates. Obviously, a surprising decision to leave policy rates unchanged may also bring about large adjustments in financial markets rates. Moreover, financial markets may also react to changes in the communication of the policy decisions, such as changes in the balance of risk statement or perceived changes in the tone made in the press release or at the press conference.
Figure 1
Monetary policy and market interest rates in the euro area
0 1 2 3 4 5 6
jan-99 may-99 oct-99 feb-00 jul-00 nov-00 mar-01 aug-01 dic-01 may-02 sep-02 feb-03 jun-03 nov-03 mar-04
1-month money market rate and the rate on the main refinancing operations. Suprises defined according to the 12.5 basis points criterion.
Figures 1 to 3 depict the key interest rates of the ECB, the FED and the Bank of England and the development in the 1-month money market rates in each country.10 The
9 Note that in the case of Hungary, Poland, South Africa and Thailand, where interest rate volatility is
relatively high, the 12.5 b.p. benchmark turns out to be the strictest criterion, while the opposite is true for the rest of the panel.
10 Hartmann et al. (2001) and Ewerhart et al. (2004) are extensive analyses of the microstructure of the euro
area money market, while broad analyses of the functioning of the interbank money market in the US are provided by Bartolini et al. (2002) and Demiralp and Farley (2005), while in the attempt of modelling the daily behaviour of the FED funds rate, Sarno et al. (2005) have analysed the forecasting properties of several econometric specifications. In addition, Ehrmann and Fratzscher (2003) provide a study of the interdependence between announcements of policy changes in the US and euro area. For the UK see Haldane and Read (2000) and Clare and Courtenay (2001).
white circles represent the meetings of the ECB’s Governing Council, the FED’s Federal Open Market Committee and the Bank of England Monetary Policy Committee in which the policy announcement was correctly predicted by the market (using the 12.5 basis points criterion), while the black circles are those dates in which a surprise arose, regardless of whether the decision was to change or not the policy rate.
It is possible to see that for the euro area the black circles are “concentrated” in the first part of the graph only (Figure 1). In particular, the last surprise by the Governing Council is dated 17 September 2001: it seems that since then the ECB has significantly improved its predictability.11
Figure 2 0 1 2 3 4 5 6 7
jan-99 may-99 oct-99 feb-00 jul-00 nov-00 apr-01 aug-01 jan-02 may-02 oct-02 feb-03 jul-03 nov-03 apr-04
1-month money market rate and the target for the federal funds rate. Suprises defined according to the 12.5 basis points criterion.
Monetary policy and market interest rates in the United States
As for the FED, Figure 2 shows a particular feature of the US money market: the surprises in the 1-month rate concern only the days in which a change in the target for the federal funds rate was decided. All the announcements of a “no change” were correctly
11 The “surprise” dates here identified are exactly the same Perez-Quiroz and Sicilia (2002) detected
predicted. Finally, Figure 3 suggests that the financial markets in UK were more easily caught off guard when the MPC cut the official interest rate. It happened 6 times out of 13.12
Figure 3 2 3 4 5 6 7
jan-99 may-99 oct-99 feb-00 jul-00 nov-00 apr-01 aug-01 jan-02 may-02 oct-02 feb-03 jul-03 nov-03 apr-04
1-month money market rate and the official repo rate. Suprises defined according to the 12.5 basis points criterion.
Monetary policy and market interest rates in the United Kingdom
Table A2a and A2b (in the Appendix) report the hit rate for the 14 countries using the 1-, 3- and 12-month money market interest rates. The value of the hit rate is shown for both definitions of the benchmark. Furthermore, the tables distinguish between meetings in which the policy rate was changed and meetings in which the decision was not to change it. Before analyzing the data in detail, two general features might be noted. First, there is not a Central Bank which is the most predictable according to the two benchmarks and for all interest rate maturities. Second, confirming the results of the analysis of the volatility in Section 2, decisions of not changing the policy rate are generally better foreseen than decisions of changing the rate.
According to the ranking provided by the overall hit rate in the case of the 12.5 basis points criterion, the euro area has the best score: financial markets were able to correctly
predict the outcome of the ECB policy meeting 94 times out of 100. The US and Australia follow closely with a hit rate of 91%, while the Bank of England performs slightly worse than the ECB and the FED with a value of the index of 84%.
The predictability of a “no change” decision is almost perfect in the euro area, regardless of the market interest rate considered. Out of the 85 meetings in which the decision of the Governing Council was not to change the key interest rate, there were only two surprises as measured by the 1-month interest rate (and one surprise as measured by the 3-month and the 12-month rates).13 Only Switzerland has a record of 100% “no change” decisions detected in advance in all the three interest rate maturities. The US follows closely with only one surprise in the 12-month rates.14 However, both Switzerland and the US witnessed a much smaller number of meetings than the euro area over the period under analysis (24 and 45, respectively, vs. 100). Also the UK perform fairly well with a hit rate of 91%. As for lower degrees of predictability, a value of the index below 90% in at least one of the market rates is recorded in both industrialized countries (Canada, New Zealand and Norway) and emerging economies (Poland, South Africa and Thailand).
When considering the meetings in which a decision to change the policy rate has been made, the hit rate drops significantly. Focusing again on the 1-month rates and the 12.5 basis points definition, the hit rate ranges from 24% in South Africa to 85% in Canada. In the euro area 73% of the changes in the rate were correctly predicted by each market, i.e. 4 times out of 15 the market was surprised by the ECB’s decision to move the key rate. Comparing these results with those of other industrialized economies we can see that the euro area hit rate is above those from New Zealand, Norway, Sweden, Switzerland and UK (ranging from 42% to 70%) and below those from Australia, Canada and the US (from 79% to 85%).
The ranking of the industrialized countries is almost unchanged also according to the definition of the hit rate based on 2 times the standard deviation (Table A2b). However, as expected, the degree of predictability increases strongly in those countries in which the
13 This result is in line with the findings in Perez-Quiros and Sicilia (2002), which identify a hit rate of 94%
when the two-week EONIA swap money market is used over the shorter period from 1 January 1999 to 7 June 2002.
14 Predictability of 100% in at least one market is also recorded in Australia, Canada, the Czech Republic,
market volatility is larger (Hungary, Poland, South Africa and Thailand). As regards the general index, the euro area performs slightly better than the US and the UK (87% vs. 80% and 73%, respectively).
3.2 The money market adjustment
A second indicator of predictability is based on the estimated measure of the financial markets reaction to monetary policy moves. In particular, we regress the daily changes in the 1-month money market rate, Δijt for country j, on a constant, α, and the changes in the key policy rate, Δpjt:
(2) Δijt =αj +γjΔpjt +εjt.
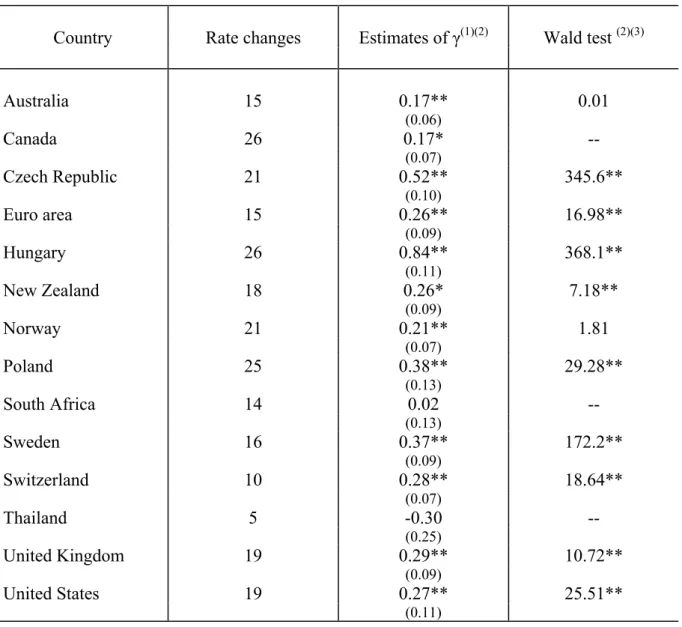
The estimated coefficients on the policy changes are presented in Table 1.15 The intuition behind this technique is analogous to the volatility/magnitude analysis performed in the previous sections. A low value of γ implies a small market response to the policy announcement, thus suggesting that the market was already pricing-in and thus anticipating the monetary policy decision. The main difference is that equation (2) focuses on anticipated changes in the policy rates and takes into account the differences in the average size of policy moves among Central Banks.
Except for South Africa and Thailand the γ-coefficient is of the expected sign and significant all through the sample.16 In particular, Australia and Canada show the lowest coefficients, while Hungary and then the Czech Republic the highest. This suggests that the market participants in Australia and Canada are able to predict the outcome of the Central Banks policy decisions relatively well, with a response on the days of the policy change of
15 As expected, the constant is not significantly different from zero in any country. In addition, because the
error term cannot be expected to be “white noise”, the Newey-West heteroskedasticity and autocorrelation-consistent standard errors of each coefficient are reported in the table.
16 In the case of South Africa the coefficient is not significantly different from zero, while for Thailand it is
not significant and negative, a result which is at odds with the theory. The reason is likely to be that the money market is not properly developed in these countries, as already suggested in the previous section by the large volatility recorded.
only 17% of the change in the key rate, while the opposite is true for the two Eastern European countries, responding by between 52% to 84% of the policy change.
Table 1
MARKET RESPONSE TO MONETARY POLICY MOVES
Country Rate changes Estimates of γ(1)(2) Wald test (2)(3)
Australia 15 0.17** 0.01 (0.06) Canada 26 0.17* -- (0.07) Czech Republic 21 0.52** 345.6** (0.10) Euro area 15 0.26** 16.98** (0.09) Hungary 26 0.84** 368.1** (0.11) New Zealand 18 0.26* 7.18** (0.09) Norway 21 0.21** 1.81 (0.07) Poland 25 0.38** 29.28** (0.13) South Africa 14 0.02 -- (0.13) Sweden 16 0.37** 172.2** (0.09) Switzerland 10 0.28** 18.64** (0.07) Thailand 5 -0.30 -- (0.25) United Kingdom 19 0.29** 10.72** (0.09) United States 19 0.27** 25.51** (0.11) (1) Newey-West standard errors in brackets; – (2) * and ** represent significance at 5% and
1%, respectively. – (3) Null hypothesis: γ for Canada equals γ for the rest of the countries.
Given the apparent large heterogeneity of the response to a monetary policy change we run a Wald test to check whether the differences in the γ coefficients are statistically significant across countries. In particular, we tested the null hypothesis that the value of γ for
Canada is the same in the rest of the countries. The null hypothesis was not rejected for Australia and Norway (at the 1% level of significance). Thus suggesting that together with Canada the latter two countries perform very well in anticipating the monetary policy decision of the Central Bank. For the rest of the panel, the coefficients are significantly different at the 5% level, hinting to a lower degree of predictability (see the last column of Table 1).
In order to “rank” the ECB, using the same test, we also investigated whether the coefficient for the euro area is statistically different from the one of the other countries. The null hypothesis of identical values cannot be rejected for Norway, New Zealand, US, UK and Switzerland at the 5% level, but is rejected for Australia and Canada (indicating that the ECB is less predictable) and for Sweden, Hungary, Poland and the Czech Republic (indicating that the ECB is more predictable). Thus the finding of a comparable degree of predictability among ECB, FED and Bank of England is again confirmed by equation (2).
4. Market anticipation and pass-through of monetary policy
In this section we propose an econometric analysis of the relationship between the key policy rate and the money market rates over a longer period before the Central Bank’s meetings, in order asses how much in advance the market is able to price-in the expected monetary policy decision.
The results from regression (2), as well as all the analysis so far, rely exclusively on the information from market rates on the day of the monetary policy authority meeting and the day before. This may be in some instances insufficient, because we do not know when the market started pricing-in a change in the key rate. In fact, one runs the risk of concluding that market participants are perfectly anticipating a change in the official rate in situations in which the expectations are adjusted in a discrete way only one or two days before the policy meeting. This might happen if Central Bank officials, for instance via speeches or public statements, provide the public with an obvious hint about what they intend to do at the forthcoming meeting.
A way to control for this problem is to examine how much of the actual change is already priced-in by financial markets over the two weeks before the policy announcement.
Following Coppel and Connolly (2003), we estimate the daily differences between the 1-month market interest rate ijt and the key policy rate pjt for country j as a function of a constant β0j, and the change in the key policy rate Δpjt, led by 1, 5 and 10 business days, and lagged by 5 business days:
(3) ijt − pjt = β0j +β1jΔpjt+1+β2jΔpjt+5 +β3jΔpjt+10+β4jΔpjt−5 +εjt.
The coefficients β1j, β2j and β3j can be interpreted as estimates of the degree to which
the market has already priced-in the policy change one day, one week and two weeks ahead of the meeting, respectively. A value of zero would indicate that changes in the rate were generally unexpected by the market at those dates. On the contrary, a large value of the coefficients would suggest that the market was able to correctly anticipate (well in advance) the decisions to change the key interest rates. However, while β1j can be directly taken as the
share of the policy change that was anticipated by market participants one day before the meeting, β2j and β3j should be interpreted more cautiously. In fact, the one month interest
rate reflects the expected average interest rate over the coming month and thus includes expectations of an unchanged key rate prior to the policy meeting and a different rate (lower or higher) afterwards. Finally, the coefficient β4j can be interpreted as a measure of the
pass-through of the key policy rate to market rates within a week after the move. A value close to zero would indicate that the changes in policy rates are fully passed-trough in the 1-month money market rates in 5 business days.
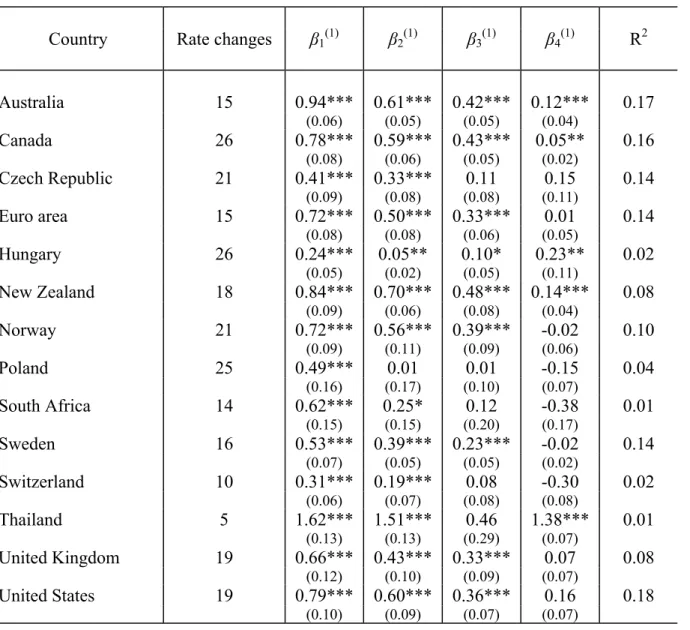
In Table 2 we report the estimated values of the coefficients from equation (3) and the Newey-West heteroskedasticity and autocorrelation-consistent standard errors for the whole set of countries under analysis. The standard tests suggest that while the 1-day anticipation coefficient is highly significant in each of the 14 countries, the 5-day coefficient is less significant in Hungary and South Africa (5% and 10%, respectively) and it is not significant in Poland. At the same time, the 10-day coefficient is only weakly or non-significant in all the emerging market economies and in Switzerland. Excluding the countries where at least one of the policy anticipation coefficients is not significant, the table show that β1j, β2j and β3j are relatively similar across the panel. They are the highest in Australia and Canada, and
policy meeting, i.e. β1j, > β2j > β3j, suggesting that the closer the meeting, the larger the
degree of pricing-in by the market.
Table 2
REGRESSION RESULTS
Country Rate changes β1(1) β2(1) β3(1) β4(1) R2
Australia 15 0.94*** 0.61*** 0.42*** 0.12*** 0.17 (0.06) (0.05) (0.05) (0.04) Canada 26 0.78*** 0.59*** 0.43*** 0.05** 0.16 (0.08) (0.06) (0.05) (0.02) Czech Republic 21 0.41*** 0.33*** 0.11 0.15 0.14 (0.09) (0.08) (0.08) (0.11) Euro area 15 0.72*** 0.50*** 0.33*** 0.01 0.14 (0.08) (0.08) (0.06) (0.05) Hungary 26 0.24*** 0.05** 0.10* 0.23** 0.02 (0.05) (0.02) (0.05) (0.11) New Zealand 18 0.84*** 0.70*** 0.48*** 0.14*** 0.08 (0.09) (0.06) (0.08) (0.04) Norway 21 0.72*** 0.56*** 0.39*** -0.02 0.10 (0.09) (0.11) (0.09) (0.06) Poland 25 0.49*** 0.01 0.01 -0.15 0.04 (0.16) (0.17) (0.10) (0.07) South Africa 14 0.62*** 0.25* 0.12 -0.38 0.01 (0.15) (0.15) (0.20) (0.17) Sweden 16 0.53*** 0.39*** 0.23*** -0.02 0.14 (0.07) (0.05) (0.05) (0.02) Switzerland 10 0.31*** 0.19*** 0.08 -0.30 0.02 (0.06) (0.07) (0.08) (0.08) Thailand 5 1.62*** 1.51*** 0.46 1.38*** 0.01 (0.13) (0.13) (0.29) (0.07) United Kingdom 19 0.66*** 0.43*** 0.33*** 0.07 0.08 (0.12) (0.10) (0.09) (0.07) United States 19 0.79*** 0.60*** 0.36*** 0.16 0.18 (0.10) (0.09) (0.07) (0.07)
(1) Newey-West standard errors in brackets; *, ** and *** represent significance at 10%, 5% and 1%, respectively. – (2) Null hypothesis: γ for Canada equals γ for the rest of the countries.
As for the lag-indicators, Table 2 suggests that while the policy moves have generally been fully passed-through within a week, there are some significant β4j coefficients. A
market participants started to price-in well in advance the policy decision of the following month.
Concluding, it can be stated, with all the caution that is needed when directly comparing regression coefficients, that the degree of policy moves anticipation in the euro area is around the average of industrialized economies and in line with Central Banks with a longer history such as the FED and the Bank of England.
5. Conclusion
Historically, for a variety of reasons, Central Banks have chosen different ways of communicating with the public and have relied on different instruments to be transparent. In addition, in the economic literature there are different views about the optimal degree of transparency. In some studies, like Eijffinger and Geraats (2002) and Gros (2002), transparency is identified with the amount and/or the degree of precision of information that Central Banks release to the public. According to other views, what is important, instead, is that the Central Bank provides the public with a clear explanation of the reasoning behind the decisions taken. It follows that openness, and thus the release of information, is desirable only to the extent to which it enhances the understanding of the Central Bank behavior.17
However, over the past decade, it has come to be widely accepted that transparency in monetary policy–making is highly desirable, since the effectiveness of monetary impulses improves when financial markets understand how the Central Bank conducts the monetary policy and why decisions are taken. In particular, better information by market participants about Central Bank actions and intentions increases the degree to which monetary authorities can actually affect market’s expectations about future changes in the official rate and thus about long-term interest rates. This paper has examined the predictability, i.e. the ability of financial markets in anticipating monetary policy decisions, of 14 different Central Banks with various monetary policy frameworks and different ways of communicating to the public.
As in any cross-country analysis, it should be born in mind that several caveats are associated with this kind of direct comparison. In particular, the properties of the financial instruments used to evaluate market expectations about future policy decisions may vary across countries. Different types of liquidity, term and risk premia may affect the findings obtained in the exercises performed in this study. Another factor, which is worth mentioning, is the evolution in the macroeconomic environment occurred in the period under review. A large part of the overall increase in predictability in some countries over the last decade has probably been due to a lower general level of interest rates, as inflation levels have fallen and greater macroeconomic stability has been achieved. This makes it difficult to isolate with precision the contribution of the increased transparency in Central Banks behavior in reducing the volatility in short-term rates. Finally, a third caveat concerns the span of our time sample, which, in order to include the euro area, is relatively short. However, even if the analysis of the money market dynamics started in January 1999, the number of policy meetings and interest rates changes were large enough for the standard statistical exercises to be performed.
Using money market rates at different maturities we reached two results. First, by comparing measures of the magnitude and the volatility of the changes in the money markets rates in the days of the policy meetings, we showed that the days in which policy decisions are taken are special days for financial markets. Second, according to two different measures of predictability and via an assessment of the ability of financial agents in incorporating well in advance the policy decisions into market rates, we showed that the overall predictability of the ECB is in line with that of our two “benchmarks”: the FED and the Bank of England.
Our findings fit well with other recent contributions, especially about the euro area. In fact our results are fully consistent with works employing somewhat different kinds of analysis and relying on different measures of predictability such as the studies by Perez-Quiros and Sicilia (2002), Ehrmann and Fratzscher (2003) and Bernoth and von Hagen (2004). In addition, also the international ranking of the ECB with respect to other Central Banks and in particular the comparison with the FED and the Bank of England is confirmed by several sources (Ross, 2002; Coppell and Connolly, 2003).
Future extensions of the work may point to assess whether some specific characteristics of the monetary policy and communication strategy of a Central Bank have
influence on its predictability. For instance, while all the countries in our sample have the price stability as central part of their policy objective, the ECB, the Swiss National Bank and the FED are the only Central Banks without a formal inflation target. A possible exercise could evaluate whether inflation target countries are more predictable than others. In addition, also other and modalities of the policy framework, like the publication of the minutes of the meetings and the voting record, may be assessed.
twelve-month). The sample starts on 4 January 1999, except for Hungary, South Africa and Thailand for which it starts in January 2000 and ends on 15 April 2004. Below we report for each country the exact money market interest rates considered and the source.
Australia: Money market rates: IPAUS. Source: Global Financial Database Canada: Money market rates: IPCAN. Source: Global Financial Database
Czech Republic: Money market rates: PRIBOR. Source: Global Financial Database Euro area: Money market rates: EURIBOR. Source: Global Financial Database Hungary: Money market rates: Interbank rates. Source: DataStream
New Zealand: Money market rates: Interbank rates. Source: DataStream Norway: Money market rates: OIBOR. Source: Global Financial Database Poland: Money market rates: Interbank rates. Source: DataStream
South Africa: Money market rates: Interbank rates. Source: DataStream Sweden: Money market rates: STIBOR. Source: Global Financial Database Switzerland: Money market rates: IBCHE. Source: Global Financial Database Thailand: Money market rates: IBTHA. Source: Global Financial Database UK: Money market rates: IBGBR. Source: Global Financial Database US: Money market rates: Interbank rates. Source: DataStream
Table A1
Meetings(1) Maturity All days All meetings Changes Non-changes
Australia 58 1-month 2.5 6.1 9.1 4.5 (26%) 3-month 3.1 5.6 8.6 3.6 12-month 4.5 6.3 8.6 4.9 Canada 35 1-month 2.3 9.7 10.8 6.0 (74%) 3-month 2.9 8.1 9.0 4.5 12-month 4.7 7.9 8.8 4.9
Czech Republic 68 1-month 3.7 13.1 16.7 0.9
(31%) 3-month 3.5 9.1 12.2 0.4
12-month 4.1 8.0 11.6 0.9
Euro area 100 1-month 2.6 6.8 15.4 3.4
(15%) 3-month 2.4 5.6 12.6 2.5
12-month 3.3 5.8 10.6 4.3
Hungary 37 1-month 20.1 72.9 88.8 3.9
(68%) 3-month 16.3 62.3 75.5 15.4
12-month 16.0 58.2 70.4 16.6
New Zealand 41 1-month 4.1 10.7 15.4 3.2
(44%) 3-month 4.0 11.3 16.0 4.4 12-month 4.6 12.4 15.7 8.7 Norway 48 1-month 6.2 16.5 21.3 9.5 (44%) 3-month 4.8 13.9 17.9 8.0 12-month 5.3 13.9 16.7 10.0 Poland 50 1-month 20.0 41.8 60.3 12.0 (50%) 3-month 15.4 31.2 43.7 12.3 12-month 19.1 22.5 30.1 13.1
South Africa 29 1-month 24.1 32.6 45.3 16.2
(48%) 3-month 14.4 25.1 34.5 11.1 12-month 14.6 25.8 35.3 11.9 Sweden 55 1-month 2.4 8.8 15.2 3.8 (29%) 3-month 2.6 7.4 12.5 3.3 12-month 3.5 6.7 10.0 4.6 Switzerland 24 1-month 3.8 12.4 16.6 2.1 (50%) 3-month 3.7 11.7 15.8 2.0 12-month 3.5 8.9 11.5 2.6 Thailand 34 1-month 17.1 14.5 27.2 10.3 (15%) 3-month 9.9 13.1 19.3 12.1 12-month 7.6 10.8 13.7 10.3
United Kingdom 64 1-month 3.2 8.4 12.2 5.3
(28%) 3-month 2.5 7.0 11.5 3.1
12-month 3.9 8.3 12.8 5.3
United States 45 1-month 2.9 12.3 18.3 0.9
(42%) 3-month 3.1 10.0 14.4 1.2
12-month 4.7 9.4 12.8 4.5
Sample: January 1999 - April 2004. (1) Percentage of changes in brackets.
(2) Standard deviation of the daily change in money market interest rates
Standard deviation in basis points (2)
Table A2a
Meetings(1) Maturity All meeting Changes Non-changes
Australia 58 1-month 91% 80% 95% (26%) 3-month 96% 87% 100% 12-month 91% 73% 98% Canada 35 1-month 86% 85% 89% (74%) 3-month 89% 89% 89% 12-month 86% 81% 100%
Czech Republic 68 1-month 76% 40% 98%
(31%) 3-month 84% 50% 100%
12-month 85% 60% 100%
Euro area 100 1-month 94% 73% 98%
(15%) 3-month 95% 73% 99%
12-month 95% 73% 99%
Hungary 37 1-month 49% 24% 100%
(68%) 3-month 49% 28% 92%
12-month 51% 32% 92%
New Zealand 41 1-month 84% 70% 96%
(44%) 3-month 84% 70% 96% 12-month 72% 60% 83% Norway 48 1-month 73% 62% 81% (44%) 3-month 75% 62% 85% 12-month 73% 57% 85% Poland 50 1-month 65% 50% 85% (50%) 3-month 76% 71% 88% 12-month 71% 63% 77%
South Africa 29 1-month 40% 21% 67%
(48%) 3-month 57% 36% 80% 12-month 60% 50% 80% Sweden 55 1-month 88% 63% 98% (29%) 3-month 96% 88% 100% 12-month 96% 88% 100% Switzerland 24 1-month 71% 42% 100% (50%) 3-month 71% 42% 100% 12-month 83% 67% 100% Thailand 34 1-month 80% 60% 83% (15%) 3-month 77% 40% 83% 12-month 89% 80% 90%
United Kingdom 64 1-month 84% 61% 93%
(28%) 3-month 89% 61% 100%
12-month 89% 72% 96%
United States 45 1-month 91% 79% 100%
(42%) 3-month 89% 74% 100%
12-month 87% 68% 98%
Sample: January 1999 - April 2004. (1) Percentage of changes in brackets.
Table A2b
Meetings(1) Maturity All meeting Changes Non-changes
Australia 58 1-month 71% 40% 81% (26%) 3-month 78% 40% 90% 12-month 86% 60% 95% Canada 35 1-month 77% 74% 89% (74%) 3-month 80% 78% 89% 12-month 80% 78% 89%
Czech Republic 68 1-month 68% 14% 93%
(31%) 3-month 78% 32% 100%
12-month 82% 50% 98%
Euro area 100 1-month 87% 47% 95%
(15%) 3-month 87% 47% 94%
12-month 89% 67% 93%
Hungary 37 1-month 73% 62% 100%
(68%) 3-month 70% 62% 92%
12-month 70% 62% 92%
New Zealand 41 1-month 79% 60% 96%
(44%) 3-month 79% 60% 96% 12-month 65% 50% 78% Norway 48 1-month 73% 62% 81% (44%) 3-month 73% 57% 85% 12-month 65% 52% 74% Poland 50 1-month 88% 77% 96% (50%) 3-month 90% 81% 96% 12-month 92% 86% 96%
South Africa 29 1-month 87% 71% 100%
(48%) 3-month 83% 64% 100% 12-month 83% 64% 100% Sweden 55 1-month 72% 38% 88% (29%) 3-month 75% 63% 83% 12-month 86% 88% 85% Switzerland 24 1-month 58% 17% 100% (50%) 3-month 67% 34% 100% 12-month 62% 25% 100% Thailand 34 1-month 91% 60% 97% (15%) 3-month 86% 40% 93% 12-month 94% 80% 97%
United Kingdom 64 1-month 73% 58% 80%
(28%) 3-month 78% 53% 89%
12-month 80% 68% 84%
United States 45 1-month 80% 53% 100%
(42%) 3-month 80% 53% 100%
12-month 82% 63% 94%
Sample: January 1999 - April 2004. (1) Percentage of changes in brackets.
Volatility of the Federal Funds Interest Rate”, Journal of Money, Credit, and Banking, Vol.34, No.1, pp.137-159.
Bernhardsen, T. and A. Kloster (2002), “Transparency and Predictability in Monetary Policy”, Economic Bulletin Q2, Norges Bank.
Bomfim, A.N. (2003), “Pre-announcement Effects, News Effects, and Volatility: Monetary Policy and the Stock Market”, Journal of Banking and Finance, Vol.27, pp.133-151.
Bernoth, K. and J. von Hagen (2004), “The Euribor Futures Market: Efficiency and the Impact of ECB Policy Announcements”, International Finance, Vol.7, No.1, pp-1-24.
Clare, A. and R. Courtenay (2001), “What can we Learn about Monetary Policy Transparency from Financial Market Data?”, Deutsche Bundesbank Discussion Paper No.5-2001.
Cochrane, J.H and M. Piazzesi (2002), “The FED and Interest Rates – A High-Frequency Identification”, AEA Papers and Proceedings, Vol. 92, No.2, pp.90-95.
Coppel, J. and E. Connolly (2003), “What Do Financial Market Data Tell us About Monetary Policy Transparency?”, Research Discussion Paper No.5, Reserve Bank of Australia.
Demiralp, S. and D. Farley (2005), “Declining Required Reserves, Funds Rate Volatility, and Open Market Operations”, Journal of Banking and Finance, Vol.29, No.5, pp.1131-1152.
Demiralp, S. and O. Jordà (2004), “The Response of Term Rates to FED Announcements”, Journal of Money, Credit, and Banking, Vol.36, No.3, pp.387-405.
Ehrmann, M. and M. Fratzscher (2003), “Monetary Policy Announcements and Money Markets: a Transatlantic Perspective”, International Finance, Vol.6, No.3, pp.309-328.
Eijffinger, S.C.W. and P. Geraats (2002), “How Transparent are Central Banks?” CEPR Discussion Paper No.3188.
Ewerhart, C., N. Cassola, S. Ejerskov and N. Valla (2004), “Liquidity, Information, and the Overnight Rate”, Working Paper No.378, European Central Bank.
Gaspar, V., G. Perez-Quiros and J. Sicilia (2001), “The ECB monetary policy strategy and the money market”, International Journal of Finance and Economics, Vol.6, pp.325-242
Gros, D. (2002), (ed.) Fiscal and Monetary Policy for a Low-Speed Europe, CEPS, Brussels.
Haldane A.G. and V. Read (2000), “Monetary Policy Surprises and the Yield Curve” Bank of England Working Paper No.106.
Hartmann, P., M. Manna and A. Manzanares (2001), “The microstructure of the euro money market”,Journal of International Money and Finance, Vol.20 No.6, pp.895-948.
Issing, O. (1999), “The Eurosystem: Transparent and Accountable or ‘Willem in Euroland?’”, Journal of Common Market Studies, Vol. 37, No.3, pp.503-519.
Issing, O. (2004). Kommunikation, Transparenz, Rechenschaft - Geldpolitik im 21. Jahrhundert, Thünen Lecture at the Annual Conference of the Verein für Socialpolitik, 29 September 2004, Dresden, available at www.ecb.int.
Krueger, J. and K. Kuttner (1996), “The Fed Funds Futures Rates as a Predictor of Federal Reserve Policy”, Journal of Futures Markets, Vol.16, No.8, pp.865-879
Kuttner, K. (2001), “Monetary Policy Surprises and Interest Rates: Evidence from the Fed Funds Future Market”, Journal of Monetary Economics, Vol. 47, No.3, pp.523-44.
Perez-Quiros, G. and J. Sicilia (2002), “Is the European Central Bank (and the United States Federal Reserve) Predictable?”, Working Paper No.192, European Central Bank.
Poole, W. and R.H. Rasche (2000), “Perfecting the Market’s Knowledge of Monetary Policy”, Journal of Financial Services Research, Vol. 18 No.2/3, pp.255-298
Ross, K. (2002), “Market Predictability of ECB Monetary Policy: a Comparative Examinations”, IMF Working Paper No.233.
Sager, M.J. and M.P. Taylor (2004), “The Impact of European Central Bank Governing Council Announcements on the Foreign Exchange Market: a Microstructural Approach”, Journal of International Money and Finance, Vol.23, pp.1043-1051.
Sarno, L., D.L. Thornton and G. Valente (2005), “Federal Funds Rate Prediction”, CEPR Discussion Paper No. 4587, forthcoming in Journal of Money Credit ad Banking.
Thornton, D.L. (2003), “Monetary Policy Transparency: Transparency About What?”, The Manchester School, , Vol.71, No.5, pp. 478-497.
Winkler, B. (2002), “Which Kind of Transparency? On the need for clarity in Monetary Policy-making”, Working Paper No.26, European Central Bank.
Woodford, M. (2003), Interest and Prices: Foundation of a Theory of Monetary Policy, Princeton University Press.
Working Papers were previously issued as Arbeidsnotater from Norges Bank, see Norges Bank’s website http://www.norges-bank.no
2002/1 Bache, Ida Wolden
Empirical Modelling of Norwegian Import Prices Research Department, 44 p 2002/2 Bårdsen, Gunnar og Ragnar Nymoen
Rente og inflasjon Forskningsavdelingen, 24 s
2002/3 Rakkestad, Ketil Johan
Estimering av indikatorer for volatilitet Avd. for verdipapirer og internasjonal finans, 33 s 2002/4 Akram, Qaisar Farooq
PPP in the medium run despite oil shocks: The case of Norway Research Department, 34 p 2002/5 Bårdsen, Gunnar, Eilev S. Jansen and Ragnar Nymoen
Testing the New Keynesian Phillips curve Research Department, 38 p 2002/6 Lindquist, Kjersti-Gro
The Effect of New Technology in Payment Services on Banks’ Intermediation
Research Department, 28 p 2002/7 Sparrman, Victoria
Kan pengepolitikken påvirke koordineringsgraden i lønnsdannelsen? En empirisk analyse Forskningsavdelingen, 44 s 2002/8 Holden, Steinar
The costs of price stability - downward nominal wage rigidity in Europe
Research Department, 43 p 2002/9 Leitemo, Kai and Ingunn Lønning
Simple Monetary Policymaking without the Output Gap Research Department, 29 p 2002/10 Leitemo, Kai
Inflation Targeting Rules: History-Dependent or Forward-Looking? Research Department, 12 p 2002/11 Claussen, Carl Andreas
Persistent inefficient redistribution International Department, 19 p 2002/12 Næs, Randi and Johannes A. Skjeltorp
Equity Trading by Institutional Investors: Evidence on Order Submission Strategies
Research Department, 51 p 2002/13 Syrdal, Stig Arild
A Study of Implied Risk-Neutral Density Functions in the Norwegian Option Market
Securities Markets and International Finance Department, 104 p 2002/14 Holden, Steinar and John C. Driscoll
A Note on Inflation Persistence Research Department, 12 p 2002/15 Driscoll, John C. and Steinar Holden
Coordination, Fair Treatment and Inflation Persistence Research Department, 40 p 2003/1 Erlandsen, Solveig
Age structure effects and consumption in Norway, 1968(3) – 1998(4) Research Department, 27 p 2003/2 Bakke, Bjørn og Asbjørn Enge
Risiko i det norske betalingssystemet
Avdeling for finansiell infrastruktur og betalingssystemer, 15 s 2003/3 Matsen, Egil and Ragnar Torvik
Optimal Dutch Disease Research Department, 26 p
2003/4 Bache, Ida Wolden
Critical Realism and Econometrics Research Department, 18 p 2003/5 Humphrey, David B. and Bent Vale
Scale economies, bank mergers, and electronic payments: A spline function approach
Avdeling for finansiell analyse og struktur, 24 s 2003/7 Bjønnes, Geir H., Dagfinn Rime and Haakon O.Aa. Solheim
Volume and volatility in the FX market: Does it matter who you are? Research Department, 24 p 2003/8 Gresvik, Olaf and Grete Øwre
Costs and Income in the Norwegian Payment System 2001. An application of the Activity Based Costing framework Financial Infrastructure and Payment Systems Department, 51 p 2003/9 Næs, Randi and Johannes A.Skjeltorp
Volume Strategic Investor Behaviour and the Volume-Volatility Relation in Equity Markets Research Department, 43 p 2003/10 Bjønnes, Geir Høidal and Dagfinn Rime
Dealer Behavior and Trading Systems in Foreign Exchange Markets Research Department, 32 p 2003/11 Lindquist, Kjersti-Gro
Banks’ buffer capital: How important is risk Research Department, 31 p 2004/1 Sveen, Tommy and Lutz Weinke
Pitfalls in the Modelling of Forward-Looking Price Setting and Investment Decisions
Research Department, 27 p 2004/2 Andreeva, Olga
Aggregate bankruptcy probabilities and their role in explaining banks’ loan losses
Research Department, 44 p 2004/3 Sveen, Tommy and Lutz Weinke
New Perspectives on Capital and Sticky Prices Research Department, 23 p 2004/4 Bårdsen, Gunnar, Jurgen Doornik and Jan Tore Klovland
A European-type wage equation from an American-style labor market: Evidence from a panel of Norwegian manufacturing industries in the 1930s Research Department, 22 p 2004/5 Holden, Steinar and Fredrik Wulfsberg
Downward Nominal Wage Rigidity in Europe Research Department, 33 p 2004/6 Næs, Randi
Ownership Structure and Stock Market Liquidity Research Department, 50 p 2004/7 Skjeltorp, Johannes A. and Bernt-Arne Ødegaard
The ownership structure of repurchasing firms Research Department, 54 p 2004/8 Skjeltorp, Johannes A.
The market impact and timing of open market share repurchases in Norway
Research Department, 51 p 2004/9 Bowdler, Christopher and Eilev S. Jansen
Testing for a time-varying price-cost markup in the Euro area inflation process
Research Department, 19 p 2004/10 Eilev S. Jansen
Modelling inflation in the Euro Area Research Department, 49 p 2004/11 Claudia M. Buch, John C. Driscoll, and Charlotte Østergaard
Cross-Border Diversification in Bank Asset Portfolios Research Department, 39 p 2004/12 Tommy Sveen and Lutz Weinke
Firm-Specific Investment, Sticky Prices, and the Taylor Principle Research Department, 23 p 2004/13 Geir Høidal Bjønnes, Dagfinn Rime og Haakon O.Aa. Solheim
Liquidity provision in the overnight foreign exchange market Research Department, 33 p 2004/14 Steinar Holden
Wage formation under low inflation Research Department, 25 p 2004/15 Roger Hammersland
Large T and small N: A three-step approach to the identification of cointegrating relationships in time series models with a small cross-sectional dimension Research Department, 66 p
2004/17 Q. Farooq Akram
En effisient handlingsregel for bruk av petroleumsinntekter Forskningsavdelingen, 40 s 2004/18 Egil Matsen,Tommy Sveen and Ragnar Torvik
Savers, Spenders and Fiscal Policy in a Small Open Economy Research Department, 31 p 2004/19 Roger Hammersland
The degree of independence in European goods markets: An I(2) analysis of German and
Norwegian trade data Research Department, 45 p
2004/20 Roger Hammersland
Who was in the driving seat in Europe during the nineties, International financial markets or
the BUBA? Research Department, 35 p
2004/21 Øyvind Eitrheim and Solveig K. Erlandsen
House prices in Norway 1819–1989 Research Department, 35 p 2004/22 Solveig Erlandsen and Ragnar Nymoen
Consumption and population age structure Research Department, 22 p 2005/1 Q. Farooq Akram
Efficient consumption of revenues from natural resources –
An application to Norwegian petroleum revenues Research Department, 33 p 2005/2 Q. Farooq Akram, Øyvind Eitrheim and Lucio Sarno
Non-linear dynamics in output, real exchange rates and real money balances: Norway,
1830-2003 Research Department, 53 p
2005/3 Carl Andreas Claussen and Øistein Røisland
Collective economic decisions and the discursive dilemma Monetary Policy Department, 21 p 2005/4 Øistein Røisland
Inflation inertia and the optimal hybrid inflation/price level target
Monetary Policy Department, 8 p 2005/5 Ragna Alstadheim
Is the price level in Norway determined by fiscal policy? Research Department, 21 p 2005/6 Tommy Sveen and Lutz Weinke
Is lumpy investment really irrelevant for the business cycle? Research Department, 26 p 2005/7 Bjørn-Roger Wilhelmsen and Andrea Zaghini
Monetary policy predictability in the euro area: An international comparison
ilhelmsen and Andrea Zaghini: Monetar
y policy predictability in the euro area: An international comparison
W orking P aper 2005/7 KEYWORDS: Monetary policy Predictability Money market rates