A Meeting Detector and its Applications
Jue Wang, Guanling Chen, and David Kotz
Department of Computer Science, Dartmouth College
Hanover, NH, USA 03755
Dartmouth Computer Science Technical Report TR2004-486
Abstract
In this paper we present a context-sensing component that recognizes meetings in a typical office environment. Our prototype detects the meeting start and end by combining outputs from pressure and motion sensors installed on the chairs. We developed a telephone controller application that transfers incoming calls to voice-mail when the user is in a meeting. Our experiments show that it is feasible to detect high-level context changes with “good enough” accuracy, using low-cost, off-the-shelf hardware, and sim-ple algorithms without comsim-plex training. We also note the need for better metrics to measure context detection per-formance, other than just accuracy. We propose several metrics appropriate for our application in this paper. It may be useful, however, for the community to define a set of general metrics as a basis to compare different ap-proaches of context detection.
1
Introduction
Context-aware computing is a pervasive computing paradigm in which applications can discover and take ad-vantage of contextual information [2]. The goal is to make applications effective and adaptive to user’s infor-mation needs without consuming too much of a user’s at-tention. Context-aware applications need to classify or recognize the environment or user activities, and take dif-ferent actions for difdif-ferent situations. The challenge is to determine whether applications can make meaningful decisions without costly embedded sensors and complex algorithms.
We are interested in detecting meeting status in an of-fice environment, which we expect to be useful for two classes of applications: 1) applications that help the user to control devices in the room, such as programming the phone to send incoming calls to voice-mail, to use au-dio and video recorders to record the proceedings of a meeting or to control the projector, lights, microphone, or other devices in the meeting room; and 2) applications that help remote users to know which rooms have meet-ings in progress. For example, a room-scheduling service
can allow last-minute bookings based on real-time infor-mation about availability.
Detecting high-level context such as user meetings is a challenging problem. Although a user’s calendar may provide some hints, it is an unreliable source because many users fail to update her calendar consistently and promptly. Instead, we choose to detect meetings with embedded sensors. In this paper, we present the sensors we selected, the detection algorithm, and the performance evaluation of our prototype. We built a telephone con-troller that redirects all incoming calls to a pre-configured voice mailbox so that meetings will not be interrupted. The telephone controller makes a decision to switch to voice mail or not based on the output from our Meeting Detector.
We built the Meeting Detector with an in-house context-fusion platform, Solar, which is briefly discussed in Section 2. In Section 3 we present the system design and we give experimental results of the Meeting Detec-tor in Section 4. We discuss the practical advantages and limitations of our Meeting Detector in Section 5. Finally we discuss related work in Section 6 and conclude in Sec-tion 7.
2
Background
In this section, we briefly discuss some background in-formation about Solar, which is a middleware platform that provides a flexible and scalable context fusion in-frastructure. In Solar, sensors produce streams of events, which represent raw information about the environment, and applications aggregate and customize contextual in-formation from sensors by injecting data-fusion operators into Solar. An operator takes one or more event streams as input and produces another event stream. Since raw sensor events are often in the wrong format, are inaccu-rate, or are incomplete and not useful without combin-ing with other sensor inputs, sensor data typically needs to go through several processing steps before it becomes meaningful context desired by applications. Since many context-aware applications ask for the same or similar contextual information, such as a user’s location and
cur-rent activity, it is helpful to re-use overlapping context fu-sion functions or sub-functions among applications. So-lar’s approach is to decompose the context-fusion process of every application into a series of modular and re-usable operators, to encourage the reuse of both code classes and operator instances, and to allow applications to compose operators into a directed information flow graph, which we call an operator graph. More details about Solar can be found in a previous paper [1].
3
System design
Our goal is to detect the beginning and ending of a meet-ing, in near real time, without expecting every user that might attend a meeting to wear special hardware such as a location-tracking badge. We found that many regular building occupants refuse to wear a badge, and visitors in our open academic building of course never wear a badge. We designed the Meeting Detector to detect a meeting’s status by aggregating two kinds of sensors’ outputs. We first introduce the system architecture and hardware setup, and describe the operator graph in detail, then discuss the combination algorithm.
3.1
System architecture
The Meeting Detector is designed to detect a meeting in a user’s office. In the office there is a meeting area con-taining a table and some chairs. We added sensors to the chairs to detect the pressure of a seated person, and the motion of the chair caused by a seated person. To reduce cost, we use only one pressure mat (on the chair that is always occupied in meetings by the office resident). We also taped one motion sensor to each of four chairs around the table. Thus we have two data collection systems.
The pressure mat on the seat of one chair uses a wireless transmitter to communicate its status to a nearby receiver every 120 seconds. Software on the receiver computer sends each pressure reading into Solar as an event and logs these data automatically. We call this log the “pressure log.”
To detect chair motion status we used an existing com-mercial location system,1in which “personal badges”
pe-riodically send IR updates to ceiling-mounted sensors. These badges happen to have an embedded motion sensor, intended to conserve power when the badge is stationary. A badge update packet contains the status of the motion sensor so we can tell if the badge has recently moved. We monitor the ceiling detectors and translate badge packets into Solar events. The motion sensors can detect motion status changes immediately; the badge sends updates ev-ery 3.5 seconds when it is moving and evev-ery 2 minutes when it is stationary. All the motion data is logged at a server and we thus obtain a “motion log.”
1http://www.versustech.com/
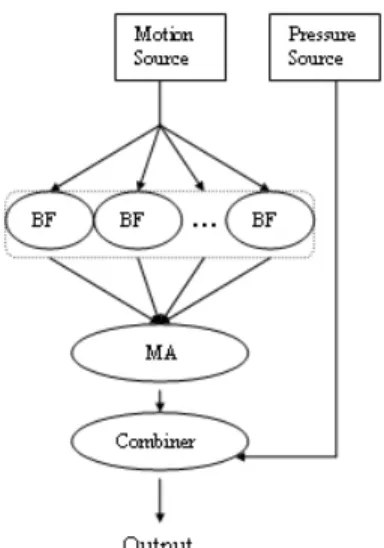
Figure 1: Operator graph structure in Meeting Detector. BF is Badge Filter and MA is Motion Aggregator.
3.2
Operator graph
Using these two kinds of sensor data, an operator graph running on Solar determines the meeting’s status. The op-erators filter the data from motion sensors and combine it with the data from pressure sensors. We describe the operator graph first and then the combination algorithm. The Meeting Detector is an operator graph, which mainly consists of two layers of filters and a combiner (see Fig-ure 1).
Before Solar can use raw data from sensors and other data collection devices, the data must be converted into attribute-value pairs within a Solar event. The Meeting Detector has two Solar sources, a motion source and a pressure source; each reads raw sensor data and uses the Solar API to “publish” an event object for each sensor reading. Events from the pressure source have two at-tributes indicating whether pressure is detected by the sensor and a timestamp. Events from the motion source contain a badge number, its motion state, and a times-tamp. Since the motion source collects the updates from all badges, even those on chairs in other offices or those not attached to chairs, we use the Badge Filter to pass on events only from the badges we used in the meeting room (each filter matches a particular badge number). The Motion Aggregator keeps an internal state about whether there is any movement of all chairs and publishes an event whenever this state changes.
3.3
Combination algorithm
The Combiner is the key to the operator graph in Meet-ing Detector. Its goal is to output an event whenever a meeting begins or ends. It receives simple events from the filters above, and internally records the most recent observed state: pmeans there is pressure on the mat and
¬pmeans no pressure;mmeans there is motion in some chair and¬mmeans no motion. Figure 2 shows how we combine the pressure and motion data to detect meeting start and end, using a state machine.
We have four states: NO, YES, MAYBE1 and
MAYBE2. NO means no meeting is in progress and YES means a meeting is in progress. Initially, we wait until there is pressure and motion at the same time before we decide that meeting starts. We declare the meeting over if there is neither pressure nor motion in the most recent readings. MAYBE1 and MAYBE2 mean the meeting may have ended but we hesitate to make a decision immedi-ately. These “hesitation” states deal with the intermittent reports of no pressure or no motion even when a meeting is in progress, because of unreliable sensor outputs. We use two thresholds to control transitions out from these hesitation states. TheT1is for the state that there is pres-sure but no motion andT2is for the state that there is mo-tion but no pressure. Heretis the time since the last state change. In MAYBE1 iftexceedsT1, or in MAYBE2 ift exceedsT2, we assume the meeting has ended despite one sensor indicating a meeting is in progress. These timeouts were necessary because sensors occasionally “stick”. We setT1 to 10 minutes because we found that the motion sensors often report a chair as stationary even when oc-cupied: people do not move in the meeting all the time. Thus,T1can reduce the reporting of false meeting ends. We setT2to 1 minute because our pressure mat had sev-eral unexplained 1-minute gaps even when the chair was occupied. ThusT2can avoid noting these gaps as a false meeting end.
Essentially, we decide that a meeting is in progress whenever both pressure and motion are detected (p&m). Because our sensors occasionally report intermittent lack of pressure or motion, the state machine hesitates to declare “no meeting” immediately when one is false (¬(p&m)), and we include two MAYBE states for the casesp&¬mand¬p&m. If thep&mcondition returns before a timer exceeds a threshold, the meeting continues in state YES. If too much time elapses, we declare the end of the meeting.
4
Evaluation
In this section, we report the performance of the Meeting Detector. For this study, we test the sensibility and ac-curacy of the Meeting Detector by matching the detected meeting records from the Meeting Detector and the real meeting records from a manual log of a several-week pe-riod of actual meetings.
4.1
Experimental methods
We tested Meeting Detector in a professor’s office with real meetings and real people during two periods in September 2003 and February 2004. To obtain the “ground truth” about actual meeting start and end times,
we implemented a simple Meeting Recorder, which we installed on a tablet placed on the meeting table. This application allows the professor to, with a single button, manually log every meeting’s start and end. This results in a “meeting log.” This log has some incorrect records due to some human mistakes (failing to record a meeting, or starting and ending late). We discard these incorrect data and the corresponding data in the “pressure log” and the “motion log.”
In total we have three log files: the “meeting log”, the “pressure log”, and the “motion log”. By matching the output of Meeting Detector (using pressure and motion logs as input) with the meeting log, we can measure how well the meeting detection works using three different de-tectors: 1) we used only pressure data to detect meetings, which is defined when the pressure mat reports true; 2) we used only motion data to detect meetings, that is, when at least one chair is in motion; and 3) we combined motion data and pressure data using the algorithm in Section 3.3. We compare the outputs of all three detectors with the real meeting log.
4.2
Experiment results
It was not immediately clear what might be an appropri-ate metric to measure how well and how quickly detection occurs. For a context classification component, we are in-terested in both its accuracy and sensitivity. We define several metrics to measure the matching accuracy com-prehensively, as shown below and illustrated in Figure 3.
1. ∆t start, the difference between real meeting start time and detected meeting start time.
2. ∆t end, the difference between real meeting end time and detected meeting end time.
3. Gap Length, the time length of a gap between two detected meetings, where one real meeting is divided into two or more detected meetings.
4. Gap Number, the number of gaps between detected meetings for one real meeting.
5. Missed Gap Length, the time length of a gap, which is not detected, between two real meetings.
6. Missed Gap Number, the number of gaps, which are not detected, between real meetings.
7. Extra Meeting Length, the total time of extra de-tected meetings (which map to no real meeting) per day.
8. Extra Meeting Number, the number of extra meet-ings per day.
9. Missed Meeting Length, the time length of a real meeting thoroughly undetected.
10. Missed Meetings, the number of missed meetings, which are thoroughly undetected, per day.
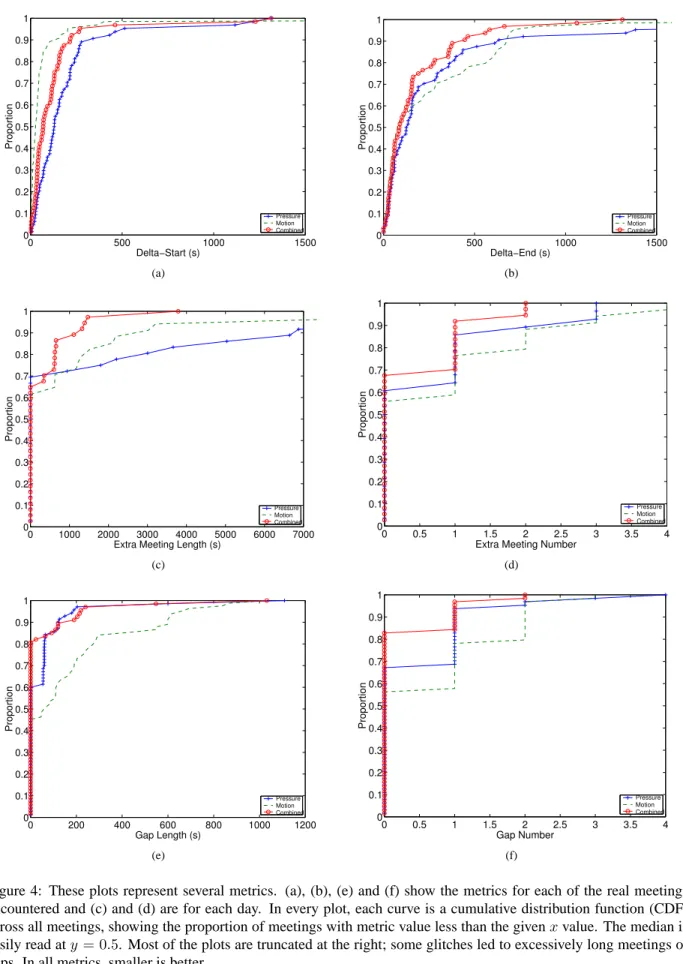
In Figure 4 we present results of metrics (we only show six due to limited space, and cases 5, 6, 9 and 10 happened rarely so there is little data to present). Each plot has three
Figure 2: A state machine illustration on sensor combination algorithm. Heretis the time since the last state change.
Figure 3: The numbers correspond to different metrics.
curves, which show the cumulative distribution function (CDF) of the quality of a meeting detector on the set of points representing real meetings. In all metrics, smaller (to the left) represents better detection performance.
Generally, a single sensor is not a good indicator for meetings because of the reaction time, sensitivity or in-herent hardware limitations. Although the motion scheme was the most likely to catch the time of meeting start or end due to its sensitivity, that same sensitivity led it to detect meeting end prematurely unless one or more peo-ple are moving frequently. It also tends to detect extra meetings when passersby bump the chairs. The over-all result was many extra meetings and many gaps. On the other hand, the pressure mat was less sensitive than the motion sensors, but avoids the problem of acciden-tal bumped chairs. On the other hand, we found that the pressure mat occasionally got stuck and produced some excessively long meetings. Naturally, a combination was
best overall, although it was not the best one for the metric like∆t start.
Examining Figure 4 more closely, (a) clearly shows that the motion detector most quickly detected meetings with a median of 28 seconds,2 which is 41 seconds ear-lier than combined detector and 101.5 seconds earear-lier than the pressure detector alone. This 41 second latency is the price we pay to avoid the extraneous meetings and gaps, a reasonable trade-off for many applications. The com-bined detector shows its advantage in (b) with a median ∆t endof 88 seconds. Overall, we found that the Meet-ing Detector did not work as well in detectMeet-ing meetMeet-ing end time as it did the start time. This asymmetry arose be-cause of the necessary MAYBE states and their associated thresholds. But those hesitation states effectively reduce extra meetings and gaps, in both lengths and numbers, as shown in (c), (d), (e) and (f). Plot (c) shows that the pres-sure detector had the longest extra meeting length because sometimes the pressure mat was stuck and thus produced a long extra meeting. Plot (e) shows that the motion detec-tor had the longest gap length, because of the motion sen-sor’s limitation mentioned above. Plots (d) and (f) show that the combined detector was effective, reporting 5% fewer extra meetings and 11% fewer gaps than motion detector, 8% fewer extra meetings and 16% fewer gaps than pressure detector. These results show clear advan-tages of combined detector that overcomes limitations of single sensor and enhances the performance significantly.
2We note that 28 seconds is well within the noise, since the basis for comparison is the manual meeting log and it was not unusual for the professor and others to sit down and get settled for a few seconds before clicking the “meeting start” button.
0 500 1000 1500 0 0.1 0.2 0.3 0.4 0.5 0.6 0.7 0.8 0.9 1 Proportion Delta−Start (s) Pressure Motion Combined (a) 0 500 1000 1500 0 0.1 0.2 0.3 0.4 0.5 0.6 0.7 0.8 0.9 1 Proportion Delta−End (s) Pressure Motion Combined (b) 0 1000 2000 3000 4000 5000 6000 7000 0 0.1 0.2 0.3 0.4 0.5 0.6 0.7 0.8 0.9 1 Proportion
Extra Meeting Length (s)
Pressure Motion Combined (c) 0 0.5 1 1.5 2 2.5 3 3.5 4 0 0.1 0.2 0.3 0.4 0.5 0.6 0.7 0.8 0.9 1 Proportion
Extra Meeting Number
Pressure Motion Combined (d) 0 200 400 600 800 1000 1200 0 0.1 0.2 0.3 0.4 0.5 0.6 0.7 0.8 0.9 1 Proportion Gap Length (s) Pressure Motion Combined (e) 0 0.5 1 1.5 2 2.5 3 3.5 4 0 0.1 0.2 0.3 0.4 0.5 0.6 0.7 0.8 0.9 1 Proportion Gap Number Pressure Motion Combined (f)
Figure 4: These plots represent several metrics. (a), (b), (e) and (f) show the metrics for each of the real meetings encountered and (c) and (d) are for each day. In every plot, each curve is a cumulative distribution function (CDF) across all meetings, showing the proportion of meetings with metric value less than the givenxvalue. The median is easily read aty= 0.5. Most of the plots are truncated at the right; some glitches led to excessively long meetings or gaps. In all metrics, smaller is better.
5
Discussion
Based on our experience and our experimental results, we now discuss some practical advantages and limitations of our approach. We also give some lessons we have learned that have broader applicability.
We expect that our approach to detect meeting context could be possible to implement at low cost, and easy to use and maintain. Wireless pressure and motion sensors, tied to a simple wireless receiver in the room, could easily collect and forward the information via a WiFi or Eth-ernet connection. If the sensors could be integrated into the chair seat cushion, they should be rugged and easy to maintain. No complex sensing infrastructure (such as a location trackers) is required, although we happened to leverage an existing such system for our test. Combina-tion logic is easily implemented in software or hardware, without any training necessary. Although training may improve accuracy somewhat, it is inconvenient to retrain whenever the meeting environment changes, the room is visited by users with different habits, or to port the system to other rooms.
There are limitations, however. First, detection qual-ity is limited by sensor limitations. The low cost means we sacrifice performance to some extent. Since different applications of a meeting detector require different detec-tion accuracy and sensitivity, the adequate accuracy we achieved in our prototype may not be sufficient for other applications. Some applications may require a highly sen-sitive and accurate detection within several seconds; but some scheduling applications may be satisfied with less accuracy within several minutes. Second, we note that we chose to define “motion” when one or more chairs moved. Defining “motion” to be when two or more chairs moved might avoid detecting extra meetings, but in our experience this approach does not change∆t startand ∆t endmuch. Careful tuning of this parameter and oth-ers should lead to better performance. Finally, in some environments, where many short meetings occur close to-gether, such as frequent five-minute meetings with one-minute intervals, our Meeting Detector did not work as well as it did in the ordinary case, since our pressure sen-sor is not sensitive enough to react to these short intervals in time.
We learned several lessons from our experience with the Meeting Detector. First, a stable, flexible, and efficient context-fusion platform (such as Solar) is a great help to application developers. It significantly reduced the devel-oper’s programming efforts. Solars ability to reuse both classes and instances makes it easier to extend applica-tions. Second, we found that a single type of sensor was unable to gain the desirable accuracy, since every sensor has its limitations. It helped to combine multiple sensor types, since some sensors are complementary. Finally we need to point out that an easy and effective fault-tracking
is necessary in the design of any “invisible” pervasive-computing systems. If the phone rings during a meeting, is it because detector made a wrong decision, or is there something wrong with the hardware? Which sensor went wrong, the motion badge or pressure mat? How can you tell if they are embedded? Is there a hardware failure or do they just need new battery? We had some system fail-ure cases in our experiments and they took us significant efforts to debug what went wrong.
6
Related work
Schmidt and others propose to detect high-level context of a personal device by combining outputs of several on-board sensors, using a training-based algorithm [3]. A PDA and a mobile phone were used with the prototype to demonstrate situational awareness. On the PDA, font size and back-light were changed (e.g., when the user was walking a large font, small font when stationary) depend-ing on the context. In mobile phone the active user pro-file was changed (e.g., a loud ring when at a noisy bar, keep silent in library or meeting room). They performed experiments for the context recognition, to show that it is feasible to recognize high-level contexts using sensor fusion. More specifically, they tested robustness of the context classification and recognition. In the evaluation they achieved accuracy close to 90%. Although their ap-proach is somewhat similar to ours, we aggregated outputs of distributed sensors using a training-free algorithm and we provided a comprehensive set of metrics to measure both accuracy and sensitivity of context detection.
7
Summary
We present a sensor fusion system to detect high-level meeting context. The hardware and software are reason-ably simple and portable, making our approach attrac-tive for practical duplication and deployment. We re-ported the performance evaluation both for single-sensor and combined-sensor detection approaches. In the evalu-ation we observe more than 95% of all meetings were de-tected, though with some latency or gaps. Although it still could be improved, particularly in more complex environ-ments, by tuning parameters and by choosing hardware more suited to the tasks, our Meeting Detector demon-strated that it is feasible to recognize meeting context us-ing unobtrusive low-cost sensors with high accuracy and low latency. The contributions of this paper are the meet-ing detection system itself, as a proof of concept, as well as a set of metrics and an experimental evaluation of the system.
References
[1] G. Chen and D. Kotz. Solar: An open platform for context-aware mobile applications. In Short Paper Proceedings of
[2] A. K. Dey, G. D. Abowd, and D. Salber. A conceptual framework and a toolkit for supporting the rapid prototyp-ing of context-aware applications. Human-Computer
Inter-action (HCI) Journal, 16(2-4), 2001.
[3] A. Schmidt, K. A. Aidoo, A. Takaluoma, U. Tuomela, K. V. Laerhoven, and W. V. de Velde. Advanced Interaction in Context. In HUC 1999, pages 89–101, September 1999.