An Evaluation of Functional Size Methods and a
Bespoke Estimation Method for Real-Time Systems
Per Runeson1
, Niklas Borgquist1
, Markus Landin1
and Wladyslaw Bolanowski2 1Dept. Communication Systems, Lund University, Box 118, SE-221 00 Lund, Sweden
Ericsson Mobile Communications AB, Nya Vattentornet, SE-221 83 Lund, Sweden [email protected]
Abstract. Functional size, or function points, is a language-independent
meas-ure of software size. It is used as an estimator of development effort and soft-ware code size, in particular in the domain of information systems, while in real-time systems it is not so widely spread. In this paper, functional size meas-urements are empirically evaluated by applying them to a recently completed project. Two established methods, Mark II Function Points (MKII) and Full Function Points (FFP) are used. In addition, a bespoke method that focuses on the information supplied by the requirements specifications at the studied com-pany is developed and evaluated. The method is designed to make effort estimates based on states and transitions in a state machine representation of a requirements specification. The results indicate fairly weak relationships tween functional size and LOC for both of the established methods. The be-spoke method was applied to the same data and it is concluded that the relation-ship between the software size according to the new method and the actual code size show better correlation between estimated and real size compared to the analysis for the functional size methods.
1
Introduction
In order to manage a software project it is of great importance to make accurate esti-mates of what effort (i.e. cost, time etc.) it will take to complete the project. Having accurate estimates enables qualified decisions about whether it is economically viable to carry it through. It also allows more efficient resource planning and utilisation. It is impossible to make exact estimates about the effort needed early in a project’s lifecy-cle, but still it is motivated to find the best possible.
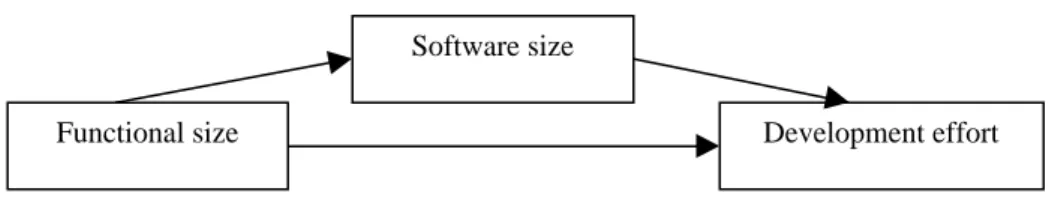
The size of the software is an important characteristic when estimating the required development effort. The size is often measured in terms of lines of code (LOC). Functional size measures [4] are established as language-independent measures that are used to express the functionality of software, usually from the user’s point of view. It is assumed that the functional size of a software project, measured in func-tional size units, can be used as an estimator of the effort needed to carry it through, either directly, or via estimation of the software size in LOC, see Figure 1. The
func-tional size measures are most widespread in the domain of information systems, and are less used in the domain of real-time systems.
Fig. 1. Principles for effort estimation
In this paper, a case study is reported on the application of functional size measures to a real-time system. The focus is on the correlation between functional size meas-ures and software size in LOC, which later is used to estimate the development effort. The direct estimate of effort was not possible, since detailed enough effort data was not available for the studied project. The case study is conducted at Ericsson Mobile Communications AB in Lund, Sweden, particularly to the development of software for mobile telephones. Two established methods, Mark II Function Points (MKII) [12] and Full Function Points (FFP) [14] are applied to the requirements specifica-tions of real-time applicaspecifica-tions in a mobile phone. As the estimates are not very accu-rate, a bespoke estimation model is developed and evaluated, which is tailored to the information available in the specification documents at Ericsson. For more details on the case study, see [3].
The results of the study show that the correlation is very strong between the ele-ments in the bespoke estimation method and the number of LOC in the final product, while the relation is weaker using the established functional size methods.
The paper is structured as follows. An introduction to the concept of functional size measures is given in Chapter 2, based on the original Function Point Analysis method. The chapter also contains a description of the two functional size measurement meth-ods investigated. In Chapter 3 the bespoke estimation method is described. Chapter 4 contains an analysis of the results the methods produce when applied to a large soft-ware project at Ericsson. Chapter 5 contains a summary and suggestions of how to refine the developed method.
2
Functional Size Measures
A software system has several different size aspects. The most obvious aspects are length and functionality. When measuring the size of a program using the length as-pect, the LOC measure is used. However, the code quantity has no intrinsic value: The customer purchases functionality, not lines of code.
Functional size is defined as “a size of the software derived by quantifying the functional user requirements” [7]. In other words, the functional size should reflect the system’s functionality from the viewpoint of the users. Hence, it is language-independent, i.e. the size must be the same irrespective of the programming language
Functional size
Software size
used. Further, it does not depend on any particular notation of the requirements speci-fications [4].
2.1 Principles
There are over 35 more or less different functional size-related metrics. The Interna-tional Function Point User Group Function Point Analysis (FPA) [5], which is a re-finement of the very first method for functionality measurement, by Allan Albrecht [2], is by many considered to be the standard method [9]. Despite the rich variety of methods, they all rely on the same principles. Looking at the requirements, actions and data that are meaningful to the user are identified and classified according to some kind of complexity criteria. Most methods consist of component classes such as inputs, outputs and file references, referred to as Base Functional Component (BFC) types. Some methods also take into account the algorithmic complexity of an applica-tion. The components are then assigned values and they contribute by their respective value to the functional size.
A function point analysis in FPA involves the identification of five BFC types: external inputs (EI), external outputs (EO), external inquiries (EQ), internal logical files (ILF) and external interface files (EIF). The method components are illustrated in Figure 2. The arrows symbolise data inputs or outputs and boxes are used to illustrate data, grouped according to some logical criterion. The circle is used to symbolise a software application and the dashed line around it is a border that defines what soft-ware that is subject to the analysis. Objects from which an input has its origin or to which an output terminates, are illustrated by ovals.
Fig. 2. The components of FPA
Each of the identified components is assigned a value depending on the complex-ity. The total sum of these BFC:s makes up the unadjusted function point count (UFP), which corresponds to the functional size of the system. To obtain the final
adjusted function point count (AFP), the unadjusted function point count is multiplied
by a factor determined by fourteen general systems characteristics [5]. That factor is
Application Border EI EQ User ILF Other application EIF EO
intended to value additional functionality, for example user friendliness, delivered by the system. However, to comply with the ISO standard for functional size [7], the point adjustment steps of the FPA method have become optional.
2.2 Mark II Function Points (MKII)
The Mark II function point method was designed to overcome weaknesses identified in the original Albrecht method [15]. The main differences are the following:
• The functional component types are graded on a more detailed scale. The scale is also given a much wider span in terms of complexity.
• The software system is regarded as a collection of logical transactions (the coun-terparts to the FPA functions) consisting of input, process and output. These are added and multiplied with relative weights. It is possible to use an adjustment fac-tor, based on system 20 characteristics (6 are added to the 14 in FPA).
An input element consists of the acquisition and validation of incoming data either describing an event of interest in the external world, or the parameters of a request of information to be output from the application. The processing element consists of the storage and retrieval of information describing the status of entity types of interest in the external world. The output element consists of formatting and presentation of information to the external world.
2.3 Full Function Points (FFP)
The FPA and MKII methods have been strongly criticised for being applicable mainly on information system (IS) software. It is said that they do not capture the functional characteristics of real-time systems (RTS) software, which in several ways are differ-ent from the characteristics of IS software [9]. In an attempt to overcome the prob-lems associated with FPA, the Full Function Point method (FFP) was developed. The approach was to use FPA as a basis and extend it by introducing new BFC types and modifying the counting rules [1].
The BFC types in FFP are based on the observation that real-time software has specific transactional and data characteristics [13]. A transactional characteristic spe-cific for RTS software is a large variation in the number of processes, whereas IS software has a more stable number of processes.
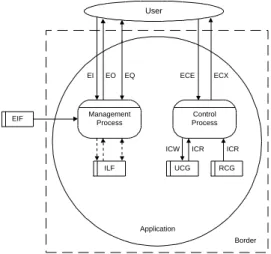
The FFP contains the BFC types from the FPA method to measure the parts of an RTS which has IS characteristics, see Figure 2. Those are referred to as the manage-ment process types, see the left part of Figure 3. In addition, six new BFC types are introduced by FFP to take specific RTS characteristics into account, referred to as control processes [14], see the right part of Figure 3. The new BFC types are updated control group (UCG), read-only control group (RCG), external control entry (ECE), external control exit (ECX), internal control read (ICR and internal control wriote (ICW). In addition, the BFC:s are used at a lower abstraction level than used in FPA and MKII. It is, however, not always clear what shall be considered a management process and what shall be considered a control process.
Fig. 3. The components of FFP
2.4 Criticism of Functional Size Measurement
Although the concept of functional size has gained popularity and methods to meas-ure functional size are widely used all over the world, it has not been without criti-cism. At first sight, the methods seem very easy to understand and apply, but in real-ity they can be labour-intensive and difficult to use. If an inexperienced person con-ducts an analysis, this may enhance many of the other potential drawbacks [6]. One drawback is that persons performing counts may obtain different results, because they interpret rules differently [8, 10, 11].
Counts conducted in different phases of the software lifecycle can give results with significant variance. Due to scope creep (i.e. added functionality not in the original specification), and more often due to a too low level of detail exhibited in the specifi-cations, the size is often underestimated [4]. This problem is due to imperfections in the information the count is based on and not to flaws in the functional size measure-ment methods. Nevertheless, it should be taken into concern.
There are a great variety of functional size methods. Different methods may give results that vary more than 100 percent [9], and the correlation between different methods may often appear random [15].
Another issue is that most functional size measurement methods do not adhere to the theory of measurement [4]. The ordinal scale type is used when the BFC:s in the FPA method are assigned the complexity low, average or high. An ordinal scale only represents ranking, so arithmetic operations such as addition and subtraction should not have any meaning. The MKII method does not suffer from the limitations of the ordinal scale, as long as the adjustment factor is not used. However, it can be ques-tioned if the handling of the BFC types is correct, when adding them, since the types are not orthogonal.
EIF Management Process Control Process ILF UCG RCG Application Border ICW ICR ICR EQ
EO
EI ECE ECX
3
A bespoke effort estimation method
In this chapter, an alternative effort estimation method is introduced, based on the specific elements of the requirements specifications at Ericsson in their development of mobile phones. The functional size methods do not consider the extensive infor-mation about code structure supplied by the specific requirements specifications. The specifications at Ericsson contain rather much design information, which can be used in estimating the code size.
The requirements specifications are documented with state machines, see Figure 4. The states (with Ericsson terminology called pages) most often correspond to some sort of GUI (graphical user interface) objects. Each GUI object is specified in the requirements specifications. When an event occurs, a new GUI object is usually dis-played. An event results in some sort of action, simple or more complex. All actions emanating from user-triggered events are defined in the requirements specifications. Ideally, all actions originating from externally triggered events should also be defined in the requirements specifications, but they are not.
Fig. 4. State machine representation in a requirements specification.
In addition to this information, the requirements sometimes offer information about when sub-processes are called (a collection of states referred to in many places) and in some cases when conditional statements are required in the implementation. When this information is present in the requirements specifications, it helps to predict the amount of source-code. A code-estimating method with high accuracy would pre-sumably benefit from including this information in the method. Thus, the following components are counted in the bespoke method:
Pages: A page in the bespoke method corresponds to the presentation of a GUI object
in the requirements specifications.
Sub-processes: Sub-processes in the estimation method normally correspond to
sub-process objects in the requirements specifications.
Reused pages: This method component takes into account the fact that many states
are very similar, and when implemented, they can be combined into one single state by using slightly different input.
Simple actions: Simple actions correspond to most of the actions needed to move
between states. The simple actions are easily identified in the requirements specifica-tions.
Complex actions: Complex actions correspond to a group of actions that include
more functionality and thus require more code to implement than the simple actions.
Decision nodes: A decision node in the requirements specifications indicates that a
conditional statement will be needed in the implementation.
State_1 State_2
Action_1
In the proposed method, all the components mentioned above are counted in a re-quirements document. Each component type is assigned a weighting factor, which reflects the relative amount of code that component will result in. The weighting fac-tors are derived by manually analysing the code from several applications. For com-parison, statistically derived weights are presented, using linear regression.
The steps described above result in a new code estimation method. The numbers of components of each type, as defined above, are counted. Each number is multiplied with a factor, empirically derived from a large number of requirements specifications. The number of points are summed and multiplied with a conversion factor to derive a code size estimate. In addition, an offset constant is added. The conversion factor and the offset are also empirically derived.
4
Evaluation
4.1 Application
The MKII, FFP and the bespoke methods are evaluated by applying the methods to the Short Message Service (SMS) application of an Ericsson mobile telephone. The size of the application is about 8 000 LOC. To calibrate the bespoke method, and to evaluate more than 100 000 LOC was analysed. The sample data is based on 25 speci-fications. The range in LOC for the corresponding applications was between 133 and 11 075. All applications are written in the same language.
4.2 Functional Size Counting
In the code analysis process it was learned, that the existing requirement documents do not accurately describe the implementation of the requirements. In fact, there is a difference in functionality and structure between the specifications and the imple-mentations.
The objective of the code estimation method is to be able to estimate the amount of code produced by the implementation of a requirements specification. However, the available specifications did not cover all the functionality of the implementation, which would introduce a bias in the estimation method. To avoid these errors, fictive requirements specifications with an ideal correlation with the implementations were constructed. The specifications constructed in this manor will hereafter be called
complete specifications and the existing, incomplete specifications, will be called actual specifications . Since the complete specifications not only describe the
imple-mented functionality but also the structure of the code, they can be regarded as design documents.
In the data collection process, the first step was to analyse the application and to produce complete specifications. Once the complete specifications had been derived, it was a straightforward process to count the components of the code estimation methods. For error estimation purposes, the components in the actual specifications were also counted.
4.3 Calibration
The relative weights needed in the three functional size methods were taken from different sources. In MKII, industry average weights are used. These weights are collected from various different uses of the MKII method. Ideally, calibrated weights specifically derived for Ericsson should be used, but these are not available. The weights used in FFP are the ones defined in the method [13].
For the bespoke method, the weights are derived by manually counting how much code is related to each of the component types on average. Additionally, a statistical analysis using linear regression is performed to validate the manually derived weights. The weights are presented in Table 1. The statistically derived weights show that the manually derived ones are feasible. The reason for not using the statistical weights is that there is limited data for some components, which is illustrated by the negative statistical weight for the decision node component, which has no physical interpretation.
Table 1. Weights for the bespoke code estimation method
Components Weight Statistical weight
Decision nodes 4 –16.6 Simple actions 10 17.1 Pages 35 31.3 Complex actions 15 21.2 Sub-processes 5 3.2 Reused Pages 7 3.2 4.4 Results
Using the MKII method, 13 logical transactions were identified, giving a total of 80.7 MKII function points. The application of FFP identified 13 processes adding up to 91.2 FFP point. Finally the bespoke method identified 10 functions and a total of 2481 method points. The names of the identified entities are not published for confi-dentiality reasons.
MKII
The SMS application was analysed by determining what amount of LOC was needed to implement a certain logical transaction. Each LOC was assigned to a specific func-tion or, in case no specific funcfunc-tion could be traced for the line, it was assigned to a project overhead function. All code assigned to the project overhead function was distributed proportionally among the actual logical functions in the end of the count. Three logical transactions could not be distinguished in the analysis of the code. Therefore those three transactions were considered to contribute to the overall func-tionality of the SMS application and their MKII functional size was distributed pro-portionally among the other logical transactions.
All the logical transactions, their resulting number of function points and the real LOC needed to implement the logical transactions are found in Table 2.
Logical Transaction Points Implemented LOC Logical Transaction Points Implemented LOC LT_A 8.9 600 LT_H 5.5 293 LT_B 7.9 552 LT_I 2.8 492 LT_C 7.3 845 LT_J 2.8 536 LT_D 6.0 322 LT_K 4.6 1242 LT_E 11.0 1081 LT_L 2.8 166 LT_F 11.6 1333 LT_M 4.9 294 LT_G 4.6 241
When the overhead function points and code had been distributed among the logi-cal transactions, a linear relationship between MKII function points and implemented LOC was sought. The least square method was used to fit a line to the data after one outlier was excluded (LT_K). The implemented LOC were considered to be a func-tion of the MKII funcfunc-tion points. The trendline in Figure 5 indicates a linear relafunc-tion- relation-ship between MKII function points and implemented LOC. The equation is presented in Figure 5. The slope suggests that each Mark II function point is equivalent to 95 LOC. In addition, there is a negative offset of about 40. The goodness of fit to the data measured by the square of the correlation coeffecient, denoted R2
. In this case, R2
equals 0.6644, which is fairly good.
Table 2. MKII function points and implemented LOC for the SMS application
Fig. 5. MKII function points versus implemented LOC for logical SMS transactions.
Mark II function points vs. implemented code (outlier excluded)
y = 94,525x - 39,284 R2 = 0,6644 -200 0 200 400 600 800 1000 1200 1400 1600 0 2 4 6 8 10 12 14
Mark II function points
FFP
Using the FFP rules, the processes of the application were identified by analysing the completed product. To be able to match segments of the implemented code with the identified functionality, some processes were merged. For example, three processes were merged into the PR_C process. The resulting set of processes is presented in Table 3. The code corresponding to two processes could not at all be distinguished, nor could related code or related processes be found. They were therefore excluded from the analysis. The points contributed by the data groups were proportionally distributed among the processes.
Process Points Implemented
LOC
Process Points Implemented
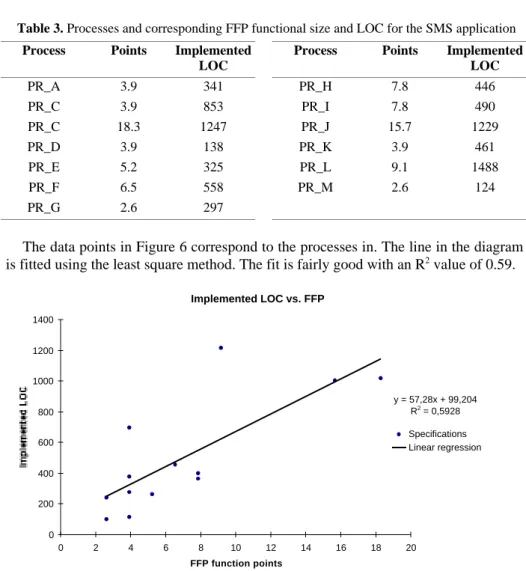
LOC PR_A 3.9 341 PR_H 7.8 446 PR_C 3.9 853 PR_I 7.8 490 PR_C 18.3 1247 PR_J 15.7 1229 PR_D 3.9 138 PR_K 3.9 461 PR_E 5.2 325 PR_L 9.1 1488 PR_F 6.5 558 PR_M 2.6 124 PR_G 2.6 297
The data points in Figure 6 correspond to the processes in. The line in the diagram is fitted using the least square method. The fit is fairly good with an R2
value of 0.59.
Table 3. Processes and corresponding FFP functional size and LOC for the SMS application
Fig. 6. Implemented code as a function of FFP functional size Implemented LOC vs. FFP y = 57,28x + 99,204 R2 = 0,5928 0 200 400 600 800 1000 1200 1400 0 2 4 6 8 10 12 14 16 18 20 FFP function points Implemented LOC Specifications Linear regression
The two data points which deviate the most from the trendline in Figure 6 are the PR_B and the PR_L processes. In both cases the amount of LOC per function point is considerably larger than the average. The reason for the PR_L process to deviate significantly from the trendline is likely due to implemented functionality hidden from the user.
Bespoke
Using the bespoke method, each component in the requirements specification of the SMS application was counted. Further, the amount of LOC was counted for each function, see Table 5. In Figure 7, each complete specification has been positioned in the diagram according to the number of points and LOC it corresponds to. Using linear regression, the fitted line can be specified using the equation in Figure 7. Each point in the bespoke method corresponds to 2.9 LOC and the bias is 87 LOC. The goodness of the fit is measured by the R2
value, which is 0.80 in this case.
Table 4. Bespoke method, SMS
Function Points LOC Function Points LOC
F_A 141 600 F_F 136 492
F_B 531 981 F_G 136 536
F_C 74 322 F_H 365 1242
F_D 614 2414 F_I 35 166
F_E 369 950 F_J 80 294
Fig. 7. Linear regression using sample data for the SMS application
Implemented LOC vs. Bespoke method points
y = 2,8746x + 86,71 R2 = 0,8016 0 500 1000 1500 2000 2500 0 200 400 600 800
Bespoke method points
Implemented LOC
Specifications Linear regression
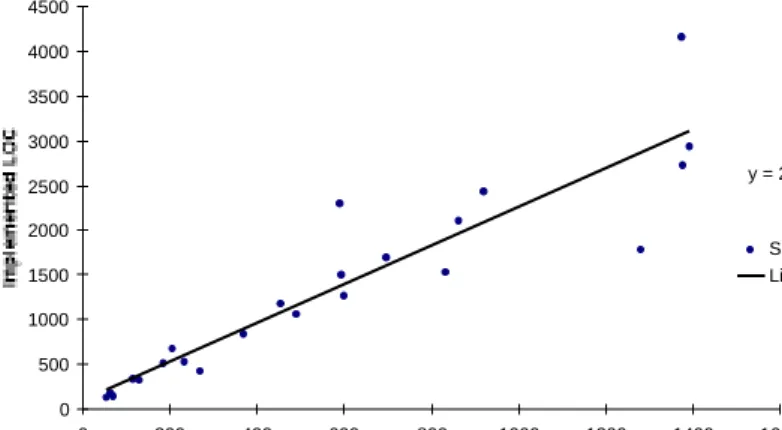
For the bespoke method, an evaluation is also conducted using data from 23 speci-fication. The results produced are plotted in Figure 8. The equation in the chart de-scribes the relationship between points and implemented code. The slope is approxi-mately 2.2; i.e. the slope is slightly less than in the SMS case, while the R2
value is still better, 0.85.
As mentioned before, the results presented in the previous sections are based on points obtained when counting elements in complete specifications. All MMI func-tionality has thus been accounted for. The existing MMI specifications do not com-pletely cover the implemented functionality and therefore the results acquired when using the method for code estimation on the existing specifications are not the same as the ones presented above. However, it is interesting to study the impact of the in-complete specifications on the estimates. The results should indicate what kind of accuracy one can expect from the present requirements specifications.
Counting the method components for the actual specifications has produced the re-sults below. The components have then been multiplied by their weights and summed. Thus, a total number of points are acquired for each specification.
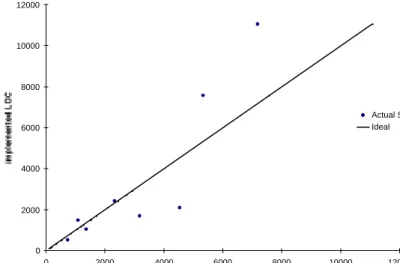
The predictions obtained are plotted in Figure 9. They are not as accurate as the predictions based on the complete specification, but the predicted code size is still within 30% of the actual value for most of the specifications. The relative accuracy of the method on actual specifications makes it valid for use on the current requirements specifications at Ericsson. Once the accuracy of the requirements specifications has improved, the precision of the code estimations will be enhanced. The error obtained when predicting the total amount of LOC needed in all the implementation together is less than 10%.
Fig. 8. Linear regression using sample data for all sample data Ericsson Code Estimation Model (small projects)
y = 2,1609x + 103,1 R2 = 0,8471 0 500 1000 1500 2000 2500 3000 3500 4000 4500 0 200 400 600 800 1000 1200 1400 1600
Bespoke method points
Implemented LOC
Specifications Linear regression
Fig. 9. Code predictions from actual specifications
5
Summary
A number of methods for counting functional size are available, among those are MKII and FFP. This paper evaluates these methods and a bespoke method, specifi-cally derived to use information available in requirements specifications at Ericsson. The new method takes into consideration the special features of the requirements specifications and the implementation techniques used at the company. The new method is thus highly specialised for code estimates. The accuracy gained in this area has been at the expense of other possible areas of usage. The new method can e.g. not be used for productivity comparisons with other companies, which is one of many features of the functional size methods.
The three methods are evaluated by applying them to the SMS application of an Ericsson mobile telephone. The results produced by the bespoke method show prom-ising results in this study. The relationship between points and implemented code size has been consistent, implying that the method could be used for accurate predictions in similar projects. The accuracy was better than any of the functional size measure-ment methods used was.
The study conducted includes a limited data material. When a larger sample data has been collected, further statistical analyses might improve the accuracy of the code estimation method. Using company-specific weight instead of industry average may improve the MKII estimate.
Predictions from actual specifications
0 2000 4000 6000 8000 10000 12000 0 2000 4000 6000 8000 10000 12000 estimated LOC implemented LOC Actual Specifications Ideal
6
Acknowledgement
The authors would like to thank Dr. Martin Höst, Lund University for reading a draft of this paper. We are also thankful to the anonymous referees of the paper. The work is partly supported by the Swedish National Board for Industrial and Technical De-velopment (NUTEK) under grant 1K1P-97-09690.
References
[1] Abran, A. et al, 1997, “Adapting Function Points to Real-Time Software”, American
Pro-grammer, Vol. 10, No. 11.
[2] Albrecht, A. J., Gaffney, J. E., 1983, “Software Function, Source Lines of Code, and De-velopment Effort Prediction: A Software Science Validation”, IEEE Transactions on
Soft-ware Engineering, Vol. SE-9, No. 6.
[3] Borgquist, N. and Landin, M, 1999, “Functional Size as a Basis for Effort Estimates in Real Time Projects”, MSc Thesis, CODEN:LUTEDX(TETS-5373)/1-102/(1999)&local33, Dept. of Communication Systems, Lund University, Sweden.
[4] Fenton, N. E., Pfleeger, S. L., 1996, Software Metrics, A Rigorous & Practical Approach, International Thomson Computer Press, London.
[5] Function Point Counting Practices Manual 4, International Function Point Users Group, 1999. <http://www.ifpug.org>, June 1999.
[6] Garmus, D., Herron, D., 1996, Measuring the Software Process, Prentice Hall, Upper Sad-dle River, New Jersey.
[7] ISO/IEC 14143-1, 1998, Information Technology – Software Measurement – Functional
Size Measurement – Part 1: Definitions of concepts.
[8] Jeffery, J. R., Low, G. C., and Barnes, M. A., 1993. “Comparison of Function Point Count-ing Techniques”, IEEE Transactions on Software EngineerCount-ing, Vol. 19, No. 5, pp. 529-532. [9] Jones, C., 1998, Estimating Software Costs, McGraw-Hill, New York.
[10] Kemerer, C., 1993, “Reliability of Function Point Measurements: a Field Experiment”,
Communications of the ACM, Vol 36, No. 5, pp. 85-97.
[11] Kitchenham, B., 1997, “The Problem with Function Points”, IEEE Software, March/April. [12] UKSMA Metrics Practices Committee, 1998, MKII Function Point Analysis Counting
Practices Manual. < http://www.uksma.co.uk/>, June 1999.
[13] Oligny, S., Desharnais, J.-M., Abran, A., 1999, A Method for Measuring the Functional
Size of Embedded Software, SELAM, Université du Québec à Montréal.
<http://www.lrgl.uqam.ca/ffp.html>, June 1999.
[14] St-Pierre, D. et al, 1997, Full Function Points: Function Points extensions for real-time
software, concepts and definitions, SELAM, Université du Québec à Montréal.
<http://www.lrgl.uqam.ca/ffp.html>, June 1999.
[15] Symons, C. R., 1991, Software Sizing and Estimating, John Wiley & Sons Ltd, Chiche s-ter, West Sussex.