An analysis of high-frequency cryptocurrencies prices dynamics using
permutation-information-theory quantifiers
Aurelio F. Bariviera, Luciano Zunino, and Osvaldo A. Rosso
Citation: Chaos28, 075511 (2018); doi: 10.1063/1.5027153 View online: https://doi.org/10.1063/1.5027153
View Table of Contents: http://aip.scitation.org/toc/cha/28/7 Published by the American Institute of Physics
An analysis of high-frequency cryptocurrencies prices dynamics using
permutation-information-theory quantifiers
Aurelio F.Bariviera,1,2,a)LucianoZunino,3,4,b)andOsvaldo A.Rosso5,6,7,c)
1Department of Business, Universitat Rovira i Virgili, Av. Universitat 1, 43204 Reus, Spain 2Universidad del Pacífico, Lima, Perú
3Centro de Investigaciones Ópticas (CONICET La Plata—CIC), C.C. 3, 1897 Gonnet, Argentina
4Departamento de Ciencias Básicas, Facultad de Ingeniería, Universidad Nacional de La Plata (UNLP), 1900 La Plata, Argentina 5Departamento de Informática en Salud, Hospital Italiano de Buenos Aires and CONICET, C1199ABB Ciudad Autónoma de
Buenos Aires, Argentina
6Instituto de Física,Universidade Federal de Alagoas, Av. Lourival Melo Mota, s/n, 57072-970 Maceió, Alagoas, Brazil 7Complex Systems Group, Facultad de Ingeniería y Ciencias Aplicadas, Universidad de los Andes, Las Condes, 12455 Santiago,
Chile
(Received 28 February 2018; accepted 12 June 2018; published online 19 July 2018)
This paper discusses the dynamics of intraday prices of 12 cryptocurrencies during the past months’ boom and bust. The importance of this study lies in the extended coverage of the cryptoworld, accounting for more than 90% of the total daily turnover. By using the complexity-entropy causal-ity plane, we could discriminate three different dynamics in the data set. Whereas most of the cryptocurrencies follow a similar pattern, there are two currencies (ETC and ETH) that exhibit a more persistent stochastic dynamics, and two other currencies (DASH and XEM) whose behav-ior is closer to a random walk. Consequently, similar financial assets, using blockchain technology, are differentiated by market participants. Published by AIP Publishing. https://doi.org/10.1063/1. 5027153
In recent years, there has been a development of a new type of financial asset called cryptocurrency. This syn-thetic asset has an almost unique feature that it is traded 24/7 in unregulated trading platforms. The huge amount of money traded daily in such a market and the singularity of the asset nature deserve a deep study on prices dynam-ics and comparison among different cryptocurrencies. We analyze 12 of the most important ones, using a powerful statistical tool based on Information Theory, namely, the complexity-entropy causality plane. It allows one to dis-criminate these cryptocurrencies into different dynamical regimes.
I. INTRODUCTION
According to the traditional definition, a currency has three main properties: (i) it serves as a medium of exchange, (ii) it is used as a unit of account, and (iii) it allows one to store value. Traditional currencies are issued by central banks, on behalf of nation states, and their values are related to the confi-dence in the central bank policies and in the economy in which such currencies are based on. A few years ago, a new type of tradable asset, called broadly cryptocurrencies, emerged. The first and most widely known is Bitcoin (BTC). It was cre-ated following the publication of a manuscript written by an
unknown author under the pseudonym “Nakamoto.”29
Con-trary to standard fiat money, its creation is not linked nor endorsed by any central bank and/or government. It is a fully
a)Electronic mail: [email protected] b)Electronic mail: [email protected] c)Electronic mail: [email protected]
private creation of virtual money, whose value is not intrin-sically based on any precious metal or any other underlying asset. Consequently, its intrinsic value is zero.11
Cryptocur-rencies are based on a new technology called blockchain. Its main innovation is that transactions, instead of being validated by a central authority or clearing house, are done by partici-pants from several markets, who compete to validate them by solving complex cryptologic algorithms. In turn, the winner in this validation quest is rewarded with some amount of the cryptocurrency he/she is validating. This decentralized and encrypted transaction ledger makes, according to those who are in favor of this technology, a more reliable validation than the centralized alternative.
The ecosystem of cryptocurrencies has been growing at an increasing pace, and now there are around 1000 active and tradable cryptocurrencies, using blockchain or similar proto-cols. Daily transactions are worth several millions of dollars, and in recent times, a growing literature is devoted to the study of different aspects of this new asset.
The aim of this paper is to study the informational efficiency of the 12 most important cryptocurrencies, using high-frequency data. All cryptocurrencies rely on a similar blockchain technology, making them similar from a tech-nical point of view. However, none of them have any real or tangible asset in order to price them. Consequently, the comparative analysis aims to test if these instruments have different underlying (unobservable) dynamical structure. This article contributes to the literature in three important aspects. First, we expand the empirical studies analyzing this new asset type. Second, we compare the dynamic behavior of the 12 major cryptocurrencies. Third, we describe the temporal evolution of informational efficiency using high-frequency
075511-2 Bariviera, Zunino, and Rosso Chaos 28, 075511 (2018) data. The rest of the paper is organized as follows: SectionII
describes the recent emerging literature on Bitcoin and other cryptocurrencies, SectionsIIIandIVintroduce the methodol-ogy used in the paper, SectionVpresents the set of data and discusses the results of our empirical analysis, and, finally,
SectionVIdraws the main conclusions.
II. BRIEF LITERATURE REVIEW
The study of cryptocurrencies has different branches that spans law, computer science, and economics. The great inno-vation in Nakamoto’s paper29was probably not the creation of BTC, but the development of an open-source, decentralized online payment system. In other words, financial transac-tions could be done, at a very reduced fee,21 bypassing the
established international banking system. Even more, due to encryption, parties are not required to disclose their true identity. This feature could arise concerns within the law community about the use of BTC for illegal purposes. Com-puter science literature focus its interest on the technical design of the blockchain technology, security of cryptographic protocols, vulnerabilities, energy consumption, etc. Finally, financial and monetary economics focus mainly on either the economic determinants of BTC price and its informational efficiency. We will focus on this latter aspect.
According to the classical definition by Fama,15 a mar-ket is informationally efficient if prices convey all relevant information. In other words, and limiting the information set to the series of prices of a given asset, we say that the market for that asset is efficient if the current price incorpo-rates the information of past prices. As a corollary of such definition, the use of past prices for future prices forecasting is futile. Samuelson36established that the time series of prices of
any given speculative asset should behave as a random walk (RW). The empirical literature in financial economics found several deviations from the RW hypothesis. In fact, Bariv-iera and co-authors have shown the presence of time varying long-range dependence in the Thai Stock Market,5studied the
effect of the 2008 financial crisis on the informational
effi-ciency of European sovereign bonds,10and have also found
an asymmetric response in the stochastic characteristics of European corporate and sovereign bonds.9Other authors have studied the relationship among predictability political crises and market crashes.20
Regarding the cryptocurrency markets, most of the litera-ture concentrates its efforts in the analysis of BTC. However, the cryptocurrency ecosystem is populated by hundreds of
competitors to BTC. Conmarketcap12gathers information of
around 1000 different active currencies. In this sense, our paper gives a broader picture of this virtual market by analyz-ing other eleven cryptocurrencies in addition to the classical BTC.
Cheah and Fry11 found speculative bubbles in the BTC
market. Urquhart40reported informational inefficiency in the
BTC market from 2013 until 2016. Similarly, Nadarajah and
Chu28 found that the time series behavior of BTC is not
consistent with the Efficient Market Hypothesis (EMH), and
Bariviera6has shown a reduced long-term memory effect in
the period 2013-2016. Finally, Bariviera et al.7found that the
long-term memory profile of BTC time series is similar at dif-ferent time scales. It is also reported prices clustering at round numbers (with 00 decimals).41
III. INFORMATION THEORY QUANTIFIERS
The departing point for many empirical studies in eco-nomics is a time series. Financial markets, and more precisely the growing cryptocurrency markets, provide abundant mate-rial to process. Taking into account that each transaction is recorded electronically and that there are thousands of transactions per hour, the researcher can select data with a different granularity. The abundance of data allows the intro-duction of more advanced techniques, mostly derived from econophysics, in order to shed light on economic phenomena. Information-theory-derived quantifiers could be very helpful to uncover information conveyed by financial time series. The use of entropy quantifiers in the financial litera-ture can be traced back to the 1960s, with papers by Theil and Leenders,39Fama,14and Dryden.13These papers may be
considered isolated examples on the use of this technique, which was only recovered in recent times, by the econo-physics literature. In this line, Martina et al.26 and Ortiz et al.31 applied entropy and multiscale entropy analysis to
assess crude oil price efficiency. Alvarez-Ramírez et al.2also
used entropy methods to quantify the dynamics of the infor-mational efficiency of the US stock market over the last 70 years.
Shannon entropy is a very natural and common way to measure the degree of disorder in a system. According to Shannon and Weaver,37given a discrete probability
distribu-tion P= {pi∈R; pi≥0; i=1,. . ., M}, with
M
i=1pi=1, Shannon entropy is defined as follows:
S[P]= − M
i=1
piln pi. (1) This quantifier equals zero if the patterns are fully determinis-tic and reaches its maximum value for a uniform distribution. However, analyzing time series by means of Shannon entropy alone could fall short. Feldman and Crutchfield16and
Feldman et al.17advocate that an entropy measure does not
quantify the degree of structure or patterns present in a process and that a measure of statistical complexity must be intro-duced into the analysis in order to characterize the system’s organizational properties. Martín et al.24and Lamberti et al.22 have introduced a statistical complexity measure, based on the functional form developed by López-Ruiz et al.,23defined in
the following way:
CJS[P, Pe]=HS[P]QJ[P, Pe], (2)
where HS[P]=S[P]/Smax is the normalized Shannon
entropy, P is the discrete probability distribution associ-ated with the time series under analysis, Pe is the uniform distribution, and QJ[P, Pe] is the so-called disequilibrium:
QJ[P, Pe]=Q0{S[(P+Pe)/2]−S[P]/2−S[Pe]/2}with Q0
being a normalization constant. This disequilibrium is defined in terms of the Jensen-Shannon divergence, which quanti-fies the difference between two probability spaces. Martín et
for generalized statistical complexity measures such asCJS. Additionally, as highlighted in Soriano et al.,38the statistical
complexity is not a trivial function of the entropy because it is based on two probability distributions.
The planar representation of these two quantifiers, called the complexity-entropy plane, has been introduced in the econophysics literature for characterizing the informational efficiency of several markets, for example, to rank effi-ciency in stock markets;44,46to rank efficiency in commodity
markets;45 to link informational efficiency with sovereign
bond ratings;43to assess the impact of the establishment of a common currency and a deep and wide financial crisis in European sovereign bonds time series;10and to detect Libor manipulation.4,8
IV. BANDT-POMPE TIME SERIES SYMBOLIC ENCODING
Many economic phenomena produce observable magni-tudes, which are registered at evenly distributed times. These observations, i.e., time series, are the raw materials used by quantitative analysts to model and scrutinize complex phe-nomena. This research area is broadly known as time series analysis. One of its goals is to describe the nature of the gen-erating process. We can safely assume that a straight departing point for this task is to find the appropriate probability density function (PDF) associated with the time series. There are sev-eral competing methodologies for PDF estimation. Beyond traditional histogram technique, and without attempting to be exhaustive, we can cite binary symbolic dynamics,27Fourier
analysis,32 wavelet transform,33 and ordinal patterns.3 The
suitability of each method depends on the very own character-istics of the data. The methods for symbolic analysis of time series discretize raw series and transform it into a series of symbols. These kind of methods are very powerful because they are rarely affected by the presence of observational noise.18This property is especially important in the analysis
of economic time series, where noise is a traditional feature. Among the symbolic-based techniques for PDF estimation,
the Bandt and Pompe (BP) methodology3has the advantage
of considering time causality in its estimation. This sym-bolic methodology is robust to the presence of (observational) noise and requires no a priori model assumption, except weak stationarity. The starting point of this method is to con-sider the ordinal structure of D-dimensional partitions of the time series. “Partitions” are devised by comparing the order of neighboring relative values rather than by apportioning amplitudes according to different levels.
Let consider a time series S(t)= {xt; t=1,. . ., N}, an embedding dimension (pattern length) D>1(D∈N), and
an embedding delay (sampling frequency) τ (τ ∈N), the
BP-pattern of order D generated by
s→xs−(D−1)τ, xs−(D−2)τ,. . ., xs−τ, xs
, (3)
is the one to be considered. To each time s, the BP method assigns a D-dimensional vector that results from the eval-uation of the time series at times s−(D−1)τ, s−(D−
2)τ,. . ., s−τ, and s. Clearly, the higher the value of D,
the more the “time causality” is incorporated into the ensu-ing vectors. By the ordinal pattern of order D related to the time s, BP mean the permutation π =(r0, r1,. . ., rD−1) of
(0, 1,. . ., D−1)defined by
xs−rD−1τ ≤xs−rD−2τ ≤ · · · ≤xs−r1τ ≤xs−r0τ. (4)
In this way, the vector defined by Eq.(3)is converted into a definite symbolπ. So as to get a unique result, BP consider that ri<ri−1if xs−riτ=xs−ri−1τ. This is justified if the values
of xt have a continuous distribution so that equal values are very unusual.
For all the D! possible orderings (permutations)πiwhen embedding dimension is D, their associated relative frequen-cies can be naturally computed according to the number of times this particular order sequence is found in the time series, divided by the total number of sequences,
p(πi)={
s|s≤N−(D−1)τ;(s) has typeπi}
N−(D−1)τ . (5)
In the last expression, the symbolstands for “number.” Thus, an ordinal pattern probability distribution P= {p(πi), i= 1,. . ., D!}is obtained from the time series.
The ordinal pattern PDF is invariant with respect to non-linear monotonous transformations. Accordingly, nonnon-linear drifts or scalings artificially introduced by a measurement device will not modify the quantifiers’ estimation, a nice prop-erty if one deals with experimental data (see, e.g., Saco et
al.35). These advantages make the BP approach more
conve-nient than conventional methods based on range partitioning. Additional advantages of the method reside in its simplic-ity (we need few parameters: the pattern length/embedding
dimension D and the embedding delayτ) and the extremely
fast nature of the pertinent calculation-process.19 The BP
methodology can be applied not only to time series represen-tative of low dimensional dynamical systems but also to any type of time series (regular, chaotic, noisy, or reality based).3
In fact, the existence of an attractor in the D-dimensional phase space is not assumed. The only condition for the applicability of the BP method is a very weak stationary assumption: for k ≤D, the probability for xt<xt+k should not depend on t. For review of BP’s methodology and its mul-tidisciplinary applications, see Zanin et al.42and references therein.
In this work, the normalized Shannon entropy HS
and the statistical complexity measures CJS [Eq. (2)] are
estimated using the ordinal pattern probability distribution
P= {p(πi), i=1,. . ., D!}. Defined in this way, these quanti-fiers are usually known as permutation entropy and permuta-tion statistical complexity. They characterize the diversity and correlational structure, respectively, of the orderings present in the complex time series. The complexity-entropy causality plane (CECP) is defined as the two-dimensional (2D) diagram obtained by plotting permutation statistical complexity (verti-cal axis) versus permutation entropy (horizontal axis) for a
given system.34The term causality remembers the fact that
temporal correlations between successive samples are taken into account through the BP recipe used to estimate both information-theory quantifiers.
075511-4 Bariviera, Zunino, and Rosso Chaos 28, 075511 (2018) TABLE I. Data.
Cryptocurrency Acronym Reuters Instrument Code (RIC)
Bitcoin Cash BCH .MVBCH
Bitcoin BTC .MVBTC
Dash DASH .MVDASH
Ethereum Classic ETC .MVETC
Ethereum ETH .MVETH
IOTA IOT .MVIOT
LiteCoin LTC .MVLTC
NEO NEO .MVNEO
NEM XEM .MVXEM
Monero XMR .MVXMR
Ripple XRP .MVXRP
Zcash ZEC .MVZEC
V. DATA AND RESULTS
We use high-frequency price indices developed by MV Index Solutions (MVIS®). Data were obtained from Thomson Reuters Eikon terminal from one of the authors’ university. Data consist of 16 031 observations of price indices, for each of the 12 cryptocurrencies detailed in TableI. Data are equally spaced in time, being 5 minutes the time frame between each observation. The period under study spans from December 3, 2017, until February 14, 2018. This period is very inter-esting since cryptocurrencies exhibited an unprecedented rise and subsequent crash in their values. Consequently, it could be suitable to study the co-movement of different currencies for testing if the underlying dynamics of the different time series were the same.
In spite of the fact that Bitcoin is, undoubtedly, the most famous cryptocurrency, there are several hundreds of tradable instruments using a similar blockchain
tech-nology. As can be seen from Table II, the market is
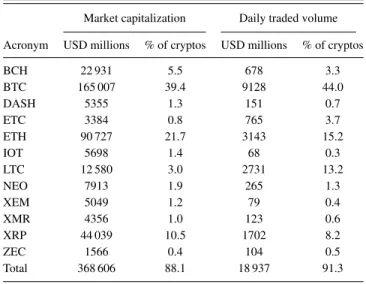
very concentrated. Our 12 selected cryptocurrencies account for 88% of total market capitalization and 91% of 24 hours traded volume, among the 897 ones detailed in the websitehttps://coinmarketcap.com/coins/views/all/.30
Conse-quently, our study covers most of the cryptocurrency market. One feature of this market is that its dynamics is very similar for all the assets under study. Figure1shows how the permutation entropy varies across time. Sliding windows of
size N =360 data points and stepδ =60 have been
imple-mented for the dynamical analysis. Behaviors are very similar
TABLE II. Market capitalization and 24-hour trading volume of the selected cryptocurrencies. Percentages represent the proportion of capi-talization or traded volume with respect to 897 cryptocurrencies. Own elaboration based on data fromhttps://coinmarketcap.com/coins/views/all/.
Market capitalization Daily traded volume
Acronym USD millions % of cryptos USD millions % of cryptos
BCH 22 931 5.5 678 3.3 BTC 165 007 39.4 9128 44.0 DASH 5355 1.3 151 0.7 ETC 3384 0.8 765 3.7 ETH 90 727 21.7 3143 15.2 IOT 5698 1.4 68 0.3 LTC 12 580 3.0 2731 13.2 NEO 7913 1.9 265 1.3 XEM 5049 1.2 79 0.4 XMR 4356 1.0 123 0.6 XRP 44 039 10.5 1702 8.2 ZEC 1566 0.4 104 0.5 Total 368 606 88.1 18 937 91.3
for all cryptocurrencies. This could reflect coherent dynamics of the different time series.
We can observe in Fig.2that time series mostly exhibit persistent behavior, reflected in a location in the CECP com-patible with fractional Brownian motions (fBm) with Hurst exponents between 0.5 and 0.7. Previous studies on BTC time series reported an enhanced informational efficiency in the period 2014-2016. Nevertheless, it seems that strong bull and bear markets could lead to more coordinated movements that reduce the informational efficiency.
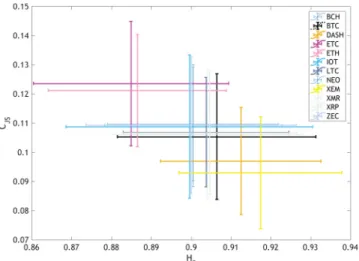
In order to verify if all cryptocurrencies follow the same stochastic process, we compute the sample mean and standard deviation of the information-theory quantifiers for each currency. We depict results in Fig.3. We observe that BTC occupies a central position among the other currencies. Additionally, there are some other currencies more and less efficient than BTC.
Taking into account that in our framework, informational
efficiency is maximal as HS[P] approaches 1 and CJS[P]
approaches 0, we compute the Euclidean distance of the mean permutation entropy and permutation statistical com-plexity of each currency to (H,C)=(1, 0), as a proxy for an informational efficiency ranking. Results are displayed in TableIII.
FIG. 1. Permutation entropy evolution associated with the selected cryptocurrencies during the observation period. Estimations were obtained by implementing sliding windows with the following parameters: D=4,τ=1, N=360, andδ=60.
FIG. 2. Location of the cryptocurrencies in the CECP computed using slid-ing windows with the followslid-ing parameters: D=4,τ=1, N=360, and
δ=60. Black and red crosses are mean and standard deviation of 500 frac-tional Brownian motion (fBm) simulations of 360 data points for the Hurst exponents indicated in the figure. Dashed lines represent the upper and lower bounds of the quantifiers as computed by Martín et al.25
FIG. 3. Mean and standard deviation of each cryptocurrency in the CECP during the observation period. Quantifiers were calculated by implementing sliding windows with the following parameters: D=4,τ=1, N=360, and
δ=60.
TABLE III. Informational efficiency ranking.
Ranking position Cryptocurrency efficiency measure d[(H,C)−(1, 0)]
7 BCH 0.1477 3 BTC 0.1409 2 DASH 0.1306 12 ETC 0.1688 11 ETH 0.1660 8 IOT 0.1480 6 LTC 0.1438 9 NEO 0.1481 1 XEM 0.1244 5 XMR 0.1431 4 XRP 0.1431 10 ZEC 0.1482
FIG. 4. Anova analysis. Difference of mean permutation entropy for each cryptocurrency with respect to BTC. Red lines indicate currencies whose mean permutation entropy is different from BTC (at 1% significance for ETC, ETH, and XEM, and 5% level for IOT).
One important finding of this paper is that informational efficiency is not related to currency size. In fact, BTC, by far the largest cryptocurrency in terms of capitalization and daily turnover, is not the most efficient one. Additionally, we com-pute Spearman’s rho, a non-parametric correlation measure,
between our efficiency measure displayed in Table III and
market capitalization and daily turnover informed in TableII. Spearman’s rho of the efficiency measure against market capitalization is 0.1748 (p-value 0.5868), and against daily traded volume is 0.1225 (p-value 0.7042). In both cases, the association is not statistically significant.
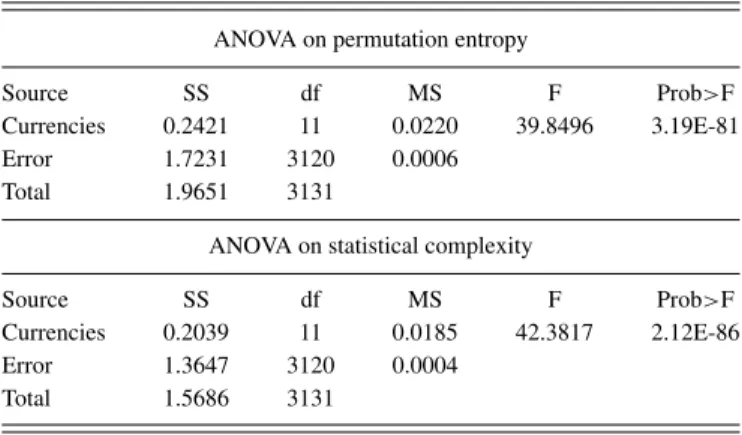
We also test using ANOVA if the mean permutation entropy and mean permutation statistical complexity are equal for all cryptocurrencies. Results are displayed in TableIV, and we cannot accept the null hypothesis of equal mean values for either of the quantifiers among cryptocurrencies. Sec-ond, we perform ANOVA analysis for each currency vis-à-vis
FIG. 5. Anova analysis. Difference of mean statistical complexity for each cryptocurrency with respect to BTC. Red lines indicate currencies whose mean statistical complexity is different from BTC (at 1% significance level).
075511-6 Bariviera, Zunino, and Rosso Chaos 28, 075511 (2018) TABLE IV. Anova analysis to test the equality of means among all
cryptocur-rencies.
ANOVA on permutation entropy
Source SS df MS F Prob>F
Currencies 0.2421 11 0.0220 39.8496 3.19E-81
Error 1.7231 3120 0.0006
Total 1.9651 3131
ANOVA on statistical complexity
Source SS df MS F Prob>F
Currencies 0.2039 11 0.0185 42.3817 2.12E-86
Error 1.3647 3120 0.0004
Total 1.5686 3131
BTC. Results are displayed in Figs.4and5. We observe that there are seven cryptocurrencies (displayed in light gray in the figures), whose mean entropic and complexity behavior is indistinguishable form BTC (displayed in blue in the figures). However, we reject the null hypothesis of equal mean per-mutation entropy of BTC, with respect to ETC, ETH, IOT,
and XEM (displayed in red in Fig. 4). We also reject the
null hypothesis of equal permutation statistical complexity of BTC, with respect to DASH, XEM, ETC, and ETH (dis-played in red in Fig.5). If we analyze these results together with the graphical representation of mean values of Fig. 3, we conclude that ETC and ETH are less efficient (more per-sistent), while DASH and XEM are more efficient than BTC. Actually, DASH and XEM dynamics are closer to a random walk behavior. One of the reasons for such behavior of ETC and ETH could be found in the fact that these cryptocurren-cies were not created with the aim of substituting paypal-like systems. Ethereum’s goal is using a blockchain for “smart contracts,” i.e., to replace internet third parties in order to validate trusted operations.1
Additionally, XEM and DASH appear as the most effi-cient cryptocurrencies. In this case, the reason could be found in the validation design. Both currencies introduced different ways of validating blocks. XEM introduced a proof-of-importance (POI) algorithm, and an Eigentrust++ reputation system in order to check operations. Unlike BTC, DASH is comprised of three types of “levels,” with specific roles and responsibilities on the network. In addition, from the beginning the evolution, changes or upgrades in the cur-rency can be proposed by anyone, establishing a decentralized governance by blockchain. This situation could generate fairer transactions, which leads to a more efficient market.
VI. CONCLUSIONS
We studied high-frequency data of the cryptocurrency market during a very special period of boom and bust. Our paper reports detailed behaviors of the 12 most important cryptocurrencies, which cover 88% of market capitalization and over 91% of daily turnover. We detect that the major-ity of the currencies exhibit a similar behavior, compatible with some kind of persistent stochastic dynamics with Hurst exponents between 0.5 and 0.7. However, we can identify four cryptocurrencies whose behaviors are different from the
rest. ETC and ETH exhibit more persistent behavior than the others, reflected in smaller mean permutation entropies and larger mean statistical complexities. On the contrary, DASH and XEM average behaviors are closer to a random walk. Our results uncover that, inside the cryptocurrency ecosys-tem, distinct behaviors emerge. Even though the majority of the market follows the behavior of the leader (BTC), some alternative cryptocurrencies follow differentiated dynamics, which could indicate that these assets are not as homoge-neous as expected. The reason for such behavior could be found in the special characteristics of these currencies. Unlike BTC, the aim of ETC and ETH is to be a vehicle for “smart contracts” rather than a virtual currency system. Regarding DASH and XEM, they introduced some innovations in the blockchain ecosystem and, consequently, investors could see them as more reliable assets.
ACKNOWLEDGMENTS
L.Z. and O.A.R. acknowledge the financial support from Consejo Nacional de Investigaciones Científicas y Técnicas (CONICET), Argentina.
1Seehttps://www.coindesk.com/information/what-is-ethereum/ for “What is ethereum?,” accessed 2018-06-04.
2J. Alvarez-Ramirez, E. Rodriguez, and G. Espinosa-Paredes, “Is the US stock market becoming weakly efficient over time? Evidence from 80-year-long data,”Physica A391, 5643–5647 (2012).
3C. Bandt and B. Pompe, “Permutation entropy: A natural complexity measure for time series,”Phys. Rev. Lett.88, 174102 (2002).
4A. Bariviera, M. Guercio, L. Martinez, and O. Rosso, “A permutation information theory tour through different interest rate maturities: The libor case,”Philos. Trans. R. Soc. Lond. A373, 20150119 (2015).
5A. F. Bariviera, “The influence of liquidity on informational efficiency: The case of the Thai Stock Market,”Physica A390, 4426–4432 (2011). 6A. F. Bariviera, “The inefficiency of Bitcoin revisited: A dynamic
approach,”Econ. Lett.161, 1–4 (2017).
7A. F. Bariviera, M. J. Basgall, W. Hasperué, and M. Naiouf, “Some stylized facts of the Bitcoin market,”Physica A484, 82–90 (2017).
8A. F. Bariviera, M. Guercio, L. Martinez, and O. Rosso, “The (in)visible hand in the libor market: An information theory approach,”Eur. Phys. J. B
88, 208 (2015).
9A. F. Bariviera, M. B. Guercio, and L. B. Martinez, “A comparative anal-ysis of the informational efficiency of the fixed income market in seven european countries,”Econ. Lett.116, 426–428 (2012).
10A. F. Bariviera, L. Zunino, M. B. Guercio, L. B. Martinez, and O. a. Rosso, “Revisiting the European sovereign bonds with a permutation-information-theory approach,”Eur. Phys. J. B86, 509 (2013).
11E.-T. Cheah and J. Fry, “Speculative bubbles in Bitcoin markets? An empir-ical investigation into the fundamental value of Bitcoin,”Econ. Lett.130, 32–36 (2015).
12Coinmarket, “Crypto-Currency Market Capitalizations,” 2017, see
https://coinmarketcap.com/currencies/; accessed 27 December 2017. 13M. M. Dryden, “Short-term forecasting of share prices: An Information
Theory approach,”Scott. J. Polit. Econ.15, 227–249 (1968).
14E. F. Fama, “Tomorrow on the New York stock exchange,”J. Bus.38, 285–299 (1965).
15E. F. Fama, “Efficient capital markets: A review of theory and empirical work,”J. Finance25, 383–417 (1970).
16D. P. Feldman, J. P. Crutchfield, “Measures of statistical complexity: Why?,”Phys. Lett. A238, 244–252 (1998).
17D. P. Feldman, C. S. McTague, and J. P. Crutchfield, “The organization of intrinsic computation: Complexity-entropy diagrams and the diversity of natural information processing,”Chaos18, 043106 (2008).
18J. M. Finn, J. D. Goettee, Z. Toroczkai, M. Anghel, and B. P. Wood, “Esti-mation of entropies and dimensions by nonlinear symbolic time series analysis,”Chaos13, 444–456 (2003).
19K. Keller and M. Sinn, “Ordinal analysis of time series,”Physica A356, 114–120 (2005).
20J. H. Kim, A. Shamsuddin, and K. -P. Lim, “Stock return predictability and the adaptive markets hypothesis: Evidence from century-long U.S. data,” J. Empir. Finance18, 868 (2011).
21T. Kim, “On the transaction cost of Bitcoin,” Finance Res. Lett. 23, 300–305 (2017).
22P. W. Lamberti, M. T. Martín, A. Plastino, and O. A. Rosso, “Intensive entropic non-triviality measure,”Physica A334, 119–131 (2004). 23R. López-Ruiz, H. L. Mancini, and X. Calbet, “A statistical measure of
complexity,”Phys. Lett. A209, 321–326 (1995).
24M. Martín, A. Plastino, and O. Rosso, “Statistical complexity and disequi-librium,”Phys. Lett. A311, 126–132 (2003).
25M. T. Martín, A. Plastino, and O. A. Rosso, “Generalized statistical com-plexity measures: Geometrical and analytical properties,”Physica A369, 439–462 (2006).
26E. Martina, E. Rodriguez, R. Escarela-Perez, and J. Alvarez-Ramirez, “Multiscale entropy analysis of crude oil price dynamics,”Energy Econ.
33, 936–947 (2011).
27K. Mischaikow, M. Mrozek, J. Reiss, and A. Szymczak, “Construction of symbolic dynamics from experimental time series,”Phys. Rev. Lett.82, 1144–1147 (1999).
28S. Nadarajah and J. Chu, “On the inefficiency of Bitcoin,”Econ. Lett.150, 6–9 (2017).
29S. Nakamoto, “Bitcoin: A Peer-to-Peer Electronic Cash System,” 2009, see
https://bitcoin.org/bitcoin.pdf/; accessed 27 December 2016. 30Accessed 14/02/2018.
31A. Ortiz-Cruz, E. Rodriguez, C. Ibarra-Valdez, and J. Alvarez-Ramirez, “Efficiency of crude oil markets: Evidences from informational entropy analysis,”Energy Policy41, 365–373 (2012).
32G. E. Powell and I. C. Percival, “A spectral entropy method for distin-guishing regular and irregular motion of hamiltonian systems,”J. Phys. A
12, 2053 (1979).
33O. A. Rosso, S. Blanco, J. Yordanova, V. Kolev, A. Figliola, M. Schür-mann, and E. Ba¸sar, “Wavelet entropy: A new tool for analysis of short duration brain electrical signals,”J. Neurosci. Methods105, 65–75 (2001).
34O. A. Rosso, H. A. Larrondo, M. T. Martin, A. Plastino, and M. A. Fuentes, “Distinguishing noise from chaos,”Phys. Rev. Lett.99, 154102 (2007). 35P. M. Saco, L. C. Carpi, A. Figliola, E. Serrano, and O. A. Rosso,
“Entropy analysis of the dynamics of el niño southern oscillation during the holocene,”Physica A389, 5022–5027 (2010).
36P. A. Samuelson, “Proof that properly anticipated prices fluctuate ran-domly,” Ind. Manage. Rev. 6, 41–49 (1965).
37C. E. Shannon and W. Weaver, The Mathematical Theory of
Communica-tion (University of Illinois Press, Champaign, IL, 1949).
38M. C. Soriano, L. Zunino, O. A. Rosso, I. Fischer, and C. R. Mirasso, “Time scales of a chaotic semiconductor laser with optical feedback under the lens of a permutation information analysis,”IEEE J. Quantum Electron.
47, 252–261 (2011).
39H. Theil and C. T. Leenders, “Tomorrow on the Amsterdam stock
exchange,”J. Bus.38, 277–284 (1965).
40A. Urquhart, “The inefficiency of Bitcoin,”Econ. Lett.148, 80–82 (2016). 41A. Urquhart, “Price clustering in Bitcoin,” Econ. Lett. 159, 145–148
(2017).
42M. Zanin, L. Zunino, O. A. Rosso, and D. Papo, “Permutation entropy and its main biomedical and econophysics applications: A review,”Entropy14, 1553–1577 (2012).
43L. Zunino, A. F. Bariviera, M. B. Guercio, L. B. Martinez, and O. A. Rosso, “On the efficiency of sovereign bond markets,”Physica A391, 4342–4349 (2012).
44L. Zunino, M. C. Soriano, I. Fischer, O. A. Rosso, and C. R. Mirasso, “Permutation-information-theory approach to unveil delay dynamics from time-series analysis,”Phys. Rev. E82, 046212 (2010).
45L. Zunino, B. M. Tabak, F. Serinaldi, M. Zanin, D. G. Pérez, and O. A. Rosso, “Commodity predictability analysis with a permutation information theory approach,”Physica A390, 876–890 (2011).
46L. Zunino, M. Zanin, B. M. Tabak, D. G. Pérez, and O. A.
Rosso, “Complexity-entropy causality plane: A useful approach to quantify the stock market inefficiency,” Physica A 389, 1891–1901 (2010).