Inter-American Development Bank Banco Interamericano de Desarrollo
Latin American Research Network Red de Centros de Investigación Research Network Working Paper #R-461
Privatization in Bolivia:
The Impact on firm performance
by
Mauricio Garrón B.
Carlos Gustavo Machicado
Katherina Capra
Unidad de Análisis de Políticas Sociales y Económicas (UDAPE)
Cataloging-in-Publication data provided by the Inter-American Development Bank
Felipe Herrera Library
Garrón B., Mauricio.
Privatization in Bolivia : the impact on firm performance / by Mauricio Garrón B., Carlos Gustavo Machicado, Katherina Capra.
p. cm. (Research Network Working papers ; R-461) Includes bibliographical references.
1. Privatization--Bolivia. 2. Manufacturing industries--Bolivia. I. Machicado, Carlos Gustavo II. Capra, Katherina. III. Inter-American Development Bank. Research Dept. IV. Latin American Research Network. V. Series.
338.61 P7872--dc21
©2003
Inter-American Development Bank 1300 New York Avenue, N.W. Washington, DC 20577
The views and interpretations in this document are those of the authors and should not be attributed to the Inter-American Development Bank, or to any individual acting on its behalf.
This paper is part of the Latin American Research Network project “Costs and Benefits of Privatization in Latin America.” The terms of reference for the project can be found on the internet at: http://www.iadb.org/res/laresnetwork/studies/st70tor.pdf
The Research Department (RES) produces a quarterly newsletter, IDEA (Ideas for
Development in the Americas), as well as working papers and books on diverse economic issues. To obtain a complete list of RES publications, and read or download them please visit our web site at: http://www.iadb.org/res
Abstract*
This report studies the change in performance of Bolivian State Owned Enterprises (SOEs) that have been transferred to the private sector. The paper focuses particularly on how ownership affects management by measuring the characteristics of management and relating them to both ownership structure and performance. It argues that the characteristics of private management that follow privatization are a key factor in determining the effects of privatization on performance. To determine the impact of privatization on the performance of the 31 firms studied, the authors performed two ratio analyses, one with unadjusted and the other with adjusted ratios. For this purpose, they undertook two regression analyses, one with panel data and the other with a cross section analysis. Two methods were used to conduct privatization of Bolivian SOEs, and the process took place in three stages. The methods were traditional, or standard, privatization and capitalization. Traditional privatization consisted of the complete transfer (assets and shares) to the private sector of companies operating in competitive markets. Capitalization involved attracting private firms to invest in and manage key SOEs. SOEs were not sold outright. Instead, private investors gained managerial control but no more than 50 percent of equity.
Keywords: Privatization, Capitalization, Firm Performance, Corporate Governance
JEL Classification: D61, G34, L25
* The authors gratefully acknowledge Alberto Chong, Florencio López-de-Silanes and other participants in the October, 2001 IDB Seminar in Montevideo for their comments. The authors also thank Rodney Pereira for the institutional support and Paola Espinoza and Jesús Mogrovejo for providing skillful research assistance.
1. Introduction
Ever since Britain embarked on a major privatization effort in 1979, the transfer of state-run companies to private hands has been fashionable throughout the world. Privatization, or the transfer of State-Owned Enterprises (SOEs) to the private sector, was commonly associated with a new vision of the State’s economic role that gained currency in the 1990s. This new view favored an increased role in the economy for markets and the private sector, and a corresponding reduction of the State’s involvement in the production of goods and services. Privatization came into vogue just as Latin American nations began to recognize that the State’s involvement in production activities failed to deliver the promised results. The acceptance of privatization meant the abandonment of the import substitution paradigm that had been in place in the region for decades.
Bolivia, like many other Latin American countries, adopted privatization and has begun the process of transferring SOEs to the private sector. While the privatization process in Bolivia is small by international standards, both in terms of number and size of firms, the Bolivian privatization process has some particular characteristics that render its analysis of interest.
Bolivian privatization is unique for its use of two different techniques to transfer SOEs to the private sector: standard privatization (the outright sale of the enterprises) and capitalization. Capitalization differs from traditional privatization in that ownership is not transferred entirely to the strategic private investor. While the private investor owns a controlling share of the enterprise, the Bolivian population, represented by an institutional investor, owns a significant part of the shares.
Even though privatization processes have been adopted in most Latin American countries and in many of the former communist countries, relatively little analysis of the impact of privatization has been conducted. Most of the literature on privatization tends to be descriptive or to concentrate on case studies. Nevertheless, in recent years, the body of literature assessing the impact of privatization has grown as different studies, increasingly more sophisticated and ambitious, have been undertaken. The general lessons emerging from this new body of literature suggest that this type of analysis is worth pursuing, albeit with some qualifications.
The existing literature on Bolivian privatization is relatively scarce and tends to be descriptive. The capitalization process has sparked a significant number of articles both inside and outside Bolivia. Most, however, only describe the process, and a few clearly seek to further political positions rather than understand the consequences of transfers. Thus, much remains to be done in order to understand privatization’s impact on Bolivia.
Following some recent studies on privatization, in particular La Porta and Lopez-de-Silanes (1999), this study attempts to establish whether former SOEs have improved their performance as a result of changed ownership structure. Ownership can be seen influencing performance inasmuch as different ownership structures may be associated with: i) different objectives, ii) different constraints, and iii) different management characteristics. Thus, the underlying theme of this report is the relationship between ownership structure (public or private) and performance.
Many arguments can be put forth to explain, from a theoretical perspective, why privatizing an enterprise could lead to improved performance. One would expect, and the literature assumes, that private ownership leads to: i) a more precise definition of objectives (i.e., adopting objectives more closely associated with firm performance instead of the multiple, disparate objectives commonly found among public enterprises), ii) the relaxation of certain constraints (such as those that limit access to financing) and iii) certain management characteristics. Given that the first two have an impact on management, the style of private management becomes a key factor in determining the effects of privatization on performance.
In general, it is implicitly assumed that private firms have very similar objectives, constraints and management characteristics. While this assumption holds up in the cases of midsize or large publicly-held and traded corporations, it might not necessarily apply to the case of smaller private firms with different ownership structures. In particular, small family-owned firms may not face conditions that require them to operate with the discipline and controls required of publicly-traded firms.
Furthermore, such firms may have a wider range of objectives (i.e., not focus exclusively on maximizing shareholder value) and may in some respects be more severely constrained (e.g., find access to financing more difficult) than publicly-traded private firms.
Whether those differences are strong enough to translate into differences in management, and, in turn, into differences in performance must be determined empirically. However, given the size and nature of many of the firms considered in this study, special attention is given to the manner in which ownership affects management. In order to do this, the authors attempted to measure the characteristics of management by relating them to both ownership structure and performance.
The remainder of the paper is structured as follows. Section 2 presents a review of the conceptual framework upon which privatization processes have been based, as well as the different arguments for and against privatization. It also presents some of the empirical work undertaken to evaluate privatization processes and their applicability to the Bolivian case.
Section 3 describes the specific privatization processes carried out in Bolivia. The two methods took place over three “waves” coinciding with three different governmental periods. It also reviews the existing studies on privatization in Bolivia and describes the effort made to collect information for the present study, with an emphasis on the limitations and quality of available information.
Section 4 discusses the universe of firms considered in the study as well as the criteria employed to determine the sample. Section 5 describes the information utilized in the empirical analysis and presents the results obtained in the ratio analyses.
Section 6 presents the results obtained in the analysis of panel data as well as a cross-section analysis. Finally, the last section presents a summary of the main results.
2. Privatization: The Conceptual Framework
Privatization is generally defined as the transfer of assets and/or service functions from public to private hands. Such a broad definition allows for a wide range of transfers to fall under the term privatization. For the purposes of this study, the authors narrow the definition of privatization to any sale of SOEs in which private buyers obtain a controlling interest and assume management of the firm.
The transfer of SOEs, whereby the State trades its ownership claim for an explicit cash payment, can take different forms depending on the method of sale and the share of claims sold. In this study, two forms are considered to reflect the two methods adopted for
the Bolivian privatization process. The first one is the direct sale of an SOE to an individual, a group of investors, or an existing corporation. The second one, somewhat analogous to a share issue privatization, has been called capitalization and is a transfer of part of the State’s stake in an SOE to investors in exchange for their commitment to increase the capital of the firm. In both cases, management comes under the control of private investors.1
2.1 Objectives Pursued Under Privatization
There are many reasons for embarking on the privatization process. A number of different objectives, displayed in Table 1, are usually mentioned in the privatization literature. The objectives range from economic (with either a micro or macroeconomic emphasis) to political. These objectives can also be viewed from the perspective of firms and consumers.
Table 1: Sample of Most Common Privatization Objectives
Economic
Achieve higher productivity and efficiency
Strengthen the role of the private sector in the economy Improve the public sector’s financial health
Provide autonomy to satisfy financing requirements
Political
Remove the enterprise from political interference Free resources for allocation to other priority areas
Make it possible for employees to participate as shareholders
Firm Oriented
Improve performance (associated with efficiency argument)
Consumer Oriented
Improve services and/or goods (lower prices and better quality)
Given the variety of objectives, it seems appropriate to follow Sheshinski and López’s (1999) argument that a privatization program should be evaluated by whether or not the original objectives of the privatization were achieved. It is readily apparent, however, that many of these objectives are interrelated.
1
For the purpose of this study, both cases are considered privatization. The authors use the term “transfer of SOEs” when they want to emphasize the difference between them.
In the case of Bolivia’s privatization process, more than one of the listed objectives applies. Nevertheless, as a first attempt at evaluating the Bolivian privatization program, and in concordance with the IDB project, it is appropriate for this paper to follow the literature (Nellis, 1991; Moore, 1990; Wiltshire, 1987; Carney, 1993 and others) that assumes the main objective behind the privatization effort was increased efficiency of the privatized firm’s use of resources. In terms of individual privatized firms, this means improved performance.
2.2 The Arguments For and Against Privatization
In recent years, developments in the fields of contract theory and property theory (Shleifer, 1998) have brought researchers’ attention to the debate regarding public versus private provision of goods and services.
According to contract theory, the government could, in principle, draw up a contract with requirements to ensure that the contractor delivers the desired results.2 According to this view, whether the service is provided by a public or private entity is irrelevant since compliance with the contract guarantees that the government’s objectives will be met; however, the question of whether it is possible to draw up a “perfect contract” remains unanswered.3
On the other hand, through its argument that contracts are imperfect or incomplete, property theory emphasizes asset ownership as the foundation for control of the management of the business. Furthermore, the control that owners possess, manifested through the incentive structure they have defined, influences managers and affects their performance.4
Two opposing views, the “Social View” and the “Agency View,” have recently gained prominence. The existence of market failures, which under imperfect competition enables the exercise of monopoly power, gives rise to the need for public intervention. The focus on market failures and the concurrent argument that public ownership allows for consideration of marginal social costs, has been called the “Social View.”
2A contract that includes all known and unknown eventualities is called a “perfect contract.”
On the other hand, a key argument in favor of privatization is the assumption that state-owned companies pursue too many objectives (political, social and economic), which impedes the application of any of the previous theories. As a result, the so-called “Agency View” incorporates the problems of incentives and contracts agreed upon between firms as elements relevant to improved efficiency on the microeconomic level (Sheshinski and López-Calva, 1999).
Within the “Agency View,” there are two viewpoints that attempt to explain why public firms generate inadequate incentives, which result in poorer performance than private firms. These viewpoints are called the business management perspective and the political perspective.5
The business management perspective argues that monitoring managers is less effective in public firms, thus public ownership results in fewer incentives for improved performance as compared to private firms. The political perspective, meanwhile, asserts that the lower efficiency of public enterprises can be blamed on the presence of multiple objectives and constraints that incorporate non-economic considerations, such as politically-influenced budgets. Thus, privatization can promote efficiency by focusing the enterprise’s objectives (i.e., reducing the number and ambiguity of the objectives set forth for a public enterprise) and by removing the distortions caused by the constraints facing the enterprise (Commander and Killick, 1988).
2.3 Empirical Studies on Privatization
To date, empirical analysis of privatization has been conducted primarily from a microeconomic perspective. Individual characteristics of firms before and after privatization are compared; analysis usually focuses on the use of ratios to measure firm performance.
Obtaining reliable financial balances, however, has proven to be the principal problem researchers face when performing such an analysis. This is especially true in
4 Some extensions to these two initial arguments analyze the relationship between property, efficiency and contracts more deeply. These include: Agency Theory, Public Choice Theory, Property Rights Theory and Transactions Costs Analysis (Commander and Killick, 1988, and Hodge, 1999, among others).
5For the management perspective, see Vickers and Yarrow (1988). For the political perspective, see Shapiro
developing countries where the public management of firms was not sufficiently documented to provide exact information regarding their status. As a result, the literature available on this topic is scarce.
In an attempt to answer the question of whether privatization has improved firm performance, the majority of the studies in this area have adopted the agency view. The existing empirical literature can be classified into three broad groups:
• Case Studies (Performed by sector and specific firms): This group includes studies such as Ramamurti (1997), D’Souza (1998), Eckel, Eckel and Singal (1997) and Newberry and Pollitt (1997). The first two studies found that privatization in specific sectors (trains and telecommunications, respectively) increased productivity and reduced the workforce. In addition, Eckel, Eckel and Singal (1997) shows that after the privatization of a state enterprise (in this case British Airways), sector prices fell. Finally, Newberry and Pollitt found that the people who benefit from privatization are the producers and shareholders, while consumers and the government do not benefit.
• Inter-Country Studies (Based upon large samples of firms in different sectors and for a specific country): This group encompasses studies by Martín and Parker (1995), Barberis, Boycko, Shleifer, and Tsukanova (1996), Claessens, Djankov, and Pohl (1997) and La Porta and Lopez-de-Silanes (1997), among others. These studies found that privatized firms improved their performance, that change in management (new owners and administrators) contributed to higher value of the firms, and that the improvement in the profitability of the businesses was largely explained by improvements in productivity rather than by higher sale prices or reductions in the labor force.
• Cross-Section Studies (analysis of firms across countries): Some of the studies applying this methodology are Galal, Jones, Tandon, and Vogelsang (1992), Megginson, Nash, and Van Randenborgh
(1994), Frydman, Gray, Hessel, and Rapaczynski (1998), and Boubakri and Cosset (1998). In general, these studies find improved performance in the privatized companies.
However, Pohl, Claessens and Djankov (1997), working with a sample of 6,300 firms, show that the positive effects of privatization on corporate performance are not uniform among different types of firms and performance measures. These authors conclude that one cannot generalize that privatization brings about an improvement in firms’ performance.
To these studies, other recent research placing more emphasis on the nature of firm management must be added. This recent research attempts to gauge the extent to which the transfer of ownership to the private sector is the key element in improved firm performance. These studies analyze the problem using agency models, where the ownership structure is represented through different principal-agent arrangements.
They distinguish two types of property: “Disperse Ownership,” where the owner-administrator relationship is the central problem of corporate governance, and “Concentrated Ownership,” where the central problem is the majority shareholder-minority investor relationship.
These studies follow the work of Schleifer and Vishny (1997), who define the problem of corporate governance as one of external financing. A functional system of corporate governance is one where concentrated ownership exists and promotes profit- maximizing behavior, and where a legal framework is in place to protect suppliers of external financing. In this vein, La Porta et al. (1998) analyzed the differences in the legal framework and found that the historical beginnings of the legal system determined the level of protection provided to investors. Greater legal protection implied a lower need for property concentration, which in turn increased access to external financing and reduced capital costs. Mayer (1998) analyzed two central elements of the agency vision of corporate governance: investment patterns in economies with advanced markets and the disciplinary mechanisms applied to managers in companies with poor performance. The author concluded that property and control did not affect financing sources or disciplinary methods, but they did influence other activities within the firm.
2.4 The Applicability of Recent Studies to Bolivia
Recent studies on privatization attempt to establish whether former SOEs have improved their performance as a result of ownership change. Thus, the underlying theme in the empirical literature on privatization and its effects is the relationship between ownership (public vs. private) and performance. When looking at this relationship, it is necessary to pay attention to two issues: the choice of performance measures, and the means through which ownership affects performance.
Most of the growing literature on privatization adopts measures such as those utilized by La Porta and López-de-Silanes (1997). In doing so, they adopt two implicit assumptions with implications that, for purposes of the privatization of Bolivian enterprises, deserve to be considered.
First, the measures implicitly assume that the objective of the privatizations studied, and hence the yardstick by which they should be evaluated, is improved firm performance. The importance of this assumption arises from the possibility that public and private firms will have different objectives. Private firms tend to focus more on efficiency and performance, while public enterprises may have other, more diffuse objectives. It is no surprise, then, that private firms fare better under a measure that emphasizes performance.
The second assumption is that management characteristics are similar for all private firms (vis-à-vis public ones) regardless of their ownership structure. The importance of this second assumption should be explained clearly. Since performance depends on management characteristics (which in turn reflect objectives and constraints), ownership influences performance inasmuch as different ownership structures may be associated with different management characteristics. When considering privately-owned firms, one cannot assume similar ownership structure since in reality, a wide variety of ownership structures can be observed. The fact that most empirical studies have focused on firms whose stock trades publicly means that the ownership structure of the private firms considered in those studies is similar. Thus, there is no need to look explicitly at management characteristics. If, however, the ownership structures of private firms happen to be different, as in the group of firms analyzed in this paper, closer attention must be paid to the relationship between ownership structure and management characteristics. In particular, attention must be focused on whether different types of ownership structures—corporations, widely held
enterprises, or smaller, family-owned businesses—lead to similar or different management characteristics.
3. The Bolivian Experience with Privatization
3.1 The Privatization EffortsPrior to 1992, the Bolivian government sought increased private involvement in certain traditionally public sectors by undertaking shared risk contracts. These contracts stipulated that the State would transfer the SOE’s existing assets to a private administration that would oversee the necessary investments for the development of the business. Within this framework, the State would receive a flat fee and the private firm would have a claim to any residual profits. The first shared-risk contracts were signed in the 1980s in the sectors of mining and hydrocarbons, two sectors in which this practice continues to the present day. Subsequently, in the 1990s the transfer of SOEs to the private sector in Bolivia took place through two schemes and in three “waves.” The two scehmes were traditional, or standard, privatization and capitalization. The three waves correspond to three different governments6 and refer to periods in which renewed impetus was given to the privatization effort. The first wave started in 1992 with the enactment of the Privatization Law.7 The second wave, which introduced “Capitalization,” began in 1995. Finally, the third wave, which reinstated standard privatization of SOEs, started in 1998. The firms privatized in this third wave were not included in the study since not enough time has passed for the effects of the change in ownership to be fully observed.
First Wave
With the April 1992 enactment of the Privatization Law, Bolivia started to privatize its public enterprises. This process was characterized by the complete transfer (assets and shares) of companies that operated in competitive markets and were considered “small”
6 The governments of Jaime Paz Zamora (1989-1993), Gonzalo Sánchez de Lozada (1993-1997), and Hugo Banzer Suárez (1997-2001).
businesses. These SOEs participated in a wide range of activities, including flour collection, hotels, bus terminals, milk processing, and others.8
The objectives of these privatizations were to: i) reduce the public sector deficit, ii) transfer productive activities to the private sector, and iii) direct the proceeds of the privatization to social investment through programs in health, education, and basic infrastructure.
Under this wave, 34 SOEs considered non-performing and engaged in activities that could be assumed by the private sector were privatized. The majority of these enterprises were not making a profit and, in most cases, did not fully utilize their installed capacity.
In addition, most SOEs employed an excess of personnel and received government subsidies (Ministry of Capitalization, 1994). The table below lists the 34 SOEs transferred to the private sector up to 1993.
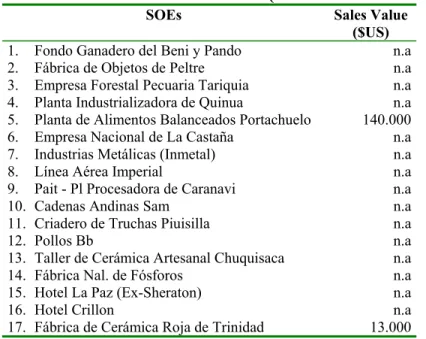
Table 2: First Wave of Privatization (Traditional Method)
SOEs Sales Value
($US)
1. Fondo Ganadero del Beni y Pando n.a 2. Fábrica de Objetos de Peltre n.a 3. Empresa Forestal Pecuaria Tariquia n.a 4. Planta Industrializadora de Quinua n.a 5. Planta de Alimentos Balanceados Portachuelo 140.000 6. Empresa Nacional de La Castaña n.a 7. Industrias Metálicas (Inmetal) n.a 8. Línea Aérea Imperial n.a 9. Pait - Pl Procesadora de Caranavi n.a 10. Cadenas Andinas Sam n.a 11. Criadero de Truchas Piuisilla n.a 12. Pollos Bb n.a 13. Taller de Cerámica Artesanal Chuquisaca n.a 14. Fábrica Nal. de Fósforos n.a 15. Hotel La Paz (Ex-Sheraton) n.a 16. Hotel Crillon n.a 17. Fábrica de Cerámica Roja de Trinidad 13.000
SOEs Sales Value ($US)
18. Fábrica de Cerámica Roja de Cobija 110.000 19. Hotel Prefectural Liriuni n.a 20. Centro de Acopio Yamparaez 24.200 21. Centro de Acopio Redención Pampa 18.000 22. Centro de Acopio Tomina 18.200 23. Hacienda Ganadera Santa Martha n.a 24. Hotel Prefectural de Caranavi 43.932 25. Cabaña Lechera Todos Santos Paz 938.550 26. Hotel Prefectural de Pando 98.900 27. Centro de Acopio Totora 15.000 28. Centro de Acopio Lourdes 1.400 29. Centro de Acopio Betanzos 8.477 30. Fabrica de Aceites Comestibles
Villamontes n.a 31. Fábrica Boliviana de Cerámica 1,287.000 32. Fábrica de Cerámica Roja de Oruro 173.000 33. Hotel Prefectural de Tarija n.a 34. Ingenio Azucarero Guabira n.a Source: Unidad de Reordenamiento.9
The government contracted consultancy firms and investment banks to conduct the necessary studies for the sales of relatively larger firms, such as valuation and sale-strategy recommendations. Independent consultants were employed to undertake the evaluation studies of the smaller businesses.
On the whole, enterprises transferred to the private sector under traditional privatization were sold through public auctions and public bidding processes. The first to be privatized were the smaller businesses (as measured by the number of employees and assets). The majority of these businesses were sold to only one buyer per firm, and by international standards, the size of the privatized firms was small. The base sale prices in the auction ranged from US$1,389 (a flour collection business) to US$10 million (a sugar factory).
The businesses were sold “as is,” with the State paying the social benefits of the workers in advance. In some cases, the workers were offered the option of purchasing shares in the business.
Second Wave
In the second wave, a second method of privatization was adopted. While some privatizations still consisted of the full transfer of ownership of assets, and hence management control of SOEs, the Bolivian government adopted a second method, called capitalization. Capitalization had particular features that are described in some detail later. Under the classic privatization model, 36 enterprises were transferred as follows:
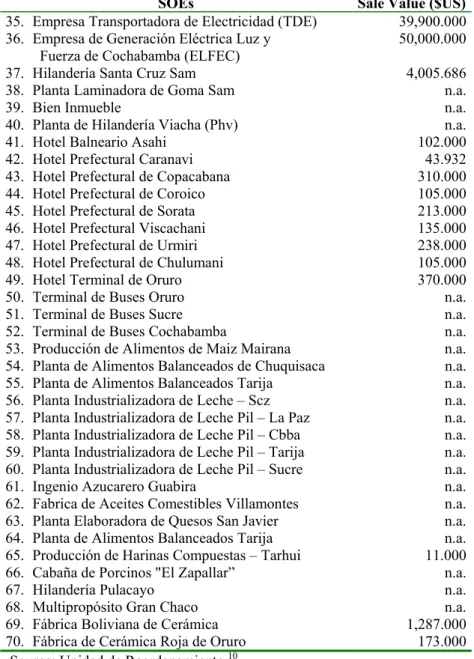
Table 3: Privatized Enterprises (Second Wave)
SOEs Sale Value ($US)
35. Empresa Transportadora de Electricidad (TDE) 39,900.000 36. Empresa de Generación Eléctrica Luz y
Fuerza de Cochabamba (ELFEC) 50,000.000 37. Hilandería Santa Cruz Sam 4,005.686 38. Planta Laminadora de Goma Sam n.a. 39. Bien Inmueble n.a. 40. Planta de Hilandería Viacha (Phv) n.a. 41. Hotel Balneario Asahi 102.000 42. Hotel Prefectural Caranavi 43.932 43. Hotel Prefectural de Copacabana 310.000 44. Hotel Prefectural de Coroico 105.000 45. Hotel Prefectural de Sorata 213.000 46. Hotel Prefectural Viscachani 135.000 47. Hotel Prefectural de Urmiri 238.000 48. Hotel Prefectural de Chulumani 105.000 49. Hotel Terminal de Oruro 370.000 50. Terminal de Buses Oruro n.a. 51. Terminal de Buses Sucre n.a. 52. Terminal de Buses Cochabamba n.a. 53. Producción de Alimentos de Maiz Mairana n.a. 54. Planta de Alimentos Balanceados de Chuquisaca n.a. 55. Planta de Alimentos Balanceados Tarija n.a. 56. Planta Industrializadora de Leche – Scz n.a. 57. Planta Industrializadora de Leche Pil – La Paz n.a. 58. Planta Industrializadora de Leche Pil – Cbba n.a. 59. Planta Industrializadora de Leche Pil – Tarija n.a. 60. Planta Industrializadora de Leche Pil – Sucre n.a. 61. Ingenio Azucarero Guabira n.a. 62. Fabrica de Aceites Comestibles Villamontes n.a. 63. Planta Elaboradora de Quesos San Javier n.a. 64. Planta de Alimentos Balanceados Tarija n.a. 65. Producción de Harinas Compuestas – Tarhui 11.000 66. Cabaña de Porcinos "El Zapallar” n.a. 67. Hilandería Pulacayo n.a. 68. Multipropósito Gran Chaco n.a. 69. Fábrica Boliviana de Cerámica 1,287.000 70. Fábrica de Cerámica Roja de Oruro 173.000 Source: Unidad de Reordenamiento.10
10 Again, the privatization books are incomplete and the information was not stored completely. Missing sale values are marked as not available (n.a).
“Capitalization,” meanwhile, aimed to attract private firms to invest and run key SOEs. The Capitalization Law was enacted in March 21, 1994 to enable the new technique.
Capitalization sought the following objectives: i) attract private investment on a large scale, ii) accelerate job creation, iii) transfer managerial control to the private sector in order to incorporate technological advances and management capacity, and iv) create a long-term saving mechanism to directly redistribute privatization revenue among the population, rather than using public programs for this end.
There were several ways in which capitalization differed from the previous privatization of SOEs. First, the private investor acquired only 50 percent, rather than 100 percent, of equity in the SOE, but were granted complete managerial control. Second, in contrast to a traditional privatization, no sale was involved; thus, the National Treasury did not receive any proceeds from the transfer.
Capitalization required an injection of capital into the enterprises under consideration. This method allowed private investors to obtain 50 percent ownership of an enterprise by committing to invest an amount equal to the market value of the existing enterprise. Thus, through this process the equity of the enterprise doubled, the private investor held 50 percent of the equity in the capitalized enterprise, and the State held the other 50 percent. The State’s percentage, which reflected the ownership of the pre-capitalized enterprise, was transferred as specified by the Capitalization Law in the form of non-transferable shares to newly established Private Pensions Funds.
The capitalization contracts specified the conditions under which the amounts committed by the private investor were to be invested. To make the enterprises more attractive, the SOEs’ commercial debts were transferred to the National Treasury (TGN). When applied to the largest, most strategic SOEs, this method of transfer resulted occasionally in the break-up of state monopolies. The State hydrocarbon enterprise, Yacimientos Petrolíferos Fiscales Bolivianos, which had its upstream units capitalized, was just such a case. Similarly, the generating units of ENDE, the national electric company, were capitalized individually, as were two units of railroad enterprise Empresa Nacional de Ferrocarriles (ENFE).
On the other hand, there were also state monopolies that were capitalized without breaking up. Such were the cases of the telecommunications enterprise, Empresa Nacional de Telecomunicaciones (ENTEL), and the national airline, Lloyd Aéreo Boliviano (LAB). As a result, a total of ten firms were capitalized:
Table 4: Capitalized Enterprises
Source: Unidad de Reordenamiento.
SOE Sale Value (US$)
71. Empresa Generadora de Electricidad (CORANI) 117.592.600 72. Empresa Nacional de Telecomunicaciones (ENTEL) 1.220.000.476 73. Empresa Ferroviaria Andina 26.502.000 74. Empresa Ferroviaria Oriental 51.706.197 75. Empresa Generadora de Electricidad (GUARACACHI) 94.262.000 76. Lloyd Aéreo Boliviano 94.949.999 77. Empresa Petrolera Andina 529.554.041 78. Empresa Petrolera Chaco 613.334.002 79. Transportadora de hidrocarburos (TRANSREDES) 526.999.999 80. Empresa Generadora de Electricidad (Valle Hermoso) 67.842.200
Capitalization was applied to enterprises that operated in non-competitive markets (monopolies). For the most part, these SOEs were public service providers and were the largest firms in operation in both the public and private sectors. These firms also employed the largest number of workers and, consequently, were home to the largest labor unions. All of these companies had productivity and efficiency indicators below international benchmarks before privatization, according to a study undertaken by the Ministry of Capitalization (1994).
To establish clear rules of the game for the capitalization process, the government modified the legal system through the passage of laws in the electricity (1994), telecommunications (1995), and hydrocarbons (1996) sectors.11 In addition, a regulatory framework for the sectors in which capitalized enterprises operate was established by creating the Sector Regulatory System (Sistema de Regulación Sectorial “SIRESE”), which
11 Within the strategic sectors mentioned, the transportation sector is the only one which does not yet have a Law of Transportation.
has five sector specific Superintendencies charged with regulating, controlling, and supervising all activities in the sector.12
Third Wave
The third wave of privatizations once again adopted the classical approach. This wave included the privatization of 14 SOEs, some of which were units of former state monopolies. The 14 SOEs privatized during this wave are listed below:
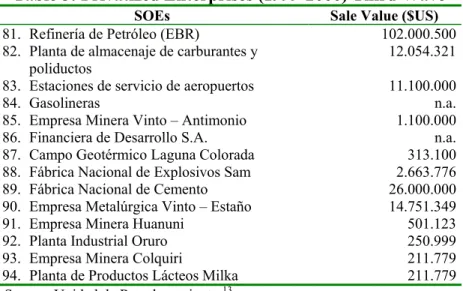
Table 5: Privatized Enterprises (1999-2000) Third Wave
Source: Unidad de Reordenamiento.13
SOEs Sale Value ($US)
81. Refinería de Petróleo (EBR) 102.000.500 82. Planta de almacenaje de carburantes y
poliductos
12.054.321 83. Estaciones de servicio de aeropuertos 11.100.000 84. Gasolineras n.a. 85. Empresa Minera Vinto – Antimonio 1.100.000 86. Financiera de Desarrollo S.A. n.a. 87. Campo Geotérmico Laguna Colorada 313.100 88. Fábrica Nacional de Explosivos Sam 2.663.776 89. Fábrica Nacional de Cemento 26.000.000 90. Empresa Metalúrgica Vinto – Estaño 14.751.349 91. Empresa Minera Huanuni 501.123 92. Planta Industrial Oruro 250.999 93. Empresa Minera Colquiri 211.779 94. Planta de Productos Lácteos Milka 211.779
3.2 Studies of Bolivian Privatization
Relatively little has been written about the privatization processes in Bolivia, especially in regards to the first privatization phase (1992). Many of the existing studies were prepared prior to the actual privatization process and thus concentrate on describing the theoretical advantages of privatization. More recent studies have focused primarily on the capitalized enterprises and tend to be descriptive in nature.
The most complete study describing Bolivia’s privatization process was prepared by the Ministry of Capitalization. A paper by Montero (1994), while not referring to privatization per se, provides some insight into the financial performance of some public
12 The Law for the Sector Regulatory System (SIRESE) was enacted in 1994. The SIRESE is a regulatory system composed of five sectoral superintendencies (electricity, hydrocarbons, telecommunications, transportation and water and sanitary services) and a General Superintendency.
enterprises prior to their privatization. In addition, some attempts were made by the State to follow up on firms privatized at the beginning of the 1990s. For example, in 1994 the Unidad de Reordenamiento devised a questionnaire to collect data on production, employment, investment, tax payments, and other categories from privatized firms.
Regrettably, the firms did not return the questionnaires with the requested information. This scenario changed slightly with the second wave of privatization. Given the great differences in both magnitude of assets and number of employees between the first and second waves of privatization, capitalization has without a doubt been the process most heavily studied, both by local and foreign researchers. The majority of the studies written on capitalization are also case studies.14 More recent work, such as that of Barja and Urquiola (2001), analyzed the impact of capitalization and the regulatory system on the access to and the availability of these services for low income households.
One of the principal obstacles preventing more studies of both the first and second privatization waves is the lack of information (mainly financial data) about firms before and after privatization. Additionally, little follow-up is available, and in many cases these businesses were closed after being privatized. With regards to the third privatization wave, very little literature exists due to the fact that it is relatively recent.
Taking this into account, the current study is the first to attempt to revise and gain access to information concerning the actual performance of privatized companies from 1992 to 2000.
3.3 The Effort to Collect Information
The effort to collect information was exhaustive, difficult, and time-consuming. It required the collaboration of various public and private institutions. Nine information sources were identified and used to collect both primary and secondary data. Among the primary information sources were the Reorganization Unit (UR), the Vice Ministry of Budget and Accounting (VPC), the National Chamber of Hotels, research documents on Bolivian privatizations, the National Statistical Institute (INE), the National Tax Service (SIN), the National Service of Commerce Registry (SENAREC), the General Superintendency (SIRESE), and business surveys.
Pre-privatization information on financial balance sheets and other important data sources were collected from government institutions. The National Statistical Institute (INE) and the National Tax Service (SIN) provided information for periods when companies were still part of the public sector. The INE provided information on 30 percent of the companies in the study; the remaining companies did not present accounting ledgers to the Institute.
The National Service of Commerce Registry (SENAREC) and the General Superintendency (SIRESE) supplied information for companies after privatization. SENAREC provided information on the actual owners of the businesses along with their addresses, while SIRESE provided the annual reports of the capitalized companies.
3.4 Limitations on Availability and Quality of Information
In order to complete the information required for the study, a survey was carried out to obtain financial and management information for the companies after they had been privatized.
Information on Bolivia’s privatized SOEs is scarce for several reasons. Because of their small size, information on firms’ performance while they were public was not always collected and kept. The same is true regarding information on the performance of those firms after privatization. Since over 90 percent of them are small- or medium-sized, and in contrast to small- or medium-sized SOEs in other countries, their stock is not traded publicly. As a result, it was necessary to request information from various sources. Furthermore, since data was not kept systematically under one uniform criterion, the nature and quality of the data varies. This represents a limitation for the present study and demands caution when interpreting the results.
4. The Availability and Nature of the Information on Privatized Firms
4.1 The Privatized Firms Considered in the StudyThe Unidad de Reordenamiento (UR), a unit of the Ministry of Investment and Privatization, is the government agency responsible for privatization. As such, it maintains records of the different privatizations undertaken in Bolivia. According to the UR, from
1992 to the present, 93 public enterprises have been transferred to the private sector. Of these enterprises, 83 were privatized in the traditional manner and 10 were capitalized.15
While the number of privatized firms appears large, the majority of them could not be included in our study because they did not satisfy some basic requirements set forth at the outset. The criteria applied required that firms:
• had to be operating prior to their privatization
• were transferred as active enterprises
• had to operate a minimum number of years after being privatized
• had individual financial statements available before and after the privatization
• had accessible information for the periods before and after their transfer to the private sector could be obtained
Of the 93 firms, only 31, including one concession, could be included in the study. The sample did not take into account several types of SOEs: firms too small and without proper records, since the lack of information made it impossible to determine what their current status was; firms privatized in the period 1999-2000, because too little time had elapsed for the results of privatization to be observable (this is the case for firms privatized in the third wave); firms split into various businesses in order to be transferred, hence making it difficult to undertake the necessary comparisons; firms sold as divided assets, since they did not operate after being privatized; firms that did not have financial statements when they were public, since no measure of their performance as public entities could be obtained, and firms that declined to provide information relative to their current situation as private enterprises, since their performance as private firms could not be measured and comparisons could not be made.
Table 6 summarizes the number of privatized firms that satisfied the conditions for the study as well as those that did not. Table 7 provides a breakdown of privatized firms by economic sector. Of the 31 firms included in the study, four were transferred to the private sector under the capitalization scheme, and 26 were privatized under the traditional scheme. The final firm was transferred to the private sector in administration.
15 The number of capitalized enterprises can be counted as the number of enterprises prior to capitalization or the number of enterprises resulting from the capitalization process. In this study, the last criterion has been adopted.
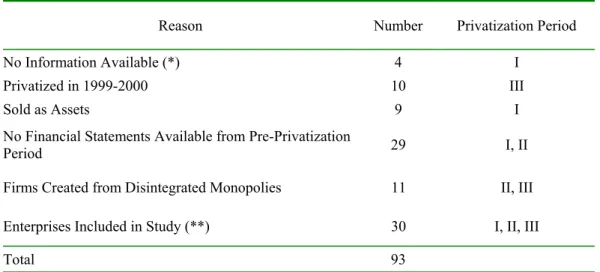
Table 6: Firm Breakdown
Reason Number Privatization Period No Information Available (*) 4 I
Privatized in 1999-2000 10 III Sold as Assets 9 I No Financial Statements Available from Pre-Privatization
Period 29 I, II
Firms Created from Disintegrated Monopolies 11 II, III Enterprises Included in Study (**) 30 I, II, III
Total 93 (*) This is the case of some small firms for which proper records were not kept. Thus, it has not been
possible to find their current business stauts, let alone whether they had been sold to the private sector. (**) This number does not include one concession included in the study. The firms in the study belong to different sectors, such as agro-industrial, electricity, water, manufacturing, telecommunications, transportation and hotels.
Table 7: Privatized Firms by Economic Sector
Sector Privatized Included in Study Agro-industrial 32 11 Electricity and Water 5 1 Hydrocarbons 2 0 Lodging 15 8 Industry 12 0 Manufacturing 10 3 Services 7 0 Transport and Communications 10 7 Total 93 30 Total + 1 concession 94 31 Source: Authors’ calculations.
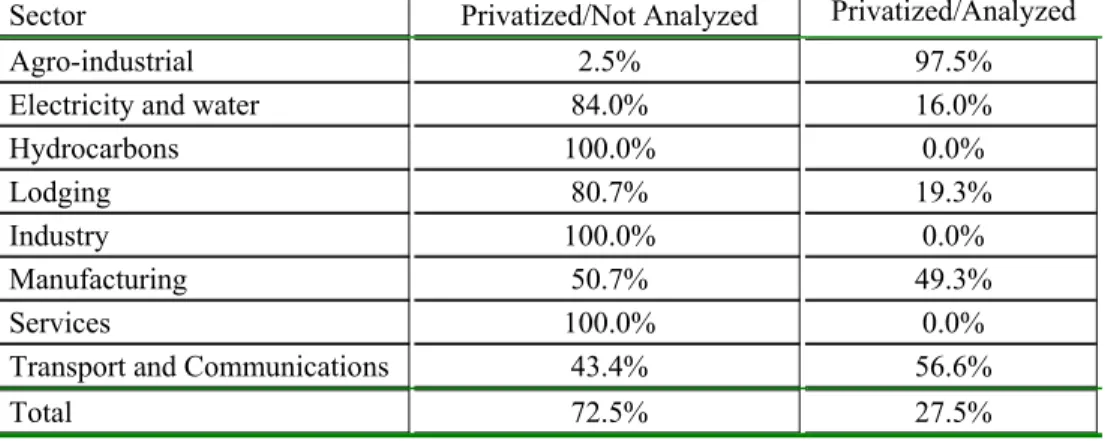
The firms in this study represent more than 50 percent of the sale value of the firms sold in the corresponding sectors. This percentage ranges from 100 percent in the agro-industrial sector to around 50 percent in the manufacturing, transportation and telecommunication sectors to 20 percent in electricity, water and hotels, as shown in Table 8.
Table 8: Percentage of Firms Included in the Study (Based on Sales Value)
Sector Privatized/Not Analyzed Privatized/Analyzed Agro-industrial 2.5% 97.5% Electricity and water 84.0% 16.0% Hydrocarbons 100.0% 0.0% Lodging 80.7% 19.3% Industry 100.0% 0.0% Manufacturing 50.7% 49.3% Services 100.0% 0.0% Transport and Communications 43.4% 56.6% Total 72.5% 27.5% Source: Authors’ calculations.
5.
Empirical Analysis
5.1 Description of the DataThe data employed in this study can be classified in three groups: financial data, employment data, and ownership structure. The first group encompasses financial variables collected from the financial statements of the SOEs. The variables considered are those that quantify income (sales, operating income) and expenses (operating expenses, taxes). They also refer to assets, liabilities and equity as well as profit measures such as operating profit, net profit and gross profit. These variables were obtained from the firms’ financial statements.
The second group includes labor data and was obtained from different reports written before the SOEs were transferred to the private sector. These reports are complemented by a survey of the private firms conducted as part of this study. The labor data classifies employment in two groups: administrative and operating employees. This classification is slightly different from that of white- and blue-collar workers since the first group includes employees in management while the second group includes workers and support personnel.
The third group includes variables collected through a survey and places special emphasis on whether firms are family-owned as opposed to publicly-held corporations. This difference in ownership was considered because it normally leads to differences in management characteristics; family-owned firms are not subject to certain requirements and thus do not face the discipline imposed by the market.
In addition to the issues regarding quality of information discussed earlier, the data set constructed with information collected for the 31 transferred enterprises has other limitations. It is not particularly extensive and is slightly unbalanced (the number of indicators prior to privatization is not the same as after privatization). Nonetheless, the data set constitutes the most extensive and serious effort to compile data on the transfer of SOEs to the private sector in Bolivia; therefore, it is very valuable for the analysis of the impact of those transfers. Furthermore, it should be noted that the data set is somewhat different from those employed in similar studies of other countries in that very small family-owned enterprises that don’t trade in the stock market are included. A1 in the Appendix summarizes the degree of unbalancedness of the sample.
Different sources had to be consulted in order to compile the data set. When possible, information was cross-checked in order to verify the quality and consistency of the information collected. When differences were encountered, data and sources were selected that matched trends and similarities, with the aim of maintaining consistency in the data set.16 The majority of the data relative to operating income and operating costs have SAFCO as their source; data on assets and liabilities come predominantly from the UR; and INE has been an important source for employment data. In many cases, series had to be put together from different sources. Only one source was used for the data series on operating income, expenses and profits. All the financial data has been deflated by the consumer price index (CPI) in order to be expressed in constant 1990 bolivianos.
5.2 Ratio Analysis
This section seeks to measure the change in performance of the privatized firms by comparing certain ratios before and after the transfers. The comparison looks at the direction as well as at the significance of the change. The methodology employed, which is the same as that in La Porta and López-de-Silanes (1997), is based on the analysis of means and medians of different financial ratios that reflect profitability, operating efficiency, and other measures related to firm performance. The methodology can be described as follows:
16 Many of the differences were due to the application of distinct accounting systems, as many of the balance sheets and income statements were not audited.
First, the means and medians before and after privatization for each firm and each ratio were calculated as follows:
∑
− = = n j t t i A i n X M 1∑
= = m j t t i D i m X M i = 1...31where is the mean of firm i before privatization (year j) and is the corresponding mean after privatization, n is the number of years considered in which the firm was public and m is the number of years during which the firm was private.
A i M D i M 17
The average ratio before and after privatization was calculated for the 31 firms in the sample as follows:
∑
= T iA A T M H 1 =∑
T D i D T M H 1It should be stressed that the number of firms T included in the construction of each ratio is different but for the cases in which all 31 firms could be included.
To test the significance of the difference between the average before and the average after privatization two types of tests were carried: the parametric t test in the case of means and the non-parametric Z test (Wilcoxon Signed Rank Test) for the medians. Given that the sample is small, results obtained in the test of medians were considered more attentively.
Table A2 in Appendix 1 details the 26 ratios calculated. These ratios can be divided into the following seven groups:
• Profitability (operating income over sales; operating costs over operating income)
• Operating efficiency (log of sales over fixed assets; net income over sales)
• Labor (log of employees; average salary)
• Assets and investment (investment over sales; investment over fixed assets)
• Liabilities (total liabilities)
• Output (log of sales)
• Net taxes (net taxes over sales)
Liabilities were included in order to capture the change in the debt burden of the firms. This point is important in the Bolivian case since the great majority of firms were in heavy debt or had serious liquidity problems when public.
The ratio analysis was performed with two different ratios: i) Unadjusted ratios and ii) adjusted ratios. While the first is a straight comparison of ratios, the second incorporates adjustments to take away any possible influence of the macroeconomic context on firm performance. In the analysis, more attention is given to those ratios that include a greater number of firms and to those that upon comparison of the ratios before and after privatization show a difference that is significant.
5.2.1 Unadjusted Ratios
The unadjusted ratios suggest that there has been an improvement in the profitability and operating efficiency of the firms. This improvement, however, is not significant except for the case of the ratio of log of sales to fixed assets that, according to the Z test, is significant at 10 percent. A significant decrease (at the 10 percent level) can be observed in the number of employees as well as in fixed assets. Finally, as could be expected, there was a reduction in liabilities, in part due to the fact that the Government assumed some of them in order to make the firms more attractive at the time they were sold.
The t statistics of the parametric test of means, and the Z statistics of the nonparametric test of medians (Wilcoxon Signed Rank Test) are reported in Tables A3 and A4 in Appendix 1. As mentioned earlier, not having data for all firms meant that the comparison of ratios incorporates a different number of observations (see Tables A5 and A6 in Appendix 1).
Profitability
According to the means test, five of the six profitability indicators show an increase. However, none of these are significant, not even at the 10 percent level. Similarly, the median test shows that the six indicators have improved but without being significant. This seems to suggest that the transfer of enterprises to the private sector in Bolivia had no significant impact on performance, as measured by profitability. Of course, a more
conclusive evaluation requires controlling for macroeconomic and other external factors that could have had an effect on profitability.
The evaluation of ratio r2 (net profit over sales), the only ratio that could be constructed for all the firms, shows an average increase in profitability of 5.3 percentage points, according to means, and 5 percentage points in the case of medians. This improvement is associated with a decrease in sales without the corresponding decrease in profits as seen by the ratio p1.
Operating Efficiency
Four of the five operating efficiency ratios show an improvement. The only one showing a decrease is e4 (operating profit over sales). Unit costs have, on the average, increased by 8.8 percentage points, while operating profit over sales have decreased by 8.2 percentage points. The t test shows that none of the differences in means are significant; however, the Z test shows that the improvement in the ratio e2 (log of sales over fixed assets) is significant at the 10 percent level. This increase of 26.4 percent could be explained by the decrease in fixed assets of the firms (see ai1).
Labor
As with the majority of studies on the impact of privatization, the authors found that the transfer of enterprises to the private sector led to a decrease in the level of employment at those enterprises. Such decreases are observable among both administrative personnel and operating personnel.
The authors can not make conclusions about the decrease in administrative and operating personnel individually because none of the differences is significant. However, the log of total employees, which shows a reduction of 1.43 percent, is significant at the 10 percent level in the case of median differences.
With respect to mean salaries, the authors found that at the aggregate level, as in the case of administrative and operating personnel, salaries are higher after the transfer of the SOEs. This seems to be associated with the reduction in personnel, which was not matched with a proportionate reduction in the aggregate payroll. These increases, however, are not significant, suggesting the effect on average salaries is not significant.
Assets and Investment
The authors looked at two different variables: i) Fixed assets, which refer to assets such as machinery, equipment and buildings owned by the firms, and ii) Investment, which refers to the flows of capital to the businesses which may be used to acquire fixed assets.
The data shows that, in general, fixed assets have decreased while investment has increased. This results in ratio ai4 (investment over fixed assets) increasing, though by only 0.3 percent. The difference in this ratio, which includes 17 of the 31 firms, is significant at the 10 percent level in the case of the median test.
The decrease in fixed assets appears to be associated with the excessive production capacity of SOEs when public. The increase in investment reflects, in the case of the capitalized enterprises, the fact that private investors had committed to invest specific amounts at the time of the transfer.
Liabilities and Liquidity
In order to make the enterprises more appealing to investors, the State assumed the debts of the SOEs, particularly the larger ones, before transferring them. This is one of the primary reasons why liabilities were smaller after the enterprises had been transferred, as evidenced by the reduction of the log of liabilities (-6.22 percent), which proves to be significant at the 5 percent level for the case of medians.
In addition to the reduction in liabilities, the difference of the liquidity ratio has improved for both mean and median differences, although in neither case in a significant manner.
Output
As mentioned earlier, the sales level of the transferred firms dropped after the transfer, although this change is not significant. The comparison of means shows a reduction in the log of sales of 2.2 percent and 2 percent in the case of medians. It should be pointed out that in the case of this indicator information was available for all the firms in the sample.
A comparison of this ratio with ratio r2 (net profit over sales) suggests that, while sales have dropped, different management of the firms has resulted in an improvement in profits.
Net Taxes
Finally, the change in the net taxes ratio was considered as a way to evaluate the degree to which the transfer of enterprises to the private sector changed the amount of government revenues collected via taxes. Taxes paid by transferred enterprises increased from 5.33 percent to 7.83 percent in the case of means and from 4.7 percent to 6.77 percent in the case of medians. These changes, however, were not found to be significant.
5.2.2 Adjusted Ratios
Towards the end of the 1990s, the Bolivian economy experienced severe fluctuations in growth rate, from an average of 4.8 percent between 1995-1998 to 0.44 percent in 1999. In addition, this period was characterized by increasing openness in Bolivian markets.18 These types of fluctuations can influence the results previously discussed, since it is likely that the performance of firms reflect external factors in addition to the effects of transferring the enterprises to the private sector.
In order to evaluate the analysis of the impact of transferring the SOEs to the private sector on sales, efficiency, profitability and employment, it is necessary to isolate those effects exclusively associated with the transfers from other macroeconomic or industry-specific sources. To accomplish this, the described ratios were adjusted by incorporating information on the ratios of firms that had been private all along. Since this information was not readily available, data collected in the Manufacturing Industry Survey was used as a control for industrial firms. This survey contains information by industrial classification (CIIU) that allows for a close match between industries and the firms in our sample. In the case of firms in the service sector, firm-specific information was utilized.
The methodology employed to isolate the financial results of firms in the study from possible external factors follows.
18 During the 1990s, increased openness brought a greater influx of foreign capital. This capital inflow favored economic growth, raised employment levels, and increased mean labor productivity (see Jiménez, Pereira and Hernany, 2000).
The behavior of two groups during the period 1988-2000 was considered: the first (G1) included privatized firms in the study, and the second (G2) consisted of firms in the same sectors that had been private all along.
The financial ratios (X) were calculated year-by-year for each firm in both groups. The ratios of the equivalent firms in the two groups were then compared to find the differences by firm and by year. Thus, the adjusted ratio for 1990 was obtained as follows:
Xadj 1990 = Xj1990 – Xi1990
where X represents the different financial ratios (r2, e2, e3, etc), i represents firms in G1, and j represents firms in G2.
Once the adjusted ratio was calculated for each year and for each firm (Xadj), the mean and median of these ratios were calculated for the 31 firms in the sample. The mean and median were calculated for the period in which the firm was public and for the period in which it was private. Finally, both mean and median were tested applying the “t” and “z” tests.
In general, the results reinforce the conclusions obtained with the unadjusted ratios. Privatization has led to an improvement in the operating efficiency of firms that is highly significant (at the 1 percent level). Employment has been reduced as firms have reduced average employment significantly, and fixed assets have decreased proportionately more than sales. It is interesting, however, that the improvement in operating efficiency was not accompanied by an increase in profitability.
The results are presented in Tables A7 and A8 in Appendix 1, and the statistical summary is presented in Tables A9 and A10 in Appendix 1.
Profitability
Because the ratio r2 (net profit over sales) was the only one that could be constructed for all firms, the authors have concentrated on this ratio. As in the case of the uncontrolled ratios, the observed change was not significant. This strengthens the preliminary observation suggested by the available data: the transfer of enterprises to the private sector in Bolivia had no significant impact on their profitability.
Operating Efficiency
In contrast, the results concerning operating efficiency suggest that enterprises transferred to the private sector had significant improvements when in private hands. Mean differences show that ratio e2 (log of sales over fixed assets) had an improvement significant at the 5 percent level, while median differences show this improvement to be significant at the 1 percent level.
The improvement in operating efficiency, which is over 100 percentage points for both means and medians, is explained mainly by a reduction of fixed assets proportionately greater than that of sales.
The non-adjusted ratios already showed the ratio e2 to be significant. The increased significance that the adjusted ratios show suggests that the macroeconomic context and other external factors affected SOEs’ efficiency negatively after their transfer to the private sector.
Labor
The adjusted ratios provide stronger evidence of the impact of the transfers on employment. Whereas the non-adjusted ratios were found to be significant at the 10 percent level, the adjusted ratios, which control for the employment reductions in the overall economy, show the reductions in employment to be significant at the 1 percent level in the case of medians with an 85.8 percent drop in personnel.
The increases in average salaries, as in the case of the non-adjusted ratios, are not significant, suggesting that the aggregate payroll has decreased roughly in proportion to the decreases in personnel. Thus, the authors can not conclude that average salaries were affected by the transfer of SOEs to the private sector.
Assets and Investment
The authors could control for external effects only for the case of two ratios, ai1 (log of fixed assets) and ai5 (log of fixed assets over total personnel). In both cases the differences show decreases that were found to be significant at 1 percent and 5 percent, respectively, in the median test.
The difference found in ratio ai1 confirms that the improvement in the operating efficiency discussed earlier was associated with a significant reduction in fixed assets (the reduction was on the order of -83 percent) as the comparison of medians shows. After they were transferred, businesses, particularly the larger ones, removed machinery, equipment and installations that were obsolete or could not be used efficiently. A case in point is the railroad companies that stopped operating unprofitable routes and sold equipment and offices in various cities.
The observed change in ratio ai5, together with that of employment and ratio ai1, implies that the decrease in fixed assets has been proportionately larger than the reduction in personnel. This suggests that the improvement in efficiency owes more to improved allocation of capital than improved use of personnel.
Output
The reduction of the log of sales reinforces the conclusions discussed earlier regarding the improvement in operating efficiency. It was stated earlier that such improvement was associated with a reduction in fixed assets that was greater than the reduction in sales. The fact that the reduction in sales is significant at the 5 percent level (for the case of medians), as opposed to the 1 percent significance for the case of the reduction of fixed assets corroborates this statement.
The drop in sales for the adjusted ratios, 29.9 percent according to the mean difference and 26.3 percent according to the medians, reflects the fact that the State subsidized the sales of public enterprises. Once in private hands, sales respond to the smaller, unsubsidized demand.
Net Taxes
Finally, the ratio of net taxes does not show a significant change from the amount paid when the enterprises were public. This would suggest that the transfer of SOEs did not have a fiscal impact; however, this conclusion would be unsubstantiated since transfers to and from public enterprises by means other than taxes were common, and they are not taken into account in this comparison
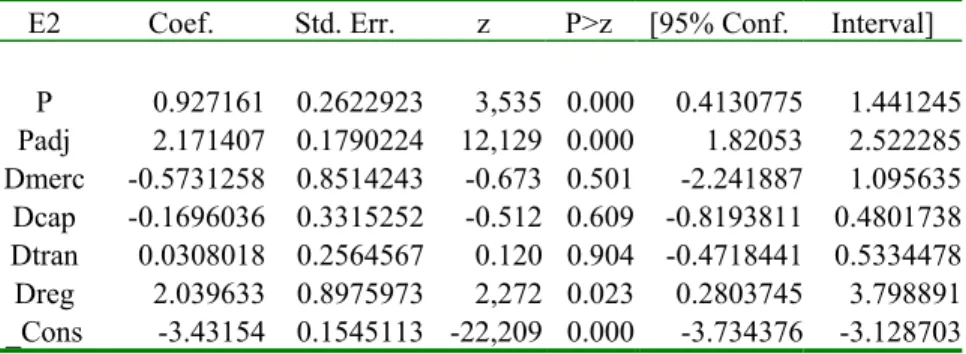
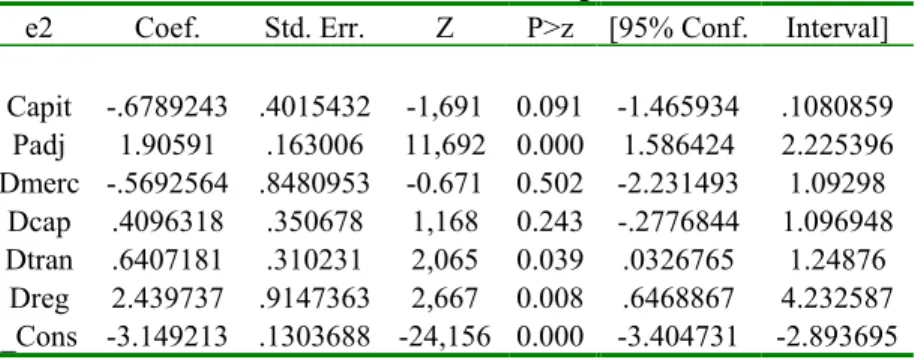
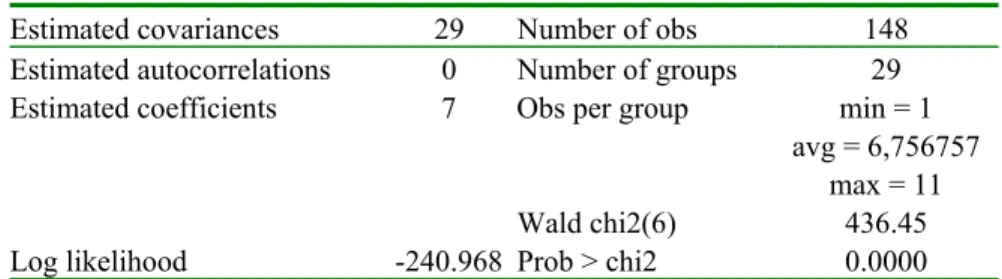
6. Regression Analysis
6.1 Panel Data AnalysisIn this section, the authors seek to identify the determinants of the improvement in the performance of the transferred firms. In particular, the authors seek to establish whether the transfer of SOEs to the private sector is a significant element in explaining the observed improvements in firm performance under private management. For this purpose, the authors pooled the observations in a cross section of the 31 transferred enterprises in our sample and performed a panel data analysis. Using panel data has various advantages:
• It allows for the control of individual heterogeneity. The differences of transferred SOEs are captured by the panel data.
• It allows for a greater number of degrees of freedom and for the capture of more information from the data, with less variability and less colinearity.
• It allows for a better identification and measurement of effects that are not always detectable in time series or cross-section analysis.
• It allows for the construction and testing of the behavior of more complicated models than purely time series or cross-section analysis.
• It allows for the bias in the aggregation of firms to be eliminated, since it is based on a micro level analysis.
The usefulness of this technique depends on the availability of information. Here, the authors face some limitations related to those faced when compiling the data set. The fact that the sample is not complete, due to the unavailability of information about the SOEs and the need to exclude some observations because not all the needed control variables could be obtained, leads to an unbalanced panel. The problems in the quality of the data, both that of the enterprises in the sample as well as that needed for the controls (data on other private firms, sectorial indicators or macroeconomic variables) means that the measurement error that obtains is rather large.
Another limitation of the panel data is the relatively short time span of the time series. In the present case, this means that the asymptotical arguments rest on the number of firms tending to infinity. The authors think that this is approximately the case since, as described earlier, the 31 SOEs included represent a relatively high proportion of the firms that satisfy the necessary conditions for the study. The possibility of studying more than 13