Validation and Reliability of
Visual Assessment with a
Shade Guide for
Tooth-Color Classification
SS Meireles • FF Demarco • IS Santos
SC Dumith • A Della Bona
Clinical Relevance
The results of this study showed that the visual assessment of tooth color using the Vitapan Classical shade guide is a valid method for distinguishing between light and dark tooth colors.
SUMMARY
This study evaluated the validity and reliability of the visual assessment of tooth color using a commercial shade guide. Ninety-two individuals
were randomly selected from subjects enrolled in a randomized controlled trial comparing two for-mulations of carbamide peroxide. Initially, each individual had the color of his or her six maxil-lary anterior teeth (n=552) determined by one examiner using a digital spectrophotometer (Vita Easyshade). Then, a visual assessment was made by two calibrated examiners using a shade guide (Vitapan Classical). Reliability was evalu-ated either by kappa coefficient when all the col-ors were grouped into two categories (dark and light) or by weighted kappa when all 16 colors of the shade guide were considered. The digital spectrophotometer (Vita Easyshade) was used as the gold standard to calculate sensitivity and specificity of the visual assessment. The reliabil-ity of the visual assessment using two color cate-gories was “substantial” (k=0.69). When all colors of the shade guide were considered, the reliabili-ty was “mild” (kw=0.33). Sensitivireliabili-ty and
specifici-Sônia Saeger Meireles, DDS, MS, PhD student in Operative Dentistry, Federal University of Pelotas, Pelotas, RS, Brazil *Flávio Fernando Demarco, DDS, PhD, associate professor,
Department of Operative Dentistry, Federal University of Pelotas, Pelotas, RS, Brazil
Iná da Silva dos Santos, MD, MS, PhD, professor, Departamento de Medicina Social, Federal University of Pelotas, Pelotas, RS, Brazil Samuel de Carvalho Dumith, MS, PhD student in Epidemiology,
Federal University of Pelotas, Pelotas, RS, Brazil
Álvaro Della Bona, DDS, MS, PhD, professor, School of Dentistry, University of Passo Fundo, Passo Fundo, RS, Brazil *Reprint request: Programa de Pós-Graduação em Odontologia,
FO/UFPel, Rua Gonçalves Chaves, 457 Sala 504 Centro, Pelotas/RS, CEP: 96015-560; e-mail: [email protected] DOI: 10.2341/07-71
ty of the visual assessment with respect to the gold standard was 86.9% and 81.9%, respectively. Despite its subjectivity, visual assessment of tooth color using the Vitapan Classical shade guide is a valid method, with good reliability for differentiating between dark and light colors.
INTRODUCTION
Concerns about dental aesthetics have increased sub-stantially in recent years, including concerns about tooth whiteness.1-3Such aesthetic concerns, along with
a range of options to treat discolored teeth (such as bleaching, metal free ceramic restorations, direct or indirect composite restorations), highlight the need for correct color classification to compare the effectiveness of these various treatments.
Tooth color is determined by a combination of extrin-sic and intrinextrin-sic factors.4-5Extrinsic factors are related
to the deposition of either food or beverage stains over the enamel and the acquired pellicle.6-7Intrinsic factors
are related to the enamel and dentin properties of reflection and light dispersion. Tooth color is strongly influenced by these dentin properties. Different methodological approaches have been used to deter-mine the tooth’s color and changes in tooth color, which occur during bleaching treatments.8 Color
classifica-tion, using a standard shade guide (for example, Vitapan Classical shade guide, Vita-Zahnfabrik, Bad Säckingen, Germany) with the buccal aspects of teeth, is the most frequent method used to compare the restored color with natural tooth color.2,9 Subjectivity
and other factors (the clinical experience of the examin-er, fatigue of the human eye and room decoration)8can
affect tooth color classification using this standard method. Control and standardization of these factors, together with good training by the examiner, can improve the ability to accurately classify tooth color in a clinical context.6,8
Recently, digital systems (spectrophotometers,10
col-orimeters8or digital cameras)11have been used to
meas-ure tooth color. Within these systems, color is expressed in CIEL*a*b* space, which provides its specification in three dimensions and allows for more accurate assess-ments.9,12These digital systems are precise instruments
that produce highly reliable, easily evaluated results in terms of visual importance.13 High cost and complex
operation, however, restricts use of these digital sys-tems to laboratory or clinical research.10,14
Although less accurate than digital systems, visual assessment with a shade guide is still the most common method used for color classification in longitudi-nal studies involving bleaching agents.1-2
Nonetheless, there is a lack of peer-reviewed lit-erature regarding validation of this method. The objective of this study was to investigate the
validity and reliability of tooth color measurement using visual assessment with a shade guide.
METHODS AND MATERIALS
This research protocol was approved by the Ethics Committee of the Federal University of Pelotas. Ninety-two individuals (age 18-55 years) were selected from those enrolled in a randomized controlled trial comparing two different concentrations of carbamide peroxide. The color of the six maxillary anterior teeth was assessed for each participant.
Two senior dental students were selected to perform the visual assessment using the shade guide. These examiners were trained in two phases. In the first training phase, they attended a two-hour training ses-sion during which the basic concepts of color, its com-ponents and the factors that may influence its deter-mination were presented. Two methods that measure color were presented, the Vitapan Classical shade guide (Vita-Zahnfabrik, Bad Säckingen, Germany) and the Vita Easyshade digital spectrophotometer (Vita-Zahnfabrik). A series of slides showing the buccal face of the six maxillary anterior teeth (with different col-ors) were exhibited to the visual assessment examin-ers, both of whom were asked to select the correspon-ding color in the shade guide. In the second training phase, the visual assessment examiners were asked to determine the tooth color of the maxillary incisors and canines (n=96) of 16 volunteers selected among stu-dents and staff of the dental school. The color was clas-sified objectively using the digital spectrophotometer (by the supervisor of the study) and subjectively using the Vitapan Classical shade guide (by the visual assessment examiners). These procedures lasted two days (n=48/ day) and were performed in the afternoon with sunlight and room illumination and without any communication between the examiners.
The colors in the shade guide were organized from B1 (lightest color) to C4 (darkest color) (Figure 1). All 16 of the volunteers who participated in the second training phase were evaluated by both examiners. Each exam-iner had a clinical assistant to record the selected color classification codes into standardized forms.
Using digital spectrophotometric analysis (Vita Easyshade) as the gold standard, three measurements were made, with the active point of the instrument focused on the middle third of each tooth. A mean color of the three measurements was calculated. The digital spectrophotometric system used the CIEL*a*b* sys-tem, allowing for the determination of color in
three-Figure 1: Color scores by sequence of colors in the Vitapan Classical shade guide (from lighter to darker colors).
dimensional space. The L* value is a measure of the lightness of an object. The a* value is a measure of red (positive a*) or green (negative a*). The b* value is a measure of yellow (positive b*) or blue (negative b*). The color difference between the color coordinates is calculated as: Δ E* = [(Δ L*)2 + (Δ a*)2 + (Δ b*)2]1/2.15
The colors were numbered from 1 (B1) to 16 (C4) for statistical analysis.16
After completing the training process, matrices were prepared to compare the degree of agreement between the examiners and the gold standard. Then, the kappa coefficient (k) was calculated using either all of the col-ors of the shade guide (weighted kappa) or they were grouped according to chroma (simple kappa), which represents the degree of saturation of color. For kappa calculation purposes, if the gold standard classified the color as A3.5, then the chroma value was recorded as 3. The decision to group the results according to chro-ma was chro-made due to the difficulty in obtaining a good degree of agreement between the examiners and the gold standard when using all 16 colors of the Vitapan Classical shade guide.
Thirteen clinical sessions in 13 days were necessary to train the examiners. The field study was initiated after both examiners achieved agreement with the gold standard at greater than 70%, according to the grouping by chroma.
Prior to data collection, each patient was examined and submitted to a prophylaxis to remove extrinsic staining in advance of clinical examination. To be included in the randomized controlled trial, the patients needed to have a color of C1 or darker (mean color of the six maxillary anterior teeth) (Figure 1). Other inclusion criteria were the absence of composite restorations that involved more than 1/6 of the buccal surface and the absence of caries or periodontal dis-ease. The study excluded pregnant or lactating women, smokers, patients with a previous history of dental hypersensitivity, individuals with tetracycline-stained teeth or those with teeth presenting fluorosis or endodontic treatment.
The digital spectrophotometric and visual assess-ment followed the same steps that were applied for procedures used in the training. To calculate reliabili-ty, different analyses were performed. First, the teeth were clustered into four groups (1, 2, 3 and 4) by chro-ma. Then, the teeth were grouped into two categories: A3-C4 (darker colors) and B1-D4 (lighter colors). For these analyses, the agreement was calculated using the simple kappa coefficient, comparing the observed concordance with the expected concordance.17 The
weighted kappa (kw) was used when all 16 colors of the Vitapan Classical shade guide were taken into con-sideration. The weights of kw were established in the following manner. A weight of 1 represented total
agreement (when the color selected by the visual assessment matched exactly the color determined by the gold standard). A weight of 0.5 was assigned when the visual assessment color was immediately above or below the one determined by the gold standard. A “zero” weight was assigned to all the other situations. Both examiners were blind to the assessments of the other and the results from digital spectrophotometric analysis.
The interpretation of kappa values was set as fol-lows:18 “almost perfect” (0.8-1.0), “substantial”
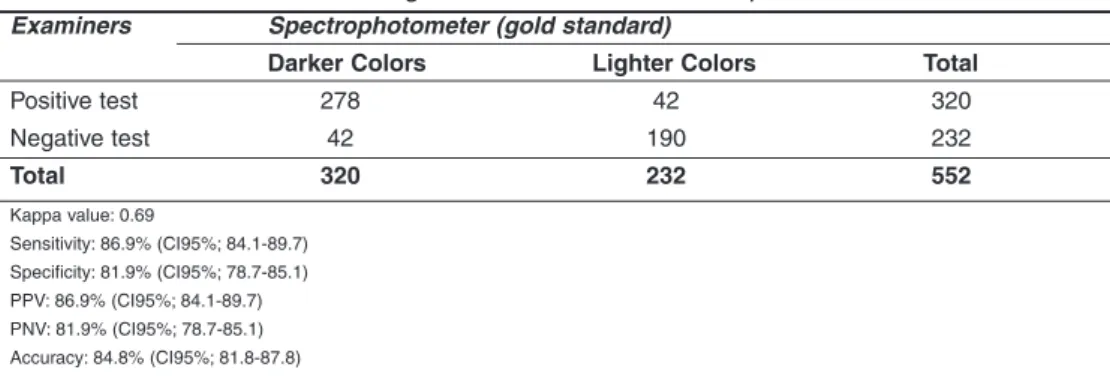
(0.60-0.79), “moderate” (0.40-0.59), “mild” (0.20-0.39), “poor” (0-0.19) and “no agreement” (<0.0). To evaluate the validity of the visual assessment of color using the shade guide, measurements from the visual assess-ment were compared to measureassess-ments from the digi-tal spectrophotometric analysis. A contingency table was prepared by dividing the colors into two groups: A3–C4 (darker colors) and B1-D4 (lighter colors). The colors evaluated as darker were considered to be a “positive test” result, and those evaluated as lighter were considered a “negative test” result. Then, it was possible to calculate the sensitivity, specificity, positive predictive value (PPV), negative predictive value (PNV) and accuracy.19
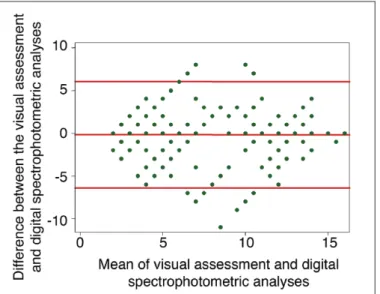
For the 16 colors of the Vita scale, the difference between the two methods and the association between them was calculated using the paired Wilcoxon test and the Spearman coefficient (rho). A Bland-Altman plot was constructed to detect measurement bias. The statistical significance level was set at 0.05.
RESULTS
The mean age of the study population (92 individuals) was 25.3 years, with a standard deviation (SD) of 7.9. Two-thirds of the study population consisted of women. Mean (SD) and median values of tooth colors obtained by spectrophotometric analysis were 8.78 (4.4) and 11, respectively. The corresponding values for the visual assessment were 8.60 (4.2) and 10, respectively (Table 1).
The difference (-0.18; 95% CI: -0.44-0.08) between the visual assessment and digital spectrophotometric analysis was not statistically significant (p=0.07) when considering the 16 colors. The Bland-Altman plot (Figure 2) showed that most of the observations were situated between ± 2 SDs of the mean difference around the middle line, which represents an absence of difference between the two methods and indicates that the analysis was not affected by measurement bias. The Spearman’s coefficient of correlation (rho) showed a high correlation between the two methods of tooth color measurement (rho=0.72).
“Mild” agreement (kw=0.33) between examiners and the gold standard was observed when considering all 16
colors of the Vita scale (Table 1). With color grouping by chroma, reliability still remained “mild” (k=0.39). However, when classified into two categories (light and dark colors), the kappa value increased to 0.69, denot-ing “substantial” agreement (Table 2).
The sensitivity of the visual assessment method was 86.9% (95% CI: 84.1-89.7), showing that the majority of teeth with darker colors were detected. Similarly, speci-ficity was high—81.9% (95% CI: 78.7-85.1)—identifying a high rate of true negatives (light colors) (Table 2).
Among the 320 teeth classified as positives (dark teeth) by the examiners, 278 were true positives (PPV=86.9%; 95% CI: 84.1-89.7). The number of true negative values was 190 (PNV=81.9%; 95% CI 78.7-85.1). The accuracy of the test was 84.8% (95% CI: 81.8-87.8).
DISCUSSION
The correct interpretation of tooth color plays a funda-mental role in decisions about the need for aesthetic treatments. It is also essential to assess changes in color that occur during bleaching procedures. Among the various methods used to classify tooth color, the Vita shade guide is the most frequently used,1,20which
justifies use of this guide in the current study.
Although visual assessment using the Vitapan Classical shade guide is used widely, visual assessment depends on several variables,6,21including the source of
illumination, the characteristics of the tooth and varia-tion in observer training and experience.4,8Few studies
have attempted to validate this method.21
Factors inherent to the Vitapan Classical shade guide itself also can limit the correct determination of the tooth color. For example, the range of colors available in the guide does not cover all possible tooth colors. As a consequence, the results cannot be exactly converted to the CIEL*a*b* space.4The high spectrum of colors (16)
presented in the shade guide increased the chance of an error when compared to the digital spectrophotometric analysis.
When considering 16 colors, the agreement between visual assessment by the examiners and digital spec-trophotometer was low (kw=0.33). When assessing agreement for individual teeth separately, the kappa was even lower. Such a finding could be explained by the predominance of shades of color situated in the medium spectrum of the shade guide, impairing detect-ing small color changes by the examiners. Peres and others22 standardized the training of examiners for
assessing the amount of dental caries and demonstrat-ed that using means may lead to an overestimation of reliability. Therefore, individual teeth, instead of the means, was recommended as a unit of analysis.
The findings of the current study showed that the examiners had difficulty identifying exact colors (as determined by the gold standard) or colors
immedi-Visual Assessment of the Color (16 colors of the Vita shade guide)
Tooth Mean (SD) Color in Mean (SD) Color in the Δvis—(sp) Weighted the Visual (vis) Digital Spectrophotometric (SD) Kappa
Analysis sp Analysis 13 12.45 (1.84) 12.76 (1.52) -0.31 (1.93) 0.21 12 7.62 (3.52) 9.22 (3.62) -1.60 (3.47) 0.19 11 5.74 (3.53) 5.22 (3.57) 0.52 (3.49) 0.26 21 5.88 (3.60) 5.16 (3.60) 0.72 (3.27) 0.24 22 7.48 (3.82) 7.89 (3.93) -0.41 (3.60) 0.27 23 12.42 (1.62) 12.44 (1.39) -0.02 (1.81) 0.21 Total 8.60 (4.19) 8.78 (4.36) -0.18 (3.11) 0.33
Table 1: Means and standard deviations (SD) for the visual assessment and digital spectrophotometric analy-ses, difference between analyses (visual assessment—digital spectrophotometric) and weighted kappa considering the 16 colors of the Vita scale.
Figure 2: Bland-Altman plots using the 16 colors of the Vitapan Classical shade guide, comparing visual assessment and digital spectrophotometric analysis. The middle line is the average of the mean difference between the visual assessment and digital spectrophotometric analysis. The upper and lower lines represent the 95% confidence interval around the mean differ-ences.
ately adjacent on the Vitapan Classical shade scale. In a previous study, Guan and others23observed a positive
correlation (r=0.94) using the Spearman correlation coefficient between the digital spectrophotometer and visual assessment methods of tooth color using extracted teeth. That study, however, tested this corre-lation in extracted teeth, while in the current study, the comparison was made using intact teeth. In fact, the environmental conditions that surround extracted teeth cannot be fully compared to the conditions found when examining teeth in the mouth of a patient.
In the current study, when colors were grouped according to chroma, it was possible to detect an important improvement in reliability. A similar finding was reported by Hugo and others.9 Those authors
divided the colors of the Vita shade guide into four cat-egories according to hue. Visual assessments were per-formed by three examiners and compared against three digital methods. Agreement among the three dif-ferent examiners was 52.9%, which was better than the agreement for each digital method compared to the group as a whole. As found in the current study, a reduction in the number of options probably had helped to improve agreement between examiners, as well as between examiners and the gold standard.
Several clinical trials on bleaching treatment have used two classification methods (visual assessment vs digital assessment) to determine tooth color.1-2,11 Such
trials, however, have not reported the reliability and validity of the methods employed. Based on the results of the current study, it was observed that visual assess-ment with the shade guide was a valid method and that it was capable of identifying darkened teeth when they were present (sensitivity=86.9%) and identified true lighter teeth (specificity=81.9%). Therefore, it was demonstrated that well-trained examiners attained suitable skill to differentiate individuals who actually need bleaching treatment from those who did not.
The findings of the current study also highlight the requirement of intense training before applying visual assessment using the Vitapan shade guide in laborato-ry or clinical studies.8,13Nevertheless, for routine daily
use in dental clinics, the clas-sification of tooth color using shade guides seems to be ade-quate and sufficient, provid-ing trained dentists with a reliable method to discrimi-nate between light and darkened teeth.
CONCLUSIONS The results of this study indi-cate that visual assessment using a shade guide is a valid and reliable method to differentiate light from dark colors of teeth.
(Received 10 April 2007)
Acknowledgement
The authors thank the Conselho Nacional de Desenvolvimento Científico e Tecnológico (CNPq) for its financial support (scholar-ship). Also, the authors thank Mr Ferdinan Leida, Luís Coimbra and Marcus Conde, as well as Mrs Sani Heckmann and Sílvia Fontes for their contributions to the development of this study. In addition, the authors acknowledge Dr Christine Erdmann, Department of Epidemiology, School of Public Health, University of Michigan, for her assistance with manuscript revision.
References
1. Kihn P, Barnes DM, Romberg E & Peterson K (2000) A clini-cal evaluation of 10 percent vs 15 percent carbamide perox-ide tooth-whitening agents Journal of the American Dental
Association 131(10) 1478-1484.
2. Matis BA, Mousa HN, Cochran MA & Eckert GJ (2000) Clinical evaluation of bleaching agents of different concen-trations Quintessence International 31(5) 303-310.
3. Haywood VB (2003) Frequently asked questions about bleaching Compendium of Continuing Education in
Dentistry 24(4A) 324-337.
4. Joiner A (2004) Tooth colour: A review of the literature
Journal of Dentistry 32(Supplement 1) 3-12.
5. Walsh TF, Rawlinson A, Wildgoose D, Marlow I, Haywood J & Ward JM (2005) Clinical evaluation of the stain removing ability of a whitening dentifrice and stain controlling system
Journal of Dentistry 33(5) 413-418.
6. Watts A & Addy M (2001) Tooth discolouration and staining: A review of the literature British Dental Journal 190(6) 309-316.
7. Dahl JE & Pallesen U (2003) Tooth bleaching—a critical review of the biological aspects Critical Reviews in Oral
Biology and Medicine 14(4) 292-304.
8. Joiner A (2006) The bleaching of teeth: A review of the liter-ature Journal of Dentistry 34(7) 412-419.
9. Hugo B, Witzel T & Klaiber B (2005) Comparison of in vivo visual and computer-aided tooth shade determination
Clinical Oral Investigation 9(4) 244-250.
Examiners Spectrophotometer (gold standard)
Darker Colors Lighter Colors Total
Positive test 278 42 320 Negative test 42 190 232 Total 320 232 552 Kappa value: 0.69 Sensitivity: 86.9% (CI95%; 84.1-89.7) Specificity: 81.9% (CI95%; 78.7-85.1) PPV: 86.9% (CI95%; 84.1-89.7) PNV: 81.9% (CI95%; 78.7-85.1) Accuracy: 84.8% (CI95%; 81.8-87.8)
10. Braun A, Jepsen S & Krause F (2007) Spectrophotometric and visual evaluation of vital tooth bleaching employing dif-ferent carbamide peroxide concentrations Dental Materials
23(2) 165-169.
11. Wee AG, Lindsey DT, Kuo S & Johnston WM (2006) Color accuracy of commercial digital cameras for use in dentistry
Dental Materials 22(6) 553-559.
12. Mokhlis GR, Matis BA, Cochran MA & Eckert GJ (2000) A clinical evaluation of carbamide peroxide and hydrogen per-oxide whitening agents during daytime use Journal of the
American Dental Association 131(9) 1269-1277.
13. Okubo SR, Kanawati A, Richards MW & Childressd S (1998) Evaluation of visual and instrument shade matching The
Journal of Prosthetic Dentistry 80(6) 642-648.
14. Tung FF, Goldstein GR, Jang S & Hittelman E (2002) The repeatability of an intraoral dental colorimeter Journal of
Prosthetic Dentistry 88(6) 585-590.
15. Commission Internationale De L’Eclairage (1978) Recommendations on uniform colour spaces, colour differ-ence equations and psychometric colour terms
15(Supplement 2) Paris: Bureau Central de la CIE.
16. Nathoo SA, Stewart B, Zhang YP, Chaknis P, Rustogi KN, Devizio W, Petrone M & Volpe AR (2002) Efficacy of a novel, non-tray, paint-on 18% carbamide peroxide whitening gel
Compendium of Continuing Education in Dentistry 23(11)
26-31.
17. Fleiss JL (1981) Statistical Methods for Rates and
Proportions 2nded New York.
18. Landis JR & Koch GG (1977) The measurement of observer agreement for categorical data Biometrics 33(1) 159-174. 19. Fletcher RH, Fletcher SW & Wagner EH (1996)
Epidemiologia Clínica: Elementos Essenciais Artes Médicas,
Porto Alegre p 398.
20. Paul S, Peter A, Pietrobon N & Hämmerle CHF (2002) Visual and spectrophotometric shade analysis of human teeth
Journal of Dental Research 81(8) 578-582.
21. Hassel AJ, Koke U, Schmitter M, Beck J & Rammelsberg P (2005) Clinical effect of different shade guide systems on the tooth shades of ceramic-veneered restorations International
Journal of Prosthodontics 18(5) 422-426.
22. Peres MA, Traebert JL & Marcenes W (2001) [Calibração de examinadores para estudos epidemiológicos de cárie den-tária] Caderno de Saúde Pública 17(1) 153-159.
23. Guan YH, Lath DL, Lilley TH, Willmot DR, Marlow I & Brook AH (2005) The measurement of tooth whiteness by image analysis and spectrophotometry: A comparison