HYDRATION STATUS, SALIVARY BIOMARKERS OF STRESS, BODY COMPOSITION, AND PERFORMANCE IN RESPONSE TO A 4-WEEK PRE-SEASON TRAINING CYCLE IN DIVISION 1 BASKETBALL PLAYERS: AN OBSERVATIONAL
STUDY
James David Ayscue
A thesis submitted to the faculty at the University of North Carolina at Chapel Hill in partial fulfillment of the requirements for the degree of Masters of Arts in the Department of Exercise
and Sport Science (Exercise Physiology).
Chapel Hill 2017
Approved by: Claudio Battaglini Anthony C. Hackney Erik Hanson
ii © 2017 James David Ayscue ALL RIGHTS RESERVED
iii ABSTRACT
James David Ayscue: Hydration Status, Salivary Biomarkers of Stress, Body Composition, and Performance in Response to a 4-Week Pre-Season Training Cycle in Division 1 Basketball
Players: An Observational Study (Under the direction of Claudio L. Battaglini)
This observational study profiled various physiological parameters in a group of fourteen elite level Division-I male basketball players during four-weeks pre-season strength and
conditioning training. Hydration status, hormonal changes (specifically testosterone and cortisol), body composition, training load, and performance (measured by a peak velocity test) variables were observed. The potential relationship between changes in hydration status, training volume and physical performance were observed. In addition, the relationship between
iv
ACKNOWLEDGMENTS
To all the people who have helped me through this process, I would like to say from the bottom of my heart thank you. There are too many to name but they span from my thesis committee to my fellow peers in the program to my colleagues at UNC who I have worked with for five years to my friends here in Chapel Hill to most importantly, my family. The love and appreciation I have for all of y’all cannot be expressed in words. I didn’t know if I had two more years of school in me as I sat in Kenan Stadium on May 10, 2015 at my graduation from
undergrad. Without the help and support I’ve received over the past two years I don’t think I would have. Thanks to y’all though, everyone who has ever helped me even in the smallest ways, I was able to make it and that is a surprise, it is a miracle by some standards, but most of all it is an honor to be submitting this thesis to the greatest university in the world, The
v
TABLE OF CONTENTS
LIST OF TABLES………...viii
LIST OF FIGURES………ix
LIST OF ABBREVIATIONS……….……….x
CHAPTER I: INTRODUCTION……….………1
Purpose……….………5
Definition of Terms…..……….………...6
Assumptions…..……….………..6
Limitations…..……….………6
Delimitations…..……….……….7
Research Questions…..……….…………...7
Research Hypotheses…..……….…………8
Significance of Study…..……….…………8
CHAPTER II: REVIEW OF LITERATURE………....…..…..10
Acute Cortisol and Testosterone Responses to Exercise Bouts……….12
Extended Cortisol, Testosterone, and Free Testosterone Responses to Exercise………..14
Pro-Inflammatory Cytokines IL-6 and TNF-α Responses to Exercise and Competition..21
The Prevalence of Chronic Dehydration in Basketball Player Populations………..24
Body Composition Changes Across Seasons and Effects on Performance……..……….25
Effects of Sleep Deprivation and Sleep Debt Accumulation on Cortisol………..26
vi
CHAPTER III: METHODOLOGY………...29
Participants………..………...29
Instrumentation….………..………...29
Overview of Study………..………...30
Study Protocol…….………..………..…………...31
Statistical Analysis………..………...41
CHAPTER IV: RESULTS……….42
Subjects………..………...43
Body Composition………..………...44
Hydration………..……….44
Training Load………..……….………...45
Performance Tests………..……….………...46
Salivary Hormones………..………...….………….….47
Exploratory Analysis……….…………...……….…48
CHAPTER V: DISCUSSION………50
Subjects………..………...50
Body Composition………..………...51
Hydration………..……….52
Hydration and Training Load………...……….……….55
Hydration and Performance…………...………...……….57
Training Load and Performance………...……….59
Observed Hormone Changes….………...……….60
Exploratory Analysis: Correlations …………...……….………...64
vii
APPENDIX………66
Pre-Assessment Guidelines………..………..66
Pre-Assessment Guidelines....………..………....………..67
viii
LIST OF TABLES
Table 3.1: Timeline of Events………...……….………31
Table 3.2: Assessment Timeline of Events………33
Table 3.3: Resistance Training Progression……….………..….…………...38
Table 3.4: Aerobic Training Progression……….………...…………...40
Table 4.1: Body Fat Percentage………..….………..44
Table 4.2: Urine Specific Gravity Scores………..….………...45
Table 4.3: Urine Specific Gravity Scores cont………...………...45
Table 4.4: Weekly RPE Scores……….…..………...46
Table 4.5: Average Daily RPE Scores……….…..………46
Table 4.6: Peak Velocity……….…….…..……47
Table 4.7: Free Testosterone………..………..……..…47
Table 4.8: Cortisol………..………...48
Table 5.1: Amount of Dehydrated Players/Week……….……...54
Table 5.2: Training Load Percent Change……….…………56
ix
LIST OF FIGURES
Figure 4.1: Data Collection Timeline………….………44
Figure 5.1: Urine Specific Gravity (All Players)………53
Figure 5.2: Urine Specific Gravity (Freshmen)………..53
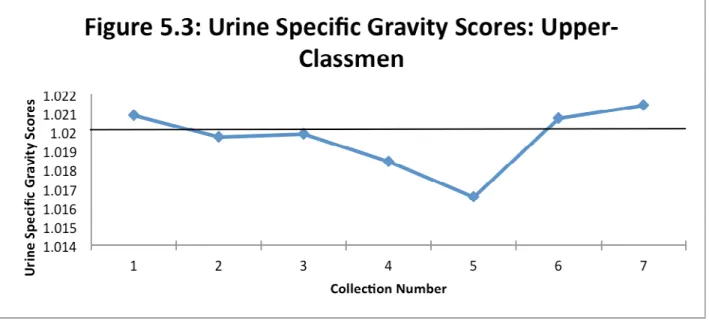
Figure 5.3: Urine Specific Gravity (Upper-Classmen)………...53
Figure 5.4: RPE Training Load Team Average………..55
Figure 5.5: Peak Velocity (All Players)………..57
Figure 5.6: Free Testosterone (All Players)………61
x
LIST OF ABBREVIATIONS
IL-6 Interleukin – 6
1
CHAPTER I: INTRODUCTION
2
hormonal changes associated with training volume, intensity, and performance markers specific to the sport.
Many previous studies have taken in depth looks at the responsiveness of certain hormones and cytokines to acute bouts of exercise and competition. Much of this research has focused around cortisol, testosterone, and the free testosterone to cortisol ratio. Conclusions from research of this matter have found that depending on the duration and intensity of the exercise or competition bout, cortisol levels will rise accordingly during activity and return to resting levels at a time dependent upon the duration and intensity of the physical activity and amount of rest post exercise (i.e. the longer the activity and/or the more intense the activity the more time it takes to return to resting levels) (Elloumi et al. 2003; Lac & Berthon, 2000;
Passelergue & Lac, 1999). Testosterone has also been shown to have a decrease over the course of a competitive event which is followed by a rise over normal resting levels in the recovery days that follow the event (Elloumi et al. 2003; Lac & Berthon, 2000). This rise in testosterone over the recovery days coincided with an increased free testosterone to cortisol ratio above resting values. This is indicative of a more anabolic (protein synthesis) state in the days following competition as compared to the catabolic (protein degradation) state present during and
3
literature in the topic is scarce and empirical information on how to potentially use hormonal responses to training to assist coaches in modifying athletes pre-competitive training phases is lacking. Further research in this area is needed to give coaches the knowledge and allow them the opportunity to better optimize an athlete’s response to training which has the potential to lead to more optimum performances in competition.
Very few studies to date examined long-term approaches to monitoring hormonal activity throughout training cycles and competitive seasons in elite level athletes. One particular study that did take a longitudinal approach followed twenty-one collegiate football players throughout pre-season training and game competition taking measurements five times throughout the year. The testosterone to cortisol ratio was examined but the reasoning behind the up and down changes of the ratio seen throughout the study was inconclusive (Hoffman et al. 2005). A more recent study examined the hormone profile of elite level track and field athletes during
4
training. In order to continue to build the body of knowledge in this intriguing area of sports performance research, more frequent measurements taken throughout a mesocycle of training could potentially be very revealing. Furthermore, most studies performed up to this point in an elite athletic population tend to focus on a few select variables instead of using a wide spectrum approach that may be needed to possibly identify variables that are more sensitive to training responses and competition. In addition, no studies could be found that take into account chronic changes in hormonal responses over an extended training period involving both resistance and endurance type training in elite level athletes. Hormonal responses to resistance training have been researched in elite level weightlifters in which serum hormone concentrations where looked at in relation to training volume. However, no endurance based programming was included in the training regimen design for the study (Hakkinen et al. 1987). For many athletes, endurance and resistance training are important components of a training program as both areas of training play important roles in improving their athletic performance during competition.
Other relatively simple and important physiological markers previously shown to influence athletic performance such as hydration and body composition should be monitored as simple measurements to assist in the determination of the relationship between physiological changes and training volume and performance. Dehydration has been shown to be a fairly
widespread problem across many populations of amateur and professional basketball players and it is well known that dehydration can have detrimental effects on athletic performance
(Vukasinovic-Vesic et al, 2015; Minshull & James, 2013; Osterberg et al, 2009). Body composition has been shown to have significant changes throughout training cycles and
5
during a training program, variables spanning from hormonal and cytokines biomarkers to hydration markers to measures of body composition and their changes in response to varying training volumes could individually or collectively provide a better picture on an athlete’s readiness to perform. In addition, level of fatigue and duration of sleep have been correlated with changes in different hormones which in turn can significantly affect physiological changes due to training and performance variables in elite athletes (Spiegel et al. 1999). Therefore, it appears paramount that profiling lifestyle factors such as quality of sleep, levels of fatigue, as well as hormonal, hydration, and body composition alterations throughout a training cycle may help improve the current understanding on how the associations between these factors may influence athletes performance.
Coaches all over the world are in constant search for better methods that can more objectively track/monitor the effects of their training on the physiological changes aimed to promote optimum/maximum performance capacity. Today, some biological and psychological markers have been proposed as potential tools that can help coaches identify if athletes are unable to tolerate appropriately the training loads being imposed upon them. Furthermore, some of these markers could be used to determine if the training load can be increased to promote more profound physiological adaptations, which in turn could be translated into better
performances during competition. To date, many different tools exist to help coaches monitor the progress of their athletes during training and competition. However, tools that can provide a more precise insight on the true readiness for the subsequent training sessions or competition continue to be a desirable and important topic of research in the world of sports performance. Purpose
6
Division 1 basketball players throughout a 4-week pre-season training cycle. A secondary purpose will evaluate the relationship between changes in physical fitness (Performance test), hydration status, body composition, salivary biomarkers of stress, and training loads.
Definition of Terms
Training load: Total training load is defined by the computation using a session-RPE score which uses the modified Borg RPE scale (a scale that is rated one to ten with one being no exertion and ten being maximal exertion) multiplied by the duration of the session in minutes. This multiplication gives the session-RPE score, which has been previously demonstrated to have a strong correlation with other accepted measurements of training load in athletes (Casamichana et al, 2013).
Assumptions
• It was assumed that all athletes accurately and honestly responded to the fatigue, sleep,
and rate of perceived exertion questionnaires;
• It was also assumed that all athletes followed strictly and adhered to saliva collection
procedures. Limitations
• Limited number of participants based on the fact that the participants were drawn from a
Division 1 college basketball team. Therefore this study may only be generalizable to Division 1 college basketball players;
• Training program was pre-set by the strength and conditioning staff and were not
necessarily uniform for all athletes;
• Even though all measurements were planned to be assessed at specific times during the
7
• Fatigue questionnaire did not cover all possible aspects and reasoning behind potential
causes of fatigue;
• Due to the observational nature of the study and the challenge of collecting the data
without disturbing the daily routine of the team training program, the use of bioelectrical impedance as the method for the assessment of body composition may have produced inaccurate data, since athletes are often dehydrated due to the demands of the training regiment.
• Although all participating athletes were asked to maintained their normal dietary habits
and not change drastically any aspect of their diet during the study, athletes do tend to alter their caloric intake and therefore these potential changes could influence the stress hormones analyses.
Delimitation
• All athletes recruited to participate in the study were confirmed members of a division 1
basketball program; any athlete who missed four or more of the planned training days will be excluded from data analyses.
Research Questions
RQ1. Do the observed variables of hormonal biomarkers, hydration status, or body composition show changes over the 4-week training program?
RQ2. Do weekly changes in training loads correlate with changes in hormonal
biomarkers, changes in hydration variables, and/or body compositional changes observed in the 4-week training program?
8
RQ4. How does the free testosterone to cortisol ratio change in response to the increasing training loads during the preseason 4-week training program?
Research Hypotheses
H1. There will be significant decreases in hydration status throughout the 4-week training program and these changes will inversely correlate with increasing weekly training loads. H2. There will be significant changes to body fat percentage and lean muscle content throughout the 4-week training program and these changes will correlate with increasing weekly training loads.
H3. There will be significant increases in cortisol levels and decreases in testosterone levels throughout the 4-week training program.
H4. Increases in cortisol levels will positively correlate with increases in weekly training loads and decreases in testosterone levels will inversely correlate with increases in weekly training loads.
H5. There will be a significant inverse relationship between decreasing free testosterone to cortisol ratio and increasing weekly training loads.
H6. If significance is found between variables and increasing weekly training loads, these variables will show a significant relationship to decreased performance on the
performance test. Significance of the Study
Various factors across many aspects of a collegiate athlete’s life can have effects on
athletic performance along with their training loads. Relatively few attempts have been made to
generally observe elite-level collegiate athletes’ physiological responses to training cycles
involving a combination of different resistance and aerobic/anaerobic conditioning training
9
affect athletic performance, choosing certain factors that could play a more prominent role in
affecting performance in collegiate level athletes could prove helpful in informing coaches and
athletes on better ways to improve preparation for competition. The evaluation/profiling of
hydration status, body composition and, salivary biomarkers of stress during different training
periods may help shed light on how these relatively easy to collect markers of physiological
training response potentially affect performance. More specifically, how different training loads
10
CHAPTER II: REVIEW OF LITERATURE
This review of literature will cover previous research that deals with hormonal and cytokine responses to varying bouts of exercise and training most specifically in athletic populations. Much of the research reviewed here will focus on salivary samples of cortisol, testosterone, and the inter-relationship between what is known as the free testosterone to cortisol ratio and practical implications for what this relationship means for training status. In addition, research looking at cytokine responses in regards to exercise and training will be reviewed in the sections that follow. Studies that looked at the cytokines Interleukin-6 (IL-6) and Tumor
Necrosis Factor Alpha (TNF-α) and their responses to the various training protocols will be the primary focus of the review. Research that takes a more generalized approach to monitoring athletes’ training status through the hormonal and cytokine biomarkers being studied will also be examined in an attempt to generally give an idea of research that has already been done in
11
the training loads being attained during this study, research that looks at RPE based tracking will be reviewed in short at the end of this literature review.
Acute Cortisol and Testosterone Responses to Exercise Bouts
12
An earlier study which investigated hormonal changes in elite level weightlifters found that during a six week resistance training period, the initial two weeks of training led to
significant decreases in testosterone levels followed by a stabilization of these levels in the final four weeks of training. In addition, the final four weeks of the resistance training program led to significant decreases in cortisol levels (Hakkinen et al, 1987). Findings from the Beaven et al. (2011) and Hakkinen et al (1987) lead us to conclude that the type of resistance training that will be occurring with the elite level basketball athletes will be enough to induce a great enough free testosterone change and cortisol change in response to the exercises being performed. When it comes to cortisol, the training programs being completed by the elite level basketball players will be of a greater intensity and duration and thus will put more stress on the athletes than is being seen in the Beaven et al. (2011) study which showed non-significant cortisol changes.
The elite level basketball players will also be subjected to moderate to high intensity endurance training as part of their training programming and thus an understanding of the associated cortisol and testosterone responses to that is necessary. Hackney and Viru (1999) evaluated cortisol levels over a twenty-four hour period in response to high intensity and
13
the first high intensity exercise session and these significant increases remained for two hours post-exercise. The second exercise session of that day (also high intensity) led to a significant increase in cortisol over resting state only in the sample drawn immediately following exercise. The same results held true for the moderate-intensity exercise days except for the significant increase over resting cortisol levels was only significant one hour post exercise after the first session. Regarding the night time levels that were allowed to be assessed, both moderate and high intensity cortisol responses showed significant decreases over resting values with the high intensity exercise groups showing lower cortisol levels than the moderate intensity group (Hackney & Viru, 1999).
Testosterone and its acute responses to submaximal and maximal aerobic exercise are of interest as well. Sgro et al (2014) demonstrated that total testosterone will show significant increases over baseline levels in response to both submaximal and maximal aerobic work and further showed that total testosterone levels will remain elevated for the following hour after both bouts of exercise. Submaximal aerobic exercise led to a higher level of total testosterone than did maximal. Free testosterone, which is the biologically active form of testosterone and will be analyzed in this review’s study through saliva, also increased significantly in response to both submaximal and maximal aerobic exercise and these levels also remained elevated for the following hour after the exercise bout (Sgro et al, 2014). Noting this study, it is shown that free testosterone will respond acutely to submaximal aerobic work which is what the basketball athletes being studied will participate in as part of their training program.
14
hormonal levels will be measured at 8 AM following both rest days and days of varying exercise durations and intensities. While it may be of concern that two of the studies used blood sampling and the current study will be using saliva, Fryer et al (2014) showed that capillary, venous, and saliva levels of cortisol increased post-exercise, salivary cortisol just increased at a slower rate (Fryer et al, 2014). Since saliva samples will not be drawn immediately post exercise this will not affect the current studies results.
Extended Cortisol, Testosterone, and Free Testosterone Responses to Exercise
Many studies exist that look at an athlete’s cortisol and testosterone response after a high stakes, high intensity athletic event. Some of these studies not only evaluate the hormonal levels of cortisol and testosterone immediately following the athletic event but also continue to monitor levels for many days following the event to get an idea of what is happening in the body during post-competition, recovery based days. Often times, the levels of cortisol, testosterone, and the free testosterone to cortisol ratio can give a lot of insight into how effectively and athlete is recovering and rebuilding muscles damaged following intense bouts of competition.
15
cortisol levels showed no significant differences but testosterone levels were significantly higher over resting values on all but one of the measured recovery days. The free testosterone to cortisol ratio was significantly increased over resting day values on day one and day three of recovery with over forty percent increases over resting levels (Passelergue & Lac, 1999).
16
17
reinforces the ideas that the body acts to repair itself through anabolic activity following intense athletically based activity and thus shows that there is a need for certain amounts of rest
following these types of high intensity activity to allow for this period of restoration and repair. It should be noted that it appears during the post-competition days, the raised free testosterone to cortisol ratio is a function of a short term chronic lowered cortisol level as well as some increases in testosterone levels over resting levels (Lac & Berthon, 2000).
A later studied published in 2003 looked at the free testosterone to cortisol ratio in twenty Tunisian rugby players after a competitive, international level match and in the six post-match recovery days. Saliva samples were used to look at hormonal levels and they were taken two months before the competition to establish rest values, four times on the day of the competition, and twice a day (morning and evening; 8 AM and 8 PM) during the six recovery days. Results from the study showed a significant decrease in the free testosterone to cortisol levels
18
This anabolic state appears to be a necessary function in regards to the body healing and repairing itself after the high loads of stress applied to it through high level athletic activity.
Multiple studies have been conducted that have tracked the free testosterone to cortisol ratio through training and competitive season that have longer durations than the studies
discussed earlier in this section. Martinez et al (2010) looked at the free testosterone to cortisol ratio through serum samples in twelve international level basketball players throughout a season that lasted approximately six months. Blood samples were drawn at four points throughout the season: October (at the end of the first cycle of pre-season training), December (at the end of the second cycle of training), March (at the conclusion of a multi-game tournament), and April (at the end of the season). Results from the study showed decreases in the free testosterone to cortisol ratio throughout the season but very few of these decreases were significant. Cortisol showed significant increases over resting levels at two points during the season, at the conclusion of the first cycle of pre-season training (October) and at the finale of a multi-day, multi-game tournament towards the end of March. This marked increase of cortisol at the conclusion of the tournament coincided with a significant decrease in the free testosterone to cortisol ratio at the same time period (Martinez et al, 2010). Both of these findings are in line with what would somewhat be expected in regards to hormonal responses to elevated training stresses. Cortisol tends to rise in response to physical and/or mental stress and stress would be at higher levels following intensified pre-season training as well as at the conclusion of a tournament in which the volume of games being played is increased.
19
were taken five times throughout the season: before the start of pre-season training camp, the last day of training camp, and in weeks’ three, seven, and ten of the football season. Results from the study showed the only significant decrease in testosterone to cortisol ratio occurred at the second blood draw at the conclusion of pre-season training camp. Other conclusions from this study did not show much significance in regards to the testosterone to cortisol ratio (Hoffman et al, 2005). Pre-season training tends to be the most taxing and stressful time of training for athletes and as was the case with the basketball players in the Martinez et al (2010) study, the football players in the Hoffman et al (2005) study showed significant decreases in the associated ratio (either free testosterone to cortisol or total testosterone to cortisol) at the conclusion of this pre-season training period. This appears to make logical sense as these times of higher volume and intensity training would correspond with the body being in a more catabolic state than at other times during a season when coaches typically ramp down the training volume in anticipation of
keeping players fresh for competition. On the other end of the scale, Guilhem et al (2015) found that international track and field athletes showed an increase in the free testosterone to cortisol ratio during a time of lower volume training which was in place as a pre-competition training program (Guilhem et al, 2015). This would indicate a more anabolic phase of protein synthesis in the body which is what one would want to see as an athlete nears competition. These studies taken together show that there are times when athletes experience both catabolic and anabolic states and these are very dependent on the volume and types of training and stress that the body is being subjected to.
20
and resistance training programming. The program design itself consisted of more aerobic and muscular endurance focused exercises at the beginning and then progressed towards more
21
Pro-Inflammatory Cytokines IL-6 and TNF-α Responses to Exercise and Competition
The pro-inflammatory cytokines IL-6 and TNF-α are known to have large degrees of responsiveness to acute exercise. These acute increases are associated with varying intensities of exercise in which the body undergoes inflammatory responses as a result of the damage induced to the body because of the exercise bout. IL-6 has shown to have increases thirty minutes into a moderate to high intensity bout of treadmill running with increases of up to twenty-five times baseline levels shown at the conclusion of a two and a half hour treadmill run. In addition, IL-6 was found to remain elevated six times over baseline levels up to six hours post-treadmill run (Ostrowski et al, 1998). TNF-α and IL-6 levels were also found to be significantly elevated over pre-exercise levels in response to exhaustive exercise tests of varying type (running, swimming, or biking) in fifteen well trained male endurance athletes. TNF-α levels remained elevated twenty hours after the exercise test while IL-6 was only significantly elevated in two of the athletes (Weinstock et al, 1997). Inflammation post-exercise is to be expected and is not necessarily a bad thing in an acute sense so what these studies show in their results are normal physiological responses. Troubles tend to arise when inflammation becomes chronic and does not return to resting levels after a certain time period post-exercise.
IL-6 and TNF-α have also shown an ability to have large increases in response to single sessions of competitive sports. Souglis et al (2014) investigated acute responses of IL-6 and TNF-α following four male competitive sporting events: soccer, basketball, team handball, and volleyball. Results from the study showed that immediately post-match soccer players showed a 440% increase over pre-competition IL-6 levels and 240% increase over pre-competition TNF-α levels. Respectively, team handball showed 350% and approximately 120% increases,
22
athletes’ levels had returned to baseline by the second day following competition (Souglis et al, 2014). A similar study that only evaluated an elite, international level handball team’s IL-6 response to competition found similar large scale increases following a match with a subsequent return to baseline levels by twenty-four hours post-match (Chatzinikolaou et al, 2014). A comparable phenomenon occurred in thirteen male marathon runners. In these thirteen men, IL-6 levels significantly increased from pre-race to post-race. TNF-α also showed significant increase from pre-race to post-race, however, these increases were not to the same degree as IL-6 increases were (Bernecker et al, 2013). These studies together indicate that highly intense and/or long duration athletic activity have the potential to lead to large scale IL-6 and TNF-α increase and these increases could vary depending on the amount of movement and activity that is occurring as part of the sport or activity. For example, soccer, a sport in which there is more constant movement than volleyball had greater cytokine increases in its athletes than did the male volleyball players. These studies did however focus on athlete’s immunological responses to competitive settings which have other variables such as psychological and mental state that could play a role in responses seen so it is important to also evaluate athlete’s IL-6 and TNF-α responses to non-competitive training and mixed training and competition seasons.
23
both studies were focusing on endurance based athletes and thus the responses seen are in response to aerobic type exercise and work. The elevated levels of IL-6 are of interest as it indicates that there is a point in which overtraining can occur and this could potentially lead to impaired training or competitive performance. It would be important to understand this concept in regards to the study to be performed in this paper. This study will also have a duration of four weeks and if chronic elevations of IL-6 are noticed it could be indication of an inapt training program which is over-taxing the athletes and thus sacrificing some of the quality of the training.
It has been shown in adolescent male basketball players who had cytokine levels analyzed before the beginning of the season, after a six week preparatory period, and after twenty weeks of competition and in-season training; that, TNF-α levels increased significantly by the end of the season over baseline pre-season levels and over measurements taken after the six week preparation training period before the start of competition. In addition, IL-6 levels showed significance increases over end of preparation phase levels but not over pre-season levels. These findings seemed to be indicative of a chronically elevated pro-inflammatory state caused by the micro-trauma muscle damage occurring as a result of training and competition (Brunelli et al, 2014). Another earlier study performed by Brunelli et al (2012) had found no significant increases in TNF-α or IL-6 levels over baseline in twelve young male athletes in response to pre-season preparatory phase training in the absence of competition (Brunelli et al, 2012). Through these two studies, it appears as though there may be a necessity of having competition and training in combination to possibly see a chronic state of elevated
24
preparatory phase training only involved the adolescents in three training sessions per week of approximately ninety minutes and this is a lower volume than what will be seen in the basketball players to be studied (Brunelli et al, 2012). In addition, young teenage athletes may not be able to handle the same intensity of training as elite, collegiate athletes and thus may not experience the same degree of inflammatory responses.
The Prevalence of Chronic Dehydration in Basketball Player Populations
There is a common consensus among those who study and investigate athletic
25
dehydration is rather prominent in amateur and professional basketball players around the
country and the world, the importance of monitoring this during this study and aiding the players in becoming more aware of their hydration status becomes clear (Vukasinovic-Vesic et al, 2015; Osterberg et al, 2009).
Body Composition Changes Across Seasons and Effects on Performance
Bilsborough et al performed a study on ninety elite level Australian football players differing in levels of playing experience to investigate the effects of body composition on athletic performance. Findings from this study showed that athletes who had increased levels of fat free mass showed a greater ability to perform well in resistance training as well as increases in resisted squat jump performance (Bilsborough et al, 2015). Another study conducted by Maciejczyk et al looked at peak anaerobic power in thirty-six recreationally active males on a bike and found that males exhibiting higher body masses as a result of increased body
26
pertinent to track body composition as a means of looking for correlations to other variable changes seen.
Effects of Sleep Deprivation and Sleep Debt Accumulation on Cortisol
27
push protein towards degradation and thus have a negative impact on an athlete’s ability to train at a high level as well as their ability to recover effectively.
RPE Monitoring as a Means of Tracking Training Load
28
29
CHAPTER III: METHODOLOGY
Participants
Fourteen elite-level, highly-trained Division 1 men’s college basketball players, from the University of North Carolina at Chapel Hill that participated in the 2016-17 initial 4 weeks of pre-season strength and conditioning training program, were recruited to participate in this study. Inclusion criteria for participation include:
* Ages between 18 and 24 years old;
* Free of injury that can preclude participation in any aspect of the study; Exclusion Criteria for participation in the study include:
* Not pass a physical examination performed by the team sports physician; * Be on any prescribed medication that can affect responses to exercise training. Instrumentation
Players’ heights (cm) were taken using a wall mounted, tape measured ruler. Weight (kg) was measured on a Transcell Technology TI-500E electronic scale (Transcell Technology, Buffalo Grove, Illiois, USA). Resting heart rate was assessed using the palpation method using the radio artery during a 1 minute time period. Resting Blood pressure was measured manually by auscultation via a Diagnostix 700 aneroid sphygmomanometer (American Diagnostics
30
QuadScan 4000 multi-frequency device and average velocity of bar speed was measured using a Tendo unit (Tendo Sports Machines, Irmo, South Carolina, USA). Eleiko bars and free weights Cemco brand (Cemco Strength Equipment, Inc, South El Monte, California, USA) were used as the main equipment for the training program (Eleiko Sports USA, Chicago, Illinois, USA). Samson racks were used to perform lifts on (Samson Equipment, Inc, Las Cruces, New Mexico, USA) as part of the performance test. Dietary evaluation will be performed using a dietary recall sheet as provided by the University of North Carolina sports nutrition staff (Chapel Hill, North Carolina, USA) and dietary data will be analyzed using Food Processor Nutritional Analysis software produced by ESHA Research (ESHA Research, Salem, Oregon, USA).
Overview of Study
This is a retrospective study using data collected during the 2016-17 4-week pre-season training of Division 1 basketball athletes from the University of North Carolina at Chapel Hill. The athletes underwent performance testing, hydration testing, body composition testing, and dietary tracking as part of this study. Salivary samples were also collected and frozen.
31 Table 3.1: Timeline of Events
Approximate Dates: Events
Mid to Late August 2016 Athletes were introduced to study and signed informed consent form approved by the UNC biomedical IRB (IRB # 16-2189) Late August to Early
September 2016
Baseline Testing of Participants: Hydration testing, salivary biomarker testing, body composition testing, performance testing Mid-September to Early
October 2016
4 Week Training Program with testing as follows: hydration, salivary biomarker, and performance testing twice a week (early and late week) and body composition testing and dietary tracking once a week (late week)
Mid-October 2016 Post-training Testing: Hydration testing, salivary biomarker testing, body composition testing, performance testing
Study Protocol
Recruitment: Basketball players were recruited from the men’s basketball team at The University of North Carolina at Chapel Hill and all have been previously cleared by a team physician for inclusion in Division I level physical activity. All athletes were brought in as a group for a meeting prior to baseline testing. During this meeting, all study procedures were explained in detail and all questions regarding any of the procedures were addressed. Athletes interested in participating in the study were then be asked to sign and date an informed consent form approved by the University Internal Review Board (IRB# 16-2189).
1. Assessments
32
Before conducting any assessment, a research team member checked with the athletes to see if they followed the pre-assessment guidelines. In case the guidelines were not followed strictly, notes were taken and added to the athlete’s study files. Before any assessment, athletes were asked to fill out a sleep quality, fatigue, and muscle soreness questionnaires (See Appendix II).
33 Table 3.2: Assessment Timeline of Events
Assessment to be Performed: Timings of Assessment:
1. Hydration Testing: Urinary Analysis Baseline (week before training program begins), twice weekly throughout study (early week and late week), and post-training; hydration testing occurred in the morning prior to saliva samples being taken 2. Vital Signs Resting heart rate and blood pressure were
assessed before any assessment day
3. Body Weight/Body Height Height was assessed at baseline only, Weight was assessed at baseline, once weekly late in the week, and at the conclusion of the study (post-training)
4. Body Composition Bioelectrical Impedance (BIA) was performed to assess body composition baseline, once weekly late in the week, and post-training
5. Biomarker: Salivary Sampling Saliva samples were collected at baseline, twice weekly during the training program (early week and late week), and
34
6. Performance Testing Performance testing occurred at baseline, twice weekly (early week and late week), and post-training; testing occurred prior to the resistance training sessions and involved a brief warm-up beforehand
7. Dietary Tracking and Analysis Athletes were given dietary recall sheet once per week, late in the week
1. Resting Vital Signs
Resting heart rate was assessed using the palpation method using the radial artery during a 1 minute time period as is procedurally outlined in the ACSM’s Resource Manual for Guidelines for Exercise Testing and Prescription, 7th Edition (Swain & Brawner, 2012).
Resting Blood pressure was measured manually by auscultation via a Diagnostix 700 aneroid sphygmomanometer (American Diagnostics Corporation, Hauppauge, NY USA) and a Litmann stethoscope (3m, St. Paul, MN USA).
2. Hydration Testing: Urinary Analysis
35
urine sample were pipetted out of the cup and used on the refractometer to determine the density of the urine and thus hydration status.
3. Body Height/Body Weight
Athletes’ height was assessed using a wall-mounted, tape measured ruler following procedures outlined in the CDC’s Anthropometry Procedures Manual (National Health and Nutrition Examination Survey, 2007). Athletes’ mass was assessed using a
Transcell Technology TI-500E electronic scale (Transcell Technology, Buffalo Grove, Illiois, USA).
4. Body Composition: Bioelectrical Impedance (BIA)
36
groups of women (Pineau, Guihard-Costa & Bocquet, 2007). The reliability of BIA ranges from 0.97 to 0.99 (ICCs) (Jackson et al., 1988).
5. Biomarkers
Saliva samples were collected using the Passive Drool Technique. This technique involves the athletes producing the saliva in their mouths and then tilting their heads slightly forward to allow the saliva to drip into the saliva collection tube. Athletes were instructed to not forcefully spit the saliva into the collection tube as this could lead to extra air bubbles being in the sample leading to a contamination of the sample. One milliliter of saliva was collected at 8 AM to control for the circadian cortisol changes and was collected twice per week: a beginning of week sample and an end of week sample. Before the saliva samples were collected, the athletes were asked to abide by a few pre-sampling guidelines. Athletes were required to not have brushed their teeth at least thirty minutes prior to the sample being collected.
In addition, athletes were asked to avoid food and drink with artificial colorings in the the morning before the sample was collected and were required to rinse their mouths at least ten minutes prior to the sampling. Once the sample was collected, the samples were placed on ice as quickly as possible and transported back to the Applied Physiology Laboratory on campus at the University of North Carolina-Chapel Hill within an hour of being produced. Once the sample has been returned to the lab, it was centrifuged at -4o Celsius at 3,000 RPM’s, pipetted out of the collection tubes into Cryo vials and stored at -80o C. Cortisol, free testosterone, TNF-α, and IL-6 levels will be assessed using ELISA kits and standard protocols for analysis will be used as outlined on the Salimetrics LLC website (www.salimetrics.com/assets/documents) (Salimetrics LLC, Carlsbad,
37 6. Performance Testing
To monitor increases or decreases in performance for this study, athletes performed three squat jumps twice a week on the same days in which saliva and urine samples were collected. Athletes were instructed to hold a twenty-kilogram Eleiko bar on their backs and perform three repeat squat jumps squatting through their full range of motion. Average velocities of each jump were measured using a Tendo device ((Tendo Sports Machines, Irmo, South Carolina) which is attached around the end of the bar. Average velocities from all three jumps were recorded and the fastest value on each testing day will be used for performance analysis.
7. Dietary Tracking and Analysis
At the conclusion of each week, the athletes were required to fill out a dietary recall of the food they consumed in the week prior. The dietary recall consisted of broader food categories to ease the process for the athletes. Athletes were required to recall the type of food consumed, the way in which the food was prepared, and a general amount that was consumed. After this, each athletes’ dietary record were transferred to the Food Processor Nutritional Analysis software produced by ESHA Research (ESHA Research, Salem, Oregon, USA) which will break down the foods recorded into their various nutritional value as well as nutrient amounts.
2. Training Program
38
men’s basketball strength and conditioning weight room and at university owned and operated outdoor venues (i.e. turf fields, sand volleyball courts, outdoor education spaces). The resistance training sessions lasted approximately ninety minutes in duration while days of aerobic conditioning training, the sessions lasted approximately sixty minutes in duration. On days where both resistance and conditioning training occurred, the resistance training occurred first followed by the aerobic conditioning training. The schedule for the training program aimed to create a dose-response and consisted of the following:
Weeks 1-2: Four resistance training days (Monday, Tuesday, Thursday, & Friday); no aerobic conditioning days
Weeks 3-4: Three resistance training days (Monday, Tuesday, & Thursday); three aerobic/intermittent conditioning days (Monday, Wednesday, & Friday)
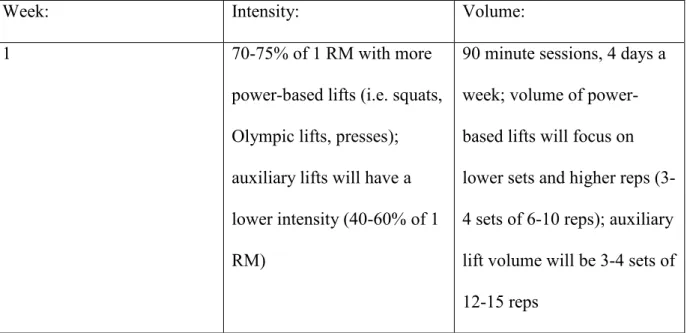
The resistance training and aerobic conditioning programs progressed in duration (volume) and intensity throughout the training program. Below on Table 3 is a detailed description of the intensity and volume of the resistance training:
Table 3.3: Resistance Training Progression
Week: Intensity: Volume:
1 70-75% of 1 RM with more
power-based lifts (i.e. squats, Olympic lifts, presses); auxiliary lifts will have a lower intensity (40-60% of 1 RM)
39
2 75-80% of 1 RM max with
power-based lifts; auxiliary lift intensity will remain the same
90 minute sessions, 4 days a week with higher set, lower rep volume on power-based lifts (6-8 sets, 4-6 reps); auxiliary lifts volume will remain the same
3 80-85% of 1 RM max with
power-based lifts; auxiliary lift intensity will remain the same
90 minute sessions, 3 days a week with higher set, even lower rep volume than previous week working towards maximal strength on power-based lifts (6-8 sets, 2-4 reps); auxiliary lift volume will remain the same
4 85-90% of 1 RM max with
power-based lifts; auxiliary lift intensity will remain the same
90 minutes sessions, 3 days a week with higher set, even lower rep volume than previous week working up towards 1 RM values (8-10 sets, 1-3 reps); auxiliary lift volume will remain the same
40
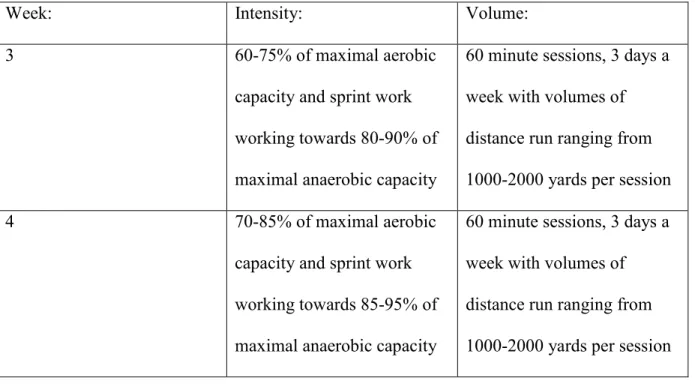
the hang, snatches from the hang, bench pressing, over-head pressing, and deadlifts (and deadlift variations) were incorporated into the programming with the intent of building maximal strength and maximal force production. Auxiliary lifts included variations of back extensions, pull-ups, reverse hypers, rows, curls, and abdominal work and were used to build up muscular endurance of the athletes. Below in Table 4 is a detailed description of the intensity and volume of the aerobic/intermittent training:
Table 3.4: Aerobic/Intermittent Training Progression
Week: Intensity: Volume:
3 60-75% of maximal aerobic
capacity and sprint work working towards 80-90% of maximal anaerobic capacity
60 minute sessions, 3 days a week with volumes of distance run ranging from 1000-2000 yards per session
4 70-85% of maximal aerobic
capacity and sprint work working towards 85-95% of maximal anaerobic capacity
60 minute sessions, 3 days a week with volumes of distance run ranging from 1000-2000 yards per session
41 Statistical Analysis
This is an observational study with a single group where physical fitness, body
composition, hydration status, and biomarker of stress data were collected throughout a 4-week pre-season strength and conditioning training program in Division I basketball players with the goal of observing potential alterations on these study parameters as a results of the training regimen. A secondary objective was to evaluate the relationship between changes in physical fitness, body composition, hydration status, biomarker alterations and total training loads. In the initial analysis of the data, study variables were examined independently of one another to observe changes that were out of the ordinary. Variables that showed unexpected changes were then be correlated with weekly training volume changes to evaluate the strength of the
42
43
CHAPTER IV: RESULTS
The purpose of this observational study was to profile the responses of hydration status, body composition, salivary biomarkers of stress, training loads, and performance changes in Division 1 basketball players throughout a 4-week pre-season strength and conditioning training cycle. A secondary purpose evaluated the relationship between changes in physical fitness (performance test), hydration status, body composition, salivary biomarkers of stress, and training loads of variables that demonstrated trends of changes deemed to be of clinical relevance.
Subjects
44 Figure 4.1: Data Collection Timeline
Baseline Early Week 2 Late Week 2 Early Week 3 Late Week 3 Early Week 4 Late Week 4
Hydration Hydration Hydration Hydration Hydration Hydration Hydration
Performance Performance Performance Performance
Saliva Saliva Saliva Saliva Saliva Saliva
Volume* Volume* Volume* Volume*
*= volume was calculated on a weekly basis at the end of each week including week 1 (Baseline)
Body Composition
Below in Table 4.1 are results from the BIA body scan that was used to evaluate body composition. Three total BIA scans were completed during the study (at baseline, mid-point, and at the end of the study late on week 4). Data is presented as absolute changes for each player. Table 4.1: Body Fat Percentages (body fat shown as percentage for each individual player at each time point)
Player ID Baseline Mid-point Conclusion
1 11.6 11.8 11.3
2 9.5 11.5 10.8
3 12.6 13.2 13.7
4 18.3 13.8 no data
5 13.3 14.8 16.7
6 9.9 9.8 8
7 9.9 11.8 no data
9 6.9 8.1 8.1
10 13.8 14.8 15.1
11 12.4 11.9 13.1
12 10.2 10 11.5
13 17.4 17 16.4
14 21.2 21 20.4
Hydration
45
specific gravity scores for players across seven time points: baseline and then twice weekly (early week and late week) for the following three weeks with the last measurement assessed late in week 4 (end of the study).
Table 4.2: Urine Specific Gravity Scores (means ± standard deviations with ranges in parentheses)
Baseline Early Week 2 Late Week 2 All Players 1.021 ± .004
(1.015-1.030)
1.020 ± .006 (1.008-1.028)
1.020 ± .008 (1.005-1.030) Freshmen 1.023 ± .004
(1.019-1.027)
1.022 ± .004 (1.016-1.026)
1.019 ± .010 (1.005-1.030) Upper-Classmen 1.021 ± .005
(1.015-1.030)
1.020 ± .006 (1.008-1.028)
1.020 ± .008 (1.006-1.028)
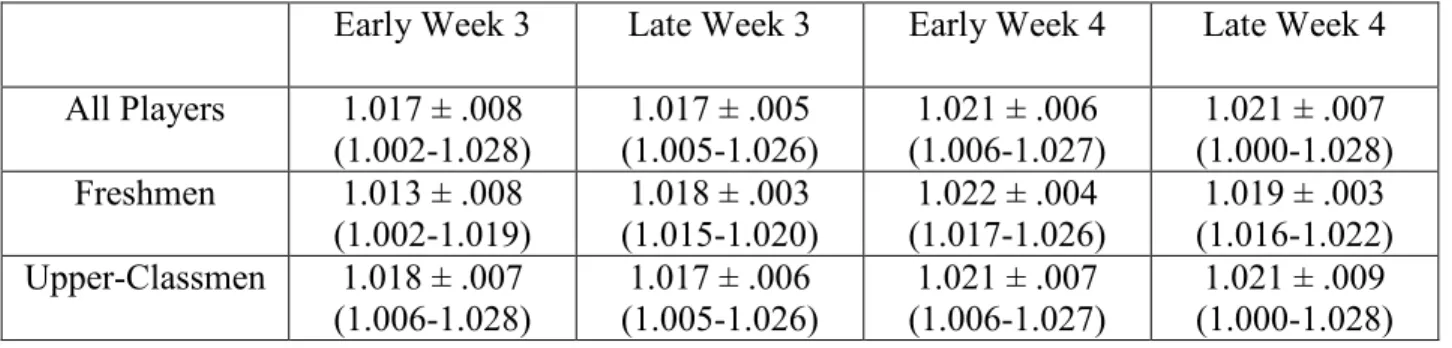
Table 4.3: Urine Specific Gravity Scores cont. (means ± standard deviations with ranges in parentheses)
Early Week 3 Late Week 3 Early Week 4 Late Week 4 All Players 1.017 ± .008
(1.002-1.028)
1.017 ± .005 (1.005-1.026)
1.021 ± .006 (1.006-1.027)
1.021 ± .007 (1.000-1.028) Freshmen 1.013 ± .008
(1.002-1.019)
1.018 ± .003 (1.015-1.020)
1.022 ± .004 (1.017-1.026)
1.019 ± .003 (1.016-1.022) Upper-Classmen 1.018 ± .007
(1.006-1.028)
1.017 ± .006 (1.005-1.026)
1.021 ± .007 (1.006-1.027)
1.021 ± .009 (1.000-1.028)
Training Load
46
Table 4.4: Weekly Session-RPE Scores (means ± standard deviations with ranges in parentheses)
Week 1 Week 2 Week 3 Week 4
All Players 4492.8 ± 443.2 (3655-5223)*
3870.5 ± 372.2 (3133-4314)
4715.3 ± 474.9 (3651-5337)
3479.2 ± 360.5 (2680-3950) Freshmen 4330.4 ± 296.0
(4044-4683)
3920.1 ± 190.2 (3643-4060.5)
4779.8 ± 359.6 (4469-5299)
3499.4 ± 232.8 (3170-3670) Upper-Classmen 4573.9 ± 498.5
(3655-5223)*
3848.4 ± 438.9 (3133-4314)
4686.7 ± 535.5 (3651-5337)
3470.3 ± 417.5 (2680-3950) *Subject 13’s week 1 training load was exempt from mean calculations as he missed two days of activity with a minor injury and thus had a low weekly training load of 1349.
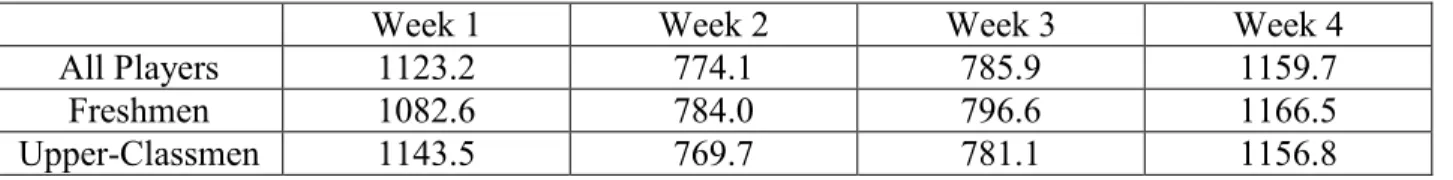
Table 4.5: Average Daily Session-RPE Scores Per Week (Weekly S-RPE Score/number of training days for that particular week)
Week 1 Week 2 Week 3 Week 4
All Players 1123.2 774.1 785.9 1159.7
Freshmen 1082.6 784.0 796.6 1166.5
Upper-Classmen 1143.5 769.7 781.1 1156.8
Performance Tests
47
Table 4.6: Peak Velocity Measurements (mean ± standard deviation with ranges in parentheses; measurements recorded in meters/second)
Baseline Early Week 2 Early Week 3 Early Week 4 All Players 2.99 ± .21
(2.67-3.4)
2.93 ± .32 (2.55-3.24)
3.05 ± .15 (2.70-3.24)
2.99 ± .20 (2.55-3.36) Freshmen 2.81 ± .18
(2.67-2.92)
2.74 ± .13 (2.55-2.86)
2.91 ± .16 (2.70-3.1)
2.86 ± .25 (2.55-3.17) Upper-Classmen 3.08 ± .19
(2.75-3.4)
3.02 ± .12 (2.86-3.24)
3.12 ± .08 (2.98-3.24)
3.05 ± .15 (2.86-3.36)
Salivary Hormones
Below in Table 4.6 are the group means for the saliva data on testosterone while Table 4.7 contains the groups means for cortisol. Saliva was planned to be collected on all seven collection days as the case was with urine however on the early week 3 collection day saliva was unable to be collected.
Table 4.7: Free Testosterone Levels (measured in pg/mL; means ± standard deviations with ranges in parentheses)
All Players Freshmen Upper-Classmen Baseline 118.11 ± 39.77
(53.66-208.63)
114.55 ± 17.37 (91.00-132.44)
119.69 ± 47.44 (53.66-208.63) Early Week 2 117.89 ± 28.63
(80.32-162.57)
136.82 ± 16.04 (124.84-160.48)
109.48 ± 29.57 (80.32-162.57) Late Week 2 115.11 ± 33.92
(70.99-201.99)
111.48 ± 26.54 (84.33-145.85)
111.692 ± 38.66 (70.99-201.99) Late Week 3 121.56 ± 31.53
(77.65-192.39)
115.24 ± 37.33 (77.65-152.31)
123.93 ± 31.60 (81.52-192.39) Early Week 4 121.31 ± 55.77
(61.86-275.53)
121.35 ± 14.94 (107.81-137.38)
121.29 ± 66.18 (61.86-275.53) Late Week 4 118.74 ± 35.84
(71.10-178.04)
140.64 ± 26.44 (122.57-170.96)
48
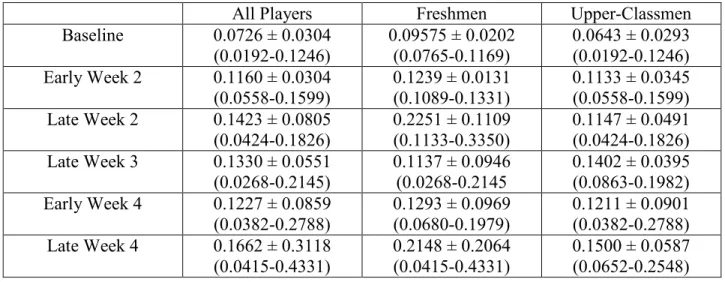
Table 4.8: Cortisol Levels (measured in µg/dL; means ± standard deviations with ranges in parentheses)
All Players Freshmen Upper-Classmen Baseline 0.0726 ± 0.0304
(0.0192-0.1246)
0.09575 ± 0.0202 (0.0765-0.1169)
0.0643 ± 0.0293 (0.0192-0.1246) Early Week 2 0.1160 ± 0.0304
(0.0558-0.1599)
0.1239 ± 0.0131 (0.1089-0.1331)
0.1133 ± 0.0345 (0.0558-0.1599) Late Week 2 0.1423 ± 0.0805
(0.0424-0.1826)
0.2251 ± 0.1109 (0.1133-0.3350)
0.1147 ± 0.0491 (0.0424-0.1826) Late Week 3 0.1330 ± 0.0551
(0.0268-0.2145)
0.1137 ± 0.0946 (0.0268-0.2145
0.1402 ± 0.0395 (0.0863-0.1982) Early Week 4 0.1227 ± 0.0859
(0.0382-0.2788)
0.1293 ± 0.0969 (0.0680-0.1979)
0.1211 ± 0.0901 (0.0382-0.2788) Late Week 4 0.1662 ± 0.3118
(0.0415-0.4331)
0.2148 ± 0.2064 (0.0415-0.4331)
0.1500 ± 0.0587 (0.0652-0.2548)
Exploratory Analysis
Variables that appeared to potentially have noticeable change throughout the four-weeks training program were correlated with the performance measurement. Relationships between individual urine specific gravity scores and individual peak velocity produced on the
performance test were evaluated. Each regression compared the early week score of each of the variables to the baseline value and correlated the delta scores (percent changes). Thus, the change percentage in urine specific gravity from week one to week two was regressed with the peak velocity change from week one to week two and so on for week’s three and four. No significant relationships were observed (p >.05) (R=.071, .234, and .321 respectively).
49
A simple regression between the percent change score from baseline to early week four between testosterone and peak velocity values was explored. No significant relationship was observed (p >.05) (R=.442).
A relationship between the percent change score from baseline to early week four cortisol values and peak velocity value was explored. No significant relationship was observed (p >.05) (R=.024).
50
CHAPTER V: DISCUSSION
Overview of Study
The purpose of this observational study was to profile and observe a wide spectrum of physiological and physical responses in elite level Division-I basketball players to a pre-season strength and conditioning training cycle. To our knowledge, no study to date has attempted to take this approach in profiling elite level collegiate basketball players in the way in which we have attempted to with the goal of observing potential relationships between changing training load and various physiological parameters along with associations to performance. Due to the nature of the study, there were certain aspects of the study that were out of control of the
51
samples and data collected during this study have given the research team a rare opportunity to get an inside look at the physiologic responses of some of the most talented and gifted collegiate basketball players in the world. The biomarkers observed in this study along with the tracking of training loads and physical performance variables has brought to light certain trends seen within this group of players that will most certainly help guide future research.
Body Composition
52 Hydration
It has been well documented that dehydration is a major problem and has a high prevalence in both amateur and professional basketball players (Osterberg et al, 2009; Vukasinovic-Vesic et al, 2015). Looking at the results of the urine specific gravity tests
throughout this study it appears as though there was certain times during the study in which the group as a whole was certainly at least suffering from moderate dehydration [USG score above 1.020 (Osterberg et al, 2009)] based on their urine specific gravity scores. As demonstrated in Figure 5.1, the group of players as a whole trended towards a state of better hydration status from weeks one to three however then trended back towards a more dehydrated state by week four. Figures 5.2 and 5.3 demonstrate that the sub-groups of players (freshmen and upperclassmen) both experienced similar trends towards a more euhydrated state from weeks one to three followed by a decline back to dehydration during week four. The solid black line in the figures below indicates the 1.020 score in which any scores above this are defined in the literature as a marker of dehydration.
Collection Number Key for Hydration Graphs: 1 = Baseline
54
Perhaps a more understandable and usable way to interpret hydration status is to look at the total number of players at each collection day that could be deemed at least moderately dehydrated. Literature states that urine specific gravity scores above 1.020 can be indicative of dehydration ranging from three to five percent of body weight (Osterberg et al, 2009). Table 5.1 depicts this
Table 5.1: Number of Dehydrated Players per Collection Point
Collection Point # of Dehydrated Players (% of total) Baseline 7 (53.85%)
Early Week 2 7 (53.85%) Late Week 2 6 (46.15%)
55 Late Week 4 8 (61.54%)
The reasoning behind the decreases in number of dehydrated players seen from baseline to week three of the study could be as simple as a greater recognition by the players of trying to hydrate. As urine was being collected, the players would ask questions about their hydration status and members of the research team would give them feedback. In addition, the strength and conditioning and athletic training staff associated with the players would look at the hydration scores and talk to certain players who were having higher scores demonstrating potential poor rehydration habits. This increased recognition of hydrations status could have led the players to take greater notice of their hydration habits as the study progressed. However, then this begs the question what caused this recognition to not cause the same effects into the last week of the study. Why then did the number of dehydrated athletes increase back to baseline levels during week four? To further investigate and explore these questions, a further look into the potential effects of the cumulative load of training and the awareness of players recognizing the influence of proper hydration of performance and recovery, should be explored in a
prospective experiment.
Hydration and Training Load
56
In addition, evaluating the percent change in training volume from week to week is important for gauging potential relationships between the urine specific gravity scores and changing training volumes. In Table 5.2 below, the training load percent change per week is shown.
Table 5.2: Training Load Percent Change by Week
Week 1 Week 2 Week 2 Week 3 Week 3 Week 4 Percent Change over
Previous Week
-13.8% +21.8% -26.2%
57
three of training load tracking. Studying the training load numbers, week two clearly has a lower average training load than week three with week three having the highest average training load of any of the weeks. The percent change in training loads from week two to week three was a 21.8% increase. Perhaps this acute increase in training load during week three was enough to cause some negative impact of the hydration status of the players. In addition, week three of the study had the most days of activity with six which included the players’ first official exhibition game of the year. Also of note is that the late week three urine collection time point (which showed the fewest number of dehydrated athletes throughout the entire study) came on the day following the only rest day during week three. After this, the players had four straight days of training leading up to the early week four collection date. It appears as though a combination of these factors may have played at least somewhat of a role in negating rehydration efforts.
Hydration and Performance
Concluding that there was at least some interaction between the training load and hydration status it is important also to look at possible effects of hydration status and the
58
Week three presented the highest team mean peak velocity throughout the four week training cycle with a subsequent decline in the team mean peak velocity the following week. While these changes were small, often times only tenths of a percentage, if they were to persist on they could raise some red flags for the strength and conditioning staff. It’s difficult to determine how much of a change in peak velocity development would affect athletic
performance directly. Any time the basketball strength and conditioning staff sees decreases in peak velocity or other performance parameters, it is a cause at least for conversation into
59
whole team trend seen here (Minshull & James, 2013). However, others have produced results indicating that hydration status has little to no real impact on muscular strength or the muscle’s ability to produce force (Hayes & Morse, 2010).
What we have found in this research seems to point that hydration played some type of role or had some type of connection to the performance of the athletes on the peak velocity test. The magnitude of this effect is hard to judge accurately but with the purpose of this study to observe and report this is one observation that shouldn’t be overlooked. Hydration status is a well-known and widely used marker for readiness to perform for athletes. For athletes who are dehydrated, the fix is simple: drink more water. Yet just because the fix is simple does not mean that athletes practice good hydration habits. Being dehydrated may not decrease athletic
performance to the degree that some studies have shown, however dehydration will also surely not help athletic performance. Therefore, as simple as it seems, assumptions should not be made that all athletes are hydrating well. For four of the seven urine collection days of this study, half or over half of the players were in at least a moderate (if not worse) dehydrated state. They all know hydration is important, however what they lack may be the awareness of their hydration state. I firmly believe that this study brought more awareness to them earlier in the season than would normally be the case and perhaps that played a role in being able to perform and succeed the way they did this season.
Training Load and Performance
Looking further into the potential relationships seen during this study, more specifically during the time points that have been discussed previously in the hydration section (week two week three), it is important to consider the possible affects training load may have on