UNDERSTANDING SPATIAL PATTERNS OF PHYSICAL ACTIVITY: MEASUREMENT IMPLICATIONS FOR EPIDEMIOLOGIC RESEARCH
Katelyn Marie Holliday
A dissertation submitted to the faculty at the University of North Carolina at Chapel Hill in partial fulfillment of the requirements for the degree of Doctor of Philosophy in the Department
of Epidemiology in the Gillings School of Global Public Health.
Chapel Hill 2016
© 2016
ABSTRACT
Katelyn Marie Holliday: Understanding Spatial Patterns of Physical Activity: Measurement Implications for Epidemiologic Research
(Under the direction of Kelly R. Evenson)
Physical activity (PA) is linked to prevention of a spectrum of chronic diseases,
compression of morbidity, and improved quality of life. Yet, most adults do not engage in the recommended amount of PA. Thus, identifying factors that increase PA is an important research focus. Researchers advocate use of theoretical frameworks, which propose that a variety of factors (e.g., environmental, social, and policy) work together to influence health behavior. The built environment is a factor suggested by theoretical frameworks that is of particular interest for PA given its potential as an intervention target at the population level. Due to the complex
ACKNOWLEDGEMENTS
I would like to thank my dissertation advisor, Kelly Evenson, and the rest of my committee for providing thought-provoking feedback over the past few years and for having patience with me as I worked through the long data coding process. I think the end product is worth the numerous hours spent coding, and I am grateful they supported my decision to complete the task.
Many Epidemiology Department mentors and student peers provided support throughout graduate school, and I am thankful for their dedication to creating an environment that
encourages learning, collaboration, and success. Special thanks to Amanda Eudy for the countless hours we spent studying together, discussing research woes, and developing a
friendship I will always treasure and to Lindsay Fernández-Rhodes for being the best officemate and ally.
TABLE OF CONTENTS
LIST OF TABLES ... x
LIST OF FIGURES ... xiii
LIST OF ABBREVIATIONS ... xv
CHAPTER 1: INTRODUCTION ... 1
CHAPTER 2: STATEMENT OF SPECIFIC AIMS ... 3
Specific Aim I. ... 3
Specific Aim II. ... 3
Specific Aim III. ... 5
CHAPTER 3: REVIEW OF THE LITERATURE ... 6
Locational Context of Physical Activity ... 6
Measuring Built Environment Attributes that Influence Physical Activity: Residential Buffers and the Concept of Activity Space. ... 11
Use of Geographic Positioning Systems to Reliably Measure Locations of Physical Activity: How Many Monitoring Days are Needed? ... 16
CHAPTER 4: OVERARCHING METHODS ... 26
Study Population ... 26
Outcome Assessment ... 27
Exposure Assessment ... 29
Data Cleaning, Reduction, and Handling of Missing Data ... 31
Power ... 32
Introduction ... 37
Methods ... 39
Study Population ... 39
Physical Activity Assessment ... 39
Location Assessment ... 41
Statistical Analysis ... 43
Results... 43
Participant Sociodemographic Characteristics ... 43
Time Spent in Physical Activity Intensities ... 44
Physical Activity Locations ... 44
PA Locations by Participant Sociodemographic and Study Characteristics ... 45
PA in Participant Homes ... 45
PA on Roads ... 46
PA in Parks ... 47
Discussion ... 49
Limitations ... 52
Conclusion ... 53
CHAPTER 6: ARE RESIDENTIAL BUFFERS REPRESENTATIVE OF ADULT PHYSICAL ACTIVITY SPACE? ... 72
Introduction ... 72
Methods ... 74
Study Population ... 74
Physical Activity Assessment ... 75
Physical Activity Location Monitoring ... 76
Geographic Analyses ... 77
Results... 79
Discussion ... 83
CHAPTER 7: DERIVING A GPS MONITORING TIME RECOMMENDATION FOR PHYSICAL ACTIVITY STUDIES OF ADULTS ... 109
Introduction ... 109
Methods ... 110
Study Population ... 110
Physical Activity and Location Assessment ... 111
Statistical Analyses ... 113
Results... 115
Discussion ... 118
CHAPTER 8: CONCLUSIONS ... 131
Overall Summary ... 131
Where are adults active? ... 131
Do residential buffers represent adult PA space? ... 132
How long should a GPS be worn in PA studies? ... 133
Strengths ... 133
Limitations ... 134
Public Health Significance ... 137
Future Directions ... 139
Conclusions... 140
APPENDIX: SOPARC GPS SUB-STUDY ... 141
Purpose ... 143
Using Google Fusion Tables ... 145
Location Coding Protocol Overview ... 148
Location Coding Protocol ... 149
Steps For Removing Data From Google Fusion Tables ... 157
LIST OF TABLES
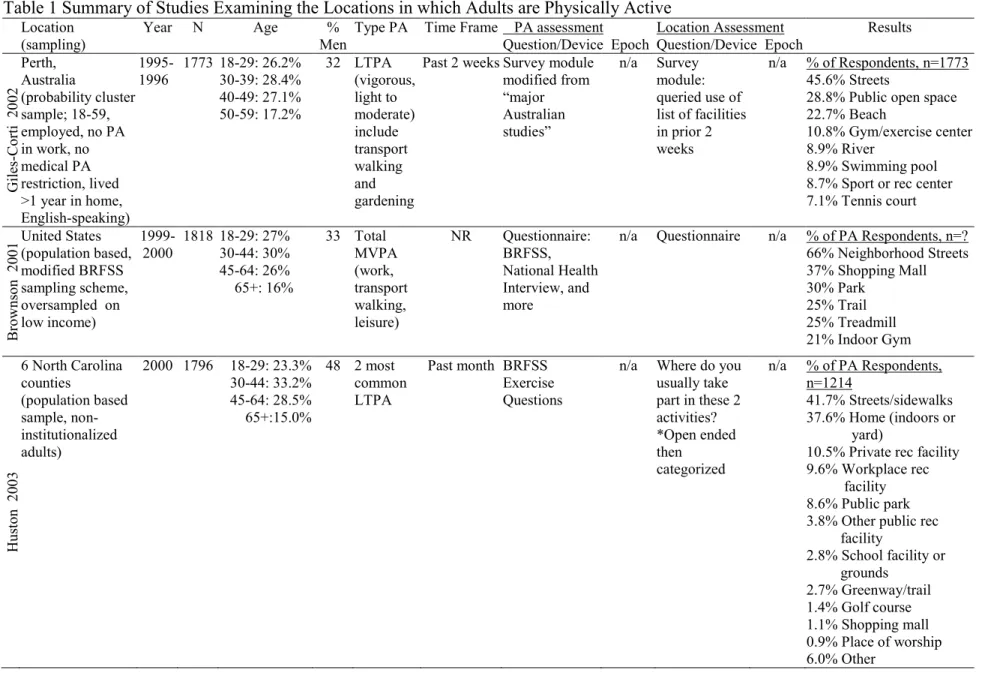
Table 1 Summary of Studies Examining the Locations in which Adults are Physically Active ... 18 Table 2. Studies examining the overlap between actual physical activity space and traditionally assigned spaces ... 25 Table 3. Sociodemographic Characteristics of 248 Participants Enrolled in the SOPARC GPS Sub-Study 2009-2011. ... 34 Table 4. Number of Participants with Various Combinations of Compliant Wear Day Definitions and Required Numbers of Compliant Days of the 248 Participants Enrolled in the SOPARC GPS Study 2009-2011 ... 35 Table 5. Sociodemographic Characteristics of Participants in the SOPARC GPS Study 2009-2011 ... 54 Table 6. Total, Median per Participant, and Percent of Matthews’ MVPA, NHANES MVPA, and NHANES VPA Bout Minutes Spent in Each Location Type among SOPARC GPS Sub-Study Participants Over Three Weeks, 2009-2011 ... 55 Table 7. Percent of MVPA Bout Minutes Spent in Three Location Types by
Sociodemographic Characteristics of Participants in the SOPARC GPS Sub-Study, 2009-2011 ... 56 Table 8. Number of Participants and PA Minutes by PA Intensity and Gender ... 58 Table 9. Number of Participants and PA Minutes by PA Intensity and Age... 60 Table 10. Number of Participants and PA Minutes by PA Intensity and
Table 16. Sociodemographic Characteristics of Participants in the SOPARC GPS Study 2009-2011 ... 91 Table 17. Median (Interquartile Range) Percent of Moderate to Vigorous Physical Activity Bout Minutes Located within Residential Buffers per Participant in the SOPARC GPS Sub-Study, 2009-2011 (N=217) ... 92 Table 18. Median (Interquartile Range) Percent of Moderate to Vigorous Physical Activity Bout Minutes Located within Residential Buffers by Sociodemographic Characteristics of Participants in the SOPARC GPS Sub-Study, 2009-2011 (N=217) ... 93 Table 19. Median (Interquartile Range) Percent of Residential Buffers Covered by Physical Activity Spaces per Participant in the SOPARC GPS Sub-Study, 2009-2011 (N=217) ... 94 Table 20. Median (Interquartile Range) Percent Residential Network Buffers Covered by Physical Activity Spaces Stratified by Sociodemographic
Characteristics in the SOPARC GPS Sub-Study, 2009-2011 (N=217) ... 95 Table 21. Median (Interquartile Range) Percent of Physical Activity Spaces Covered by Residential Buffers per Participant in the SOPARC GPS Sub-Study, 2009-2011 (N=217) ... 96 Table 22. Median (Interquartile Range) Percent of Physical Activity Spaces Covered by Residential Network Buffers Stratified by Sociodemographic
Characteristics in the SOPARC GPS Sub-Study, 2009-2011 (N=217) ... 97 Table 23. Median (Interquartile Range) Percent of Moderate to Vigorous Physical Activity Bout Minutes Located within Five Mile Residential Buffers by
Sociodemographic Characteristics in the SOPARC GPS Sub-Study, 2009-2011 (N=217) ... 98 Table 24. Median (Interquartile Range) Percent of Residential Circular Buffers Covered by Physical Activity Spaces Stratified by Sociodemographic
Characteristics in the SOPARC GPS Sub-Study, 2009-2011 (N=217) ... 99 Table 25. Median (Interquartile Range) Percent of Five Mile Residential Buffers Covered by Physical Activity Spaces Stratified by Sociodemographic
Characteristics in the SOPARC GPS Sub-Study, 2009-2011 (N=217) ... 100 Table 26. Median (Interquartile Range) Percent of Physical Activity Spaces Covered by Residential Circular Buffers Stratified by Sociodemographic
Characteristics in the SOPARC GPS Sub-Study, 2009-2011 (N=217) ... 101 Table 27. Median (Interquartile Range) Percent of Physical Activity Spaces Covered by Five Mile Residential Buffers Stratified by Sociodemographic
Table 28. Sociodemographic Characteristics of Participants with Physical Activity Bouts Not at the Participant’s Home Address in the SOPARC GPS Sub-Study 2009-2011. ... 103 Table 29. Median (Interquartile Range) Percent of Not at Home Moderate to Vigorous Physical Activity Bout Minutes Located within Residential Buffers by
Sociodemographic Characteristics in the SOPARC GPS Sub-Study, 2009-2011 (N=217) ... 104 Table 30. Median (Interquartile Range) Percent of Residential Circular Buffers Covered by Physical Activity Spaces Stratified by Sociodemographic Characteristics for Physical Activity Bouts Not at Home in the SOPARC GPS Sub-Study, 2009-2011 (N=217) ... 105 Table 31. Median (Interquartile Range) Percent of Five Mile Circular Residential Buffers Covered by Physical Activity Spaces Stratified by Sociodemographic Characteristics for Physical Activity Bouts Not at Home in the SOPARC GPS Sub-Study, 2009-2011 (N=217) ... 106 Table 32. Median (Interquartile Range) Percent of Physical Activity Spaces Covered by Circular Residential Buffers Stratified by Sociodemographic
Characteristics for Physical Activity Not at Home in the SOPARC GPS Sub-Study, 2009-2011 (N=217) ... 107 Table 33. Median (Interquartile Range) Percent of Physical Activity Spaces Covered by Five Mile Circular Residential Buffers Stratified by Sociodemographic
Characteristics for Physical Activity Not at Home in the SOPARC GPS Sub-Study, 2009-2011 (N=217) ... 108 Table 34. Participant Sociodemographic Characteristics, SOPARC GPS Sub-Study 2009-2011 ... 124 Table 35. GPS Monitoring Recommendations for Estimating Minutes of Physical Activity in Bouts for Various Location Types with ≥80% Reliability Given Compliant
LIST OF FIGURES
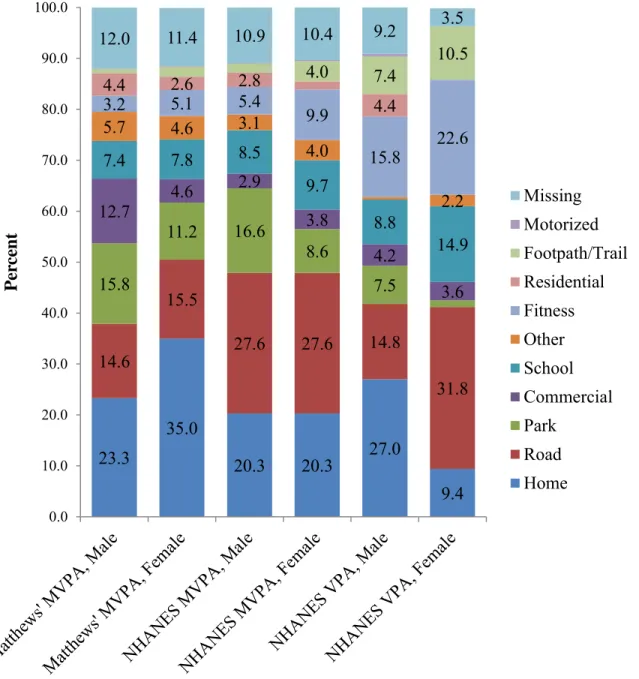
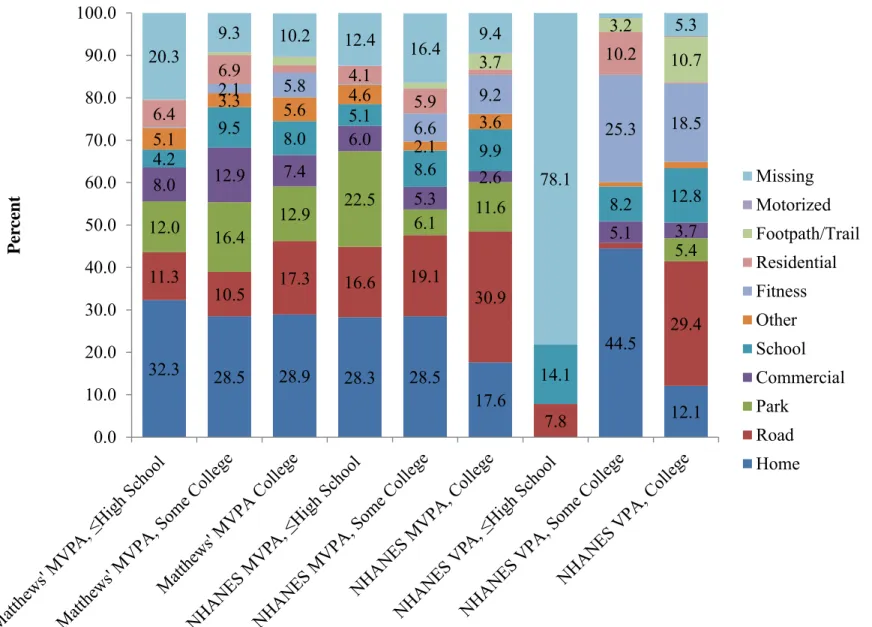
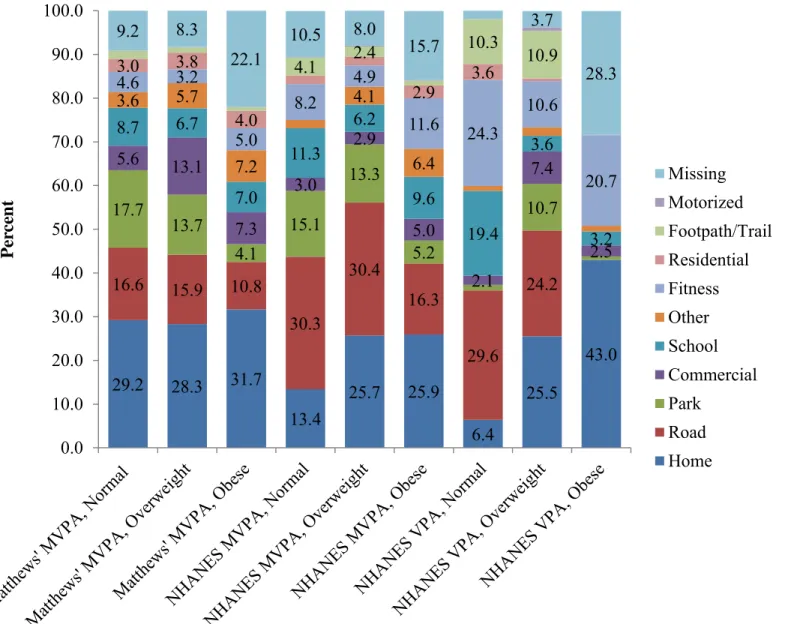
Figure 1. Sample Size Needed to Produce an ICC with ±0.1 Precision vs. Number of Monitoring Days ... 36 Figure 2. Percent of Physical Activity Bout Minutes in Each Location by Physical Activity Intensity and Gender. Unlabeled proportions represent ≤2% ... 57 Figure 3. Percent of Physical Activity Bout Minutes in Each Location by Physical Activity Intensity and Age. Unlabeled proportions represent ≤2% ... 59 Figure 4. Percent of Physical Activity Bout Minutes in Each Location by Physical Activity Intensity and Race/Ethnicity. Unlabeled proportions represent ≤2% ... 61 Figure 5. Percent of Physical Activity Bout Minutes in Each Location by Physical Activity Intensity and Education. Unlabeled proportions represent ≤2% ... 63 Figure 6. Percent of Physical Activity Bout Minutes in Each Location by Physical Activity Intensity and BMI Category. Unlabeled proportions represent ≤2% ... 65 Figure 7. Percent of Physical Activity Bout Minutes in Each Location by Physical Activity Intensity and Recruitment State. Unlabeled proportions represent ≤2% ... 67 Figure 8. Percent of Physical Activity Bout Minutes in Each Location by Physical Activity Intensity and Recruitment Location. Unlabeled proportions represent ≤2% ... 69 Figure 9. Minimum convex polygon of overall physical activity space compared with actual physical activity GPS points during three physical activity bouts from one individual (simulated data) ... 88 Figure 10. Individual physical activity bout defined minimum convex polygon physical activity space compared with actual physical activity GPS points during the three physical activity bouts from one individual displayed in Figure 1
LIST OF ABBREVIATIONS BMI Body mass index
CA California
CM Centimeter
CPSTF Community Preventative Services Task Force GIS Geographic Information Systems
GPS Geographic positioning system ICC Intraclass Correlation Coefficient
KM Kilometer
M Meter
MI Mile
MVPA Moderate to vigorous physical activity
NC North Carolina
NHANES National Health and Nutrition Examination Survey
NM New Mexico
OH Ohio
PA Physical activity SD Standard Deviation
US United States
VPA Vigorous physical activity
CHAPTER 1: INTRODUCTION
According to the World Health Organization, physical inactivity is the fourth leading risk factor for mortality globally (1). Recent analyses suggest that inactivity is responsible for 5.3 million annual deaths globally (2). It accounts for 21-25% of breast and colon cancer burden, 27% of diabetes burden, and 30% of ischemic heart disease burden as measured by disability adjusted life years (1). The United States Department of Health and Human Services states that there is strong evidence that physical activity (PA) lowers risk of early death, coronary heart disease, stroke, high blood pressure, adverse blood lipid profile, type 2 diabetes, metabolic syndrome, colon and breast cancer, weight gain, falls, and depression as well as decreased cognitive function among older adults (3). Despite these numerous benefits of PA, most Americans do not meet national guidelines. Recent analyses in the National Health and
Nutrition Examination Survey (NHANES) found that only 10% of adults meet the recommended levels of PA as measured by accelerometry (4). Moreover, 32% (45% of those aged 65+)
reported being completely inactive during leisure time in 2011 (5).
directly through automatic, reactive processes or indirectly through behavior decision-making processes (8). Within this framework, individual characteristics, like sociodemographic factors and personality, may moderate the mechanism by which the environment influences PA as well as the strength of that influence (8).
The built environment is a factor suggested by theoretical frameworks that is of particular interest for PA given its potential as an intervention target at the population level. It has been defined as encompassing urban design, land use, and the transportation system and considers the patterns of human activity within the physical environment (9). Thus, questions about the locational context of PA and attributes of the built environment that support PA are primary questions of interest in this field. Given the complex mechanisms by which built environment factors influence PA, its study has incorporated input from a range of disciplines, including epidemiology, exercise and sport sciences, urban planning, geography, and health behavior (10). While input from these varied fields is beneficial, it has resulted in inconsistent exposure and outcome definitions, measurement practices, and analytic methods. These differences may contribute to the discrepancies observed in many exposure-outcome relationships. At the very least, they complicate comparison of results across studies and disciplines.
The focus of this research is therefore on informing three distinct methodological issues that involve identifying and appropriately measuring attributes of the built environment locations in which PA occurs. This research will provide useful information for researchers, health
CHAPTER 2: STATEMENT OF SPECIFIC AIMS Specific Aim I.
Specific Aim IA. Develop a protocol for identifying locations (e.g. roads, parks, recreation facilities, homes) in which adult participants engage in ten or more minute bouts of moderate to vigorous PA (MVPA) and vigorous PA (VPA) from concurrently collected Geographic Positioning Systems (GPS) and accelerometer data.
Specific Aim IB. Implement this protocol within the System for Observing Play and Recreation in Communities (SOPARC) GPS sub-study. Explore whether results are modified by major sociodemographic factors (gender, age, race, education) as well as by body mass index (BMI), state of recruitment, and location of recruitment (park vs. home near park).
Hypotheses: Streets and homes will be the most common locations for MVPA. Location of MVPA differs by sociodemographic factors, with females, older adults, and those with lower education participating in MVPA nearer to home than males, younger adults, and those of higher education. Individuals recruited from parks are hypothesized to have more MVPA time in parks than those recruited from their homes.
Specific Aim II.
Specific Aim IIA. Examine the percent of MVPA bout minutes within various
least ten minutes based on the concept of activity space, including 1) an overall PA space derived from mapping all bout-based MVPA GPS points over a three-week period at once in a single minimum convex polygon and 2) an individual bout-based PA space derived from mapping each individual bout of MVPA over the three-week period into multiple minimum convex polygons.
Specific Aim IIC. Examine what percent of residential buffers (circular or network) are covered by the PA spaces of individuals measured by GPS in the SOPARC GPS sub-study in order to determine what portion of residential buffers are used for PA.
Specific Aim IID. Examine what percent of PA spaces of individuals measured by GPS in the SOPARC GPS sub-study are covered by their residential buffers (circular or network) in order to determine what portion of PA space occurs within residential buffers.
Specific Aim IIE. Examine whether sociodemographic factors (gender, age, race, education) as well as BMI and state of recruitment moderate Specific Aims IIA-D. Specific Aim IIF. Examine Specific Aim II A-E after exclusion of PA points occurring at the home. The built environment may indirectly influence PA at home, where a large proportion of PA occurs. For example, non-supportive built environments could result in reduced residential neighborhood PA and increased home PA. Yet, interest in the direct effects of the built environment on PA occurring outside of the home is also of
importance. Therefore, examining both PA spaces that include home PA and PA spaces that exclude home PA is of interest.
and network buffers, but at the same time will not include all of the space within these buffers.
Specific Aim III.
CHAPTER 3: REVIEW OF THE LITERATURE
This research contributes to several important methodological questions for the study of PA while also providing needed substantive data on the types of locations in which individuals are active. The first aim develops a location coding protocol designed to identify locations of PA from GPS points and implements the protocol within a sociodemographically and geographically diverse adult population. The second aim extends the methodologic methods for examining characteristics of the locations in which adult PA occurs by examining the appropriateness of commonly used residential buffers as summarizations of built environment exposures during PA. In this aim, PA space is proposed as a more accurate summarization of the spatial locations in which individuals complete PA. The spatiotemporal patterns of PA space in relation to residential buffers are then examined. Finally, the third aim derives a recommendation for the length of time a GPS should be worn when attempting to reliably estimate minutes of bout-based PA within a variety of common PA location types for adults, which is an important aspect of study protocol for future studies examining the locational context of PA and how built environment characteristics of those locations influence PA.
Locational Context of Physical Activity
to self-report (4, 15). For example, Tucker et al. found that 62% vs. 10% of adults met current PA recommendations according to self-report and accelerometry, respectively, using 2005-2006 NHANES data (4). Despite the initial enthusiasm over accelerometers, recent commentaries have suggested that neither self-report nor accelerometers are able to perfectly measure PA. Rather, each has its own set of advantages and disadvantages that must be considered when choosing whether to use self-report, accelerometry, or a combination (13).
Despite the recommendation to survey locational context of PA, few studies have examined the places in which individuals are physically active, particularly the places in which adults are active. Instead, researchers have relied on traditional, context-free methods that simply focus on time spent being physically active. The current body of literature is therefore missing important information that could be used to inform understanding of PA-built
environment relationships and intervention development. The first aim of this research
developed a protocol for classifying locations of PA from GPS data and then used this method to describe the locations of bouts of PA of adults in a five-site study. The work relies on previously collected concurrent accelerometer and GPS data. This method involved use of Google Fusion and Maps (Google Inc., Mountain View, CA), tools freely available to researchers across disciplines and geographic locations, allowing for creation and use of consistent methodology currently lacking in the field.
A small and complex literature currently describes the locations in which adults
participate in PA (Table 1) (21-43). Studies of adults have largely been completed in the United States (US) and Australia. Of studies occurring in the US, most are single city or community studies or small regional studies and only two are nationally generalizable. As such, sample sizes vary dramatically, from small qualitative studies (n=29) to large national surveys (n=8844). Published studies were conducted from 1995-2013 and generally included participants from all age groups and both genders.
planning. One was completed during 1999-2000 (22), potentially limiting usefulness of the data in the present day, and the other collapsed almost 40% of PA bouts into an “other” category, suggesting the need to further refine this category (29, 30). Despite these concerns, Dunton et al. do present results for percent of PA bouts by sociodemographic, seasonal, and temporal (day of week, time of day) categories, a strength as compared to the rest of the literature (29). For
example, they report that men were more likely to exercise outdoors and at work whereas women were more likely to exercise at home (29). Also, outdoor and home based exercise was more frequent at older ages whereas exercise at work and gyms was more common at younger ages (29). Individuals with higher education were more likely to exercise at gyms than were those with lower education (29). Expected seasonal patterns were observed, with more US adults reporting outdoor bouts during the spring and summer and home bouts during the winter (29). They also report results by duration and intensity of PA (30). Vigorous bouts were most likely to occur at a gym or at home and moderate bouts were longest when occurring outdoors (30).
results are reported varies by study, further complicating comparisons across some studies. For example, a large number of studies simply report the percent of respondents who indicated that they use a particular facility (yes/no) whereas others report the percent of MVPA time spent in a particular facility.
Reviewing studies investigating the locations in which all adults are physically active indicates that a wide variety of methods have been used to examine this question. The studies use different definitions of PA, assess PA in different ways, have different conceptual focuses for PA locations (general versus specific), and assess use of these locations in different ways (Table 1). Some studies have used self-reported recall to assess both PA and location, others have used only device-based measures (accelerometers and GPS), and others have combined self-report and devices (Table 1). In general, device or combined device and self-report based measures have been more common in studies of children whereas self-report methods have been more prevalent with adults. Studies that report very specific types of locations have generally used self-report to identify locations whereas those focusing on general locations (home, neighborhood) more commonly used GPS to identify locations. Two notable exceptions are studies completed on children in England, where researchers were able to link GPS data with detailed geographic information system (GIS) data to identify specific types of locations (44, 45). Unfortunately, this level of detailed GIS data is not often available in other locations.
sociodemographic categories to allow comparison across different groups. An important
departure from the work by Dunton et al. would be refining location categories to prevent a large “other” category. The proposed Google Fusion and Maps (Google Inc., Mountain View,
California) protocol (Appendix 1) combined with the available data for the SOPARC GPS sub-study, concurrent accelerometer and GPS data from 5 geographically distinct US cities, therefore helps to fill this gap.
Measuring Built Environment Attributes that Influence Physical Activity: Residential Buffers and the Concept of Activity Space.
The second issue addressed by this research concerns the way in which attributes of PA environments are measured. Built environment exposures are typically assigned using the participant’s residential address, either by using an administrative boundary (e.g. zip code, census tract) or by creating a buffer around the residential address (e.g. a circular distance-based buffer or a road network distance-based buffer) (19, 20, 31, 46-62). Indeed, a systematic review of the literature indicated that 90% of studies on the relationship between contextual
environmental factors and cardiometabolic risk factors focused solely on the residential environment (60). This residential-based exposure assignment method is at odds with the concept of activity space, which represents the overall geographical area in which individuals spend time in their day-to-day lives (63, 64).
residential-based exposure assignment methods has received criticism from both the geography and public health fields, being called, for example, “place-based” instead of “people-based” (61) and the “local” (53) or “residential” (46) “trap”, indicating their failure to measure exposures from the locations in which people actually spend time.
In addition to the aforementioned theoretical criticisms, studies have also demonstrated that choice of neighborhood definition impacts associations between environmental attributes and health and behavior outcomes (19, 57, 66, 67). For example, choice of buffer type (circular vs. road network) substantially influenced results and even overall conclusions for factors associated with walking (19). In a simulation analysis, researchers used both residential neighborhood and individually defined activity spaces to construct environmental exposures (57). They found that neighborhood definitions can systematically and unpredictably bias associations (57). Inagami et al. showed that the effect of a residential neighborhood
disadvantage score on self-rated health was strengthened after accounting for non-residential exposure to disadvantaged areas (59). Jago et al. showed that size of neighborhood buffer [400 meter (m) vs 1 mile (mi)] influenced associations between environmental features and PA among adolescent boys (66).
Other research has shown that associations between residential neighborhood contextual factors and total PA are diluted as compared with associations between residential neighborhood contextual factors and residential neighborhood PA (31, 54, 58, 68). In support of this
difference, work by several authors showed that contextual environmental exposures created from residential neighborhood areas were poorly correlated with the same features derived from GPS defined activity spaces (49, 52) and non-home environments (55).
spend in their residential neighborhoods. This research has demonstrated that individuals spend considerable time outside of their residential neighborhoods (20, 31, 62, 69, 70). For example, ethnographic work completed on 43 Boston families demonstrated that only 6% of destinations were located within the home census tract whereas 20% were located in adjacent tracts and 74% in non-adjacent tracts (62). Research in New York City found that only 35% of GPS trip points were within a 1 kilometer (km) buffer of home (70).
concern over the common practice of assigning built environment exposures based on residential demarcations.
The main criticism of residential-based demarcations from both theory-based work and practical demonstrations is that they fail to align the spatial assessment of environmental attributes with the spatial assessment of health behaviors (10, 46, 54). Yet, few studies have examined the spatial overlap between activity space related to specific health behaviors and neighborhood buffers. Thus, the narrower concept of physical activityspace of individuals is distinct from activity space in that physical activity space is the spatial areas in which individuals complete bouts of PA whereas activity space represents all locations visited by an individual regardless of the specific activities undertaken at those locations. For example, the Villanueva (71) and Hirsch (72) et al. studies described above define activity space based on all destinations reached through active transport or all measured GPS points rather than only using locations at which participants were physically active, making these studies of activity space and not physical activity space.
municipally-defined neighborhood planning district boundaries (33, 34). This small body of literature suggests that a significant proportion of total MVPA time may occur outside of traditionally used residential-based exposure areas. However, the identified studies were few in number and would benefit from the addition of geographic and demographic diversity of
participants to allow examination of potential differences by sociodemographic factors. Further, these studies provide little information on the spatial overlap between the spaces in which PA occurs and residential buffers.
Given the various criticisms of residential buffers, many authors have called for assignment of contextual exposures that better align with the spatial locations in which individuals spend time (10, 16, 18-20, 31, 47, 48, 52-58). Understanding the scale at which locations impact different health behaviors and outcomes is a major challenge in advancing the literature concerning contextual influences on health (10, 47, 53, 56). Many have suggested that GPS enabled devices could be used to more accurately measure these environmental contexts (16, 18, 20, 31, 47, 48, 50, 52, 55, 56, 58, 61, 62, 68).
Despite this consensus, many researchers use one of the residential based exposure assignment methods as studies involving GPS can be costly, time-intensive, and introduce advanced data management and manipulation challenges. Further, many studies reviewed in the previous section have also reported that the home and neighborhood are some of the most common locations for PA among adults (17, 22, 23, 25, 26, 33, 37-43). This contextual information suggests that while residential-based demarcations may be inaccurate for activity space, they have the potential to accurately define PA space. However, the nature of the
complicating understanding of the appropriateness of residential buffers in relation to PA space. In particular, many of the locational context studies do not focus on total PA time spent in different locations. Instead, these studies often report solely on leisure-time PA and report results as the percent of respondents indicating that they are physically active in a given location (Table 1).
The second aim of this research therefore assessed the percent of PA time spent within residential buffers as well as the degree of spatial overlap between the narrower concept of physical activity space of individuals , that is the spatial areas in which individuals complete bouts of PA, measured by GPS over a three-week period, compared to traditional residential-buffers. Results were stratified by major sociodemographic factors (gender, age, race, education) as well as by BMI and state of recruitment as previous studies have not provided this level of detail. These results can help researchers understand the potential impact of choosing the various residential buffers to assign built environment exposures and may indicate which, if any, of these methods accurately represent the PA spaces of adults. Further, these methods could be followed to develop activity spaces specific to other health behaviors, such as the food or tobacco
environment.
Use of Geographic Positioning Systems to Reliably Measure Locations of Physical Activity: How Many Monitoring Days are Needed?
These types of recommendations exist for tools like accelerometers (74), and, in the absence of a GPS recommendation, researchers have often relied on these accelerometer recommendations when determining wear time for GPS (18, 58). Yet, a review of PA studies using GPS devices found that wear time varied drastically, from 40 minutes to 12 days (mean 4 days), and that inclusion of weekdays vs weekend days was inconsistent (18). Therefore, the need for
monitoring length guidelines for GPS use in PA research has been indicated by several authors (16, 18, 58).
Some have suggested that wear time may need to be longer to study locations of PA, particularly in order to capture infrequently used locations (58). The final aim used data from participants who concurrently wore a GPS and an accelerometer for up to three weeks to
18
Table 1 Summary of Studies Examining the Locations in which Adults are Physically Active Location
(sampling) Year N Age Men % Type PA Time Frame PA assessment Question/Device Epoch Location Assessment Question/Device Epoch Results
Giles -C or ti 20 02 Perth, Australia (probability cluster sample; 18-59, employed, no PA in work, no medical PA restriction, lived >1 year in home, English-speaking)
1995-1996 1773 18-29: 26.2% 30-39: 28.4% 40-49: 27.1% 50-59: 17.2%
32 LTPA (vigorous, light to moderate) include transport walking and gardening
Past 2 weeks Survey module modified from “major Australian studies”
n/a Survey module: queried use of list of facilities in prior 2 weeks
n/a % of Respondents, n=1773 45.6% Streets
28.8% Public open space 22.7% Beach
10.8% Gym/exercise center 8.9% River
8.9% Swimming pool 8.7% Sport or rec center 7.1% Tennis court
B ro wn so n 2 00
1 United States (population based,
modified BRFSS sampling scheme, oversampled on low income)
1999-2000 1818 18-29: 27% 30-44: 30% 45-64: 26% 65+: 16%
33 Total MVPA (work, transport walking, leisure)
NR Questionnaire: BRFSS, National Health Interview, and more
n/a Questionnaire n/a % of PA Respondents, n=? 66% Neighborhood Streets 37% Shopping Mall 30% Park
25% Trail 25% Treadmill 21% Indoor Gym
Hu sto n 2 00 3
6 North Carolina counties
(population based sample, non-institutionalized adults)
2000 1796 18-29: 23.3% 30-44: 33.2% 45-64: 28.5% 65+:15.0%
48 2 most common LTPA
Past month BRFSS Exercise Questions
n/a Where do you usually take part in these 2 activities? *Open ended then
categorized
n/a % of PA Respondents, n=1214
41.7% Streets/sidewalks 37.6% Home (indoors or yard)
10.5% Private rec facility 9.6% Workplace rec facility 8.6% Public park 3.8% Other public rec facility
2.8% School facility or grounds
19 Desh pan de 20 05
12 rural towns in Missouri, Tennessee, and Arkansas (random digit dial survey of numbers within 2 mile radius of walking trail; subsample of those with SR diabetes and regular activity)
2003 136 20-39: 9.6% 40-64: 52.2% ≥65: 38.2%
32 Regular PA (≥30 min at least 5 days/ week)
Current Modified BRFSS questionnaire
n/a Questionnaire, in last 30 days on how many days did you use the nearest...? Then categorized into yes/no use
n/a % of PA Respondents, n=136
38.2% Park
25.0% Recreation center 31.6% Trail
15.7% School
23.5% Health club
.
33.8% 0 facilities 47.1% 1 or 2 facilities 19.1% 3 or more (up to 6) facilities R od ríg uez 2 00 6
Chapel Hill, North Carolina (matched neighborhoods)
2003 Non-work
MVPA Usual week BRFSS Exercise Questions
n/a What percent of MVPA time is in each category?
n/a
% of Total Non-Work MVPA Time
Conventional
Single Family 185 Mean: 46.9 63 35.9% Home 26.7% Neighborhood
37.4% Out of neighborhood
New Urbanist
Single Family 142 Mean: 45.0 52 28.0% Home 41.8% Neighborhood
30.2% Out of neighborhood
New Urbanist
Multifamily 66 Mean: 36.7 29 22.3% Home 47.2% Neighborhood
20 Su giy am a 2 00 9 Adelaide, Australia (two-stage; 1- spatially based neighborhood sample, 2-random address within neighborhood)
2003-2004 2194 Mean: 45.5 36 Leisure MVPA Month Past Questionnaire: Number of days n/a Questionnaire: Number of days in each location
% of Total Days 35% Streets near home 13% Streets near work 13% Park
11% Home or yard 8% Outdoor Rec Setting 8% Gym
3% Streets elsewhere 3% Pool
2% Other indoor facility 2% Work 2% School C oh en 2 00 7 Los Angeles, California (two part sample: park users, nearby residents)
2003-2004 Exercise NR Survey n/a Survey n/a
% of Respondents, n=713; 605
Park Users (systematically selected during park visits, active and sedentary users)
713 36 63 3% Health club
“most common” Park
Nearby residents (randomly selected by address within 2 miles of park)
605 39 50 6% Health club
“most common” Park
R od ríg uez 2 00
5 Chapel Hill, North Carolina (convenience through email/fliers)
2004 35 Mean: 31.9 40 10 min MVPA bouts, 30% tolerance
3 days ActiGraph 7164, Swartz cutpoint
1 min Garmin
Foretrex 201 1 min % of Total MVPA Time 29% outdoors in neighborhood 24% outdoors out of neighborhood 0% indoors
21 Du nto n 2 00 8 United States (nationally representative of 44 million non-institutionalized adults who engage in exercise on any given day in 2003-2006)
2003-2006 8844 21-34: 18% 35-44: 29% 45-59: 28% 60+: 24%
53 Sports or
exercise 24-hour recall American time use survey; record every activity over past 24 hours, coded into sports/exercise category
n/a “Where were you while you were
[activity]?” 26 categories, then collapsed to 6
n/a % of Exercise Bouts* 25% Outdoors 25% Home 3% Work 8% Gym 36% Other
3% Unusual location
Tr
op
ed
2
01
0 Massachusetts (regular trail users recruited from trail)
2004-2005 148 Mean: 44 47 MVPA; Cutpoint: 1952
4 days (2 week and 2 weekend)
ActiGraph 7164 1 min GeoStats Wearable GeoLogger (only wore outside)
1-5 sec % of MVPA Time 33.3% 1 km home buffer 18.1% 1 km work buffer (n=80 subsample) Sch ip per ijn 2 01
3 Odense, Denmark (random mail sample of the central city study area)
2005 1305 17-29: 36% 30-39: 21% 40-49: 15% 50-59: 14% 60-69: 9% 70-81: 5%
45 PA/sport/
exercise General Questionnaire: Times per week (categorical)
n/a Questionnaire: Times per week in each location
n/a % Respondents, n=1305 74.3% Outdoors ≥ 1x/week 45.7% Nearest urban green space ≥ 1x/week
Kac zy ns ki 20 09 Waterloo, Ontario, Canada (systematic (nth household) sample of 4 neighborhoods)
2006 384 45.8 37 Total MVPA (>10 min episodes)
1 week PA log booklet (indicate intensity: mild, moderate, strenuous)
n/a PA log booklet (indicate location-open ended, then categorized)
n/a % of Bouts
33% Neighborhood 29% Home/yard 39% Other .. 8% Park 3% Trail
1% Park and trail
.
22 Stan is 2 00 9 Los Angeles, California; Chicago, Illinois; Minneapolis, Minnesota (parks chosen by attributes, adult users systematically approached)
2006 MVPA NR Questionnaire
modeled after BRFSS and International PA
Questionnaire
n/a Questionnaire: where usually do PA from list of options
% of Respondents, n=924; 802
Urban Park 924 Mean: 37.7 46 59% This site
32% Home 23% Different Park 19% Gym 8% Work 6% Neighborhood 4% Other
Remote Park 802 Mean: 40.8 55 15% This site
51% Home 34% Different Park 23% Gym 10% Work 14% Neighborhood 5% Other Du nto n 20 12 Chino, California (convenience sample of parent-child pairs; here report parent/joint results)
2009-2010 219 Mean: 39.6 12 MVPA Cutpoint: 2020 (3 MET) 1 week (non- school hours analyzed) ActiGraph
GT2M 30 sec GlobalSat BT-335 Bluetooth GPS data logger; classified by land use type
30 sec % of MVPA time
Joint P-Only MVPA MVPA
Residential 35 76 Commercial 24 7 Open Space 20 10 Educational 14 4 Public Facility 7 3 Other 1 1
Keg
ler
2
01
3 4 rural Georgia counties (recruited
active participants from a previous study)
2010 29 Mean: 55.9 66 PA or
exercise Typical N/A n/a Semi-structured interview, asked where typically do PA or exercise
Qualitative study “Most common location
home, including yard, followed by neighborhood.
23 Zh u 2 01 3 Austin, Texas (email through community listserv)
2013 148 Mean: 44 33 NR Before/ after move to planned community Possibly modified International PA Questionnaire
n/a Questionnaire n/a % of Respondents, n=148 Before After Nearby street 62 80 Park 34 77 Non-park trail 16 54 Home 16 54 Gym 44 26 Work 18 16 Greenspace 5 15 Other 6 7 Mall 4 3 School 9 2
B
ro
wn
2
01
3 Esk, Mareeba, Mount Isa;
Queensland, Australia (random by age/sex groups)
NR 1219 Mean: 46.7 42 Walking and leisure MVPA
Past Week Questionnaire: Active Australia
n/a Questionnaire n/a % of Respondents, n=1219 49% Home
43% Near Home 26% Work 18% Elsewhere B ull 2 00 0, Mc C or m ac k 20 03 , M illi gan 2 00 7, R os en ber g 2010 Western Australia (stratified random telephone sample) MVPA
Last week, at least 10 minutes
Questionnaire (somewhat similar to NHANES format)
n/a If PA last week, what facilities did you use?
n/a
% of PA Respondents, n=2770; 2761; 2938; 2948
1999 3178 18-29: 21% 30-44: 34% 45-59: 26% 60+: 20%
43 54% Street/footpath
42% Home 7% Cycle/Walk Path 11% Gym/Health/Rec 10% Public Park 10% Beach -- Public Pool -- Work -- Shopping Center 2002 3200 18-29 15%:
30-44: 30% 45-59: 28% 60+: 26%
47 57% Street/footpath
24
2006 3361 18-29: 12% 30-44: 26% 45-59: 32% 60+: 30%
50 48% Street/footpath
50% Home 25% Cycle/Walk Path 20% Gym/Health/Rec 17% Public Park 11% Beach 6% Public Pool 5% Work 1% Shopping Center 2009 3363 18-29: 9%
30-44: 22% 45-59: 32% 60+: 37%
50 33% Street/footpath
55% Home 31% Cycle/Walk Path 20% Gym/Health/Rec 15% Public Park 8% Beach 5% Public Pool 12% Work 7% Shopping Center
Liao
2
01
5 Chino, California 2011 113 23-73 30 MVPA (2020 cutpoint)
4 days EMA/Actigraph
GT2M EMA 54% Home 18% Outdoor, Park 22% Outdoor, Other 10% Other Hu rv itz 2014 King County,
Washington 2008-2009 611 <40: 22% 40-65: 65% >65: 13%
39 MVPA 7 days ActiGraph GT1M GlobalSat
DG-100 80% near (125-1666 m from home) or away (>1666 m) from home, 20% home
25
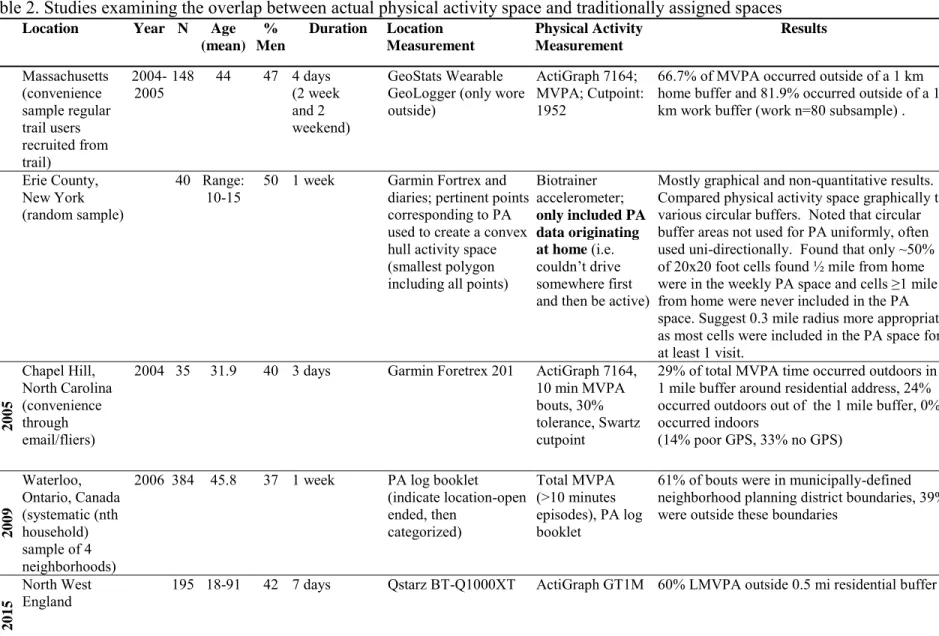
Table 2. Studies examining the overlap between actual physical activity space and traditionally assigned spaces
Location Year N Age (mean)
% Men
Duration Location Measurement Physical Activity Measurement Results T ro ped 2 0 1 0 Massachusetts (convenience sample regular trail users recruited from trail)
2004-2005 148 44 47 4 days (2 week and 2 weekend)
GeoStats Wearable GeoLogger (only wore outside)
ActiGraph 7164; MVPA; Cutpoint: 1952
66.7% of MVPA occurred outside of a 1 km home buffer and 81.9% occurred outside of a 1 km work buffer (work n=80 subsample) .
Yin 2 0 1 3 Erie County, New York (random sample)
40 Range:
10-15 50 1 week Garmin Fortrex and diaries; pertinent points corresponding to PA used to create a convex hull activity space (smallest polygon including all points)
Biotrainer accelerometer;
only included PA data originating at home (i.e.
couldn’t drive somewhere first and then be active)
Mostly graphical and non-quantitative results. Compared physical activity space graphically to various circular buffers. Noted that circular buffer areas not used for PA uniformly, often used uni-directionally. Found that only ~50% of 20x20 foot cells found ½ mile from home were in the weekly PA space and cells ≥1 mile from home were never included in the PA space. Suggest 0.3 mile radius more appropriate as most cells were included in the PA space for at least 1 visit.
Ro dríg uez 2005 Chapel Hill, North Carolina (convenience through email/fliers)
2004 35 31.9 40 3 days Garmin Foretrex 201 ActiGraph 7164, 10 min MVPA bouts, 30% tolerance, Swartz cutpoint
29% of total MVPA time occurred outdoors in a 1 mile buffer around residential address, 24% occurred outdoors out of the 1 mile buffer, 0% occurred indoors
(14% poor GPS, 33% no GPS)
K a cz y ns ki 2009 Waterloo, Ontario, Canada (systematic (nth household) sample of 4 neighborhoods)
2006 384 45.8 37 1 week PA log booklet (indicate location-open ended, then
categorized)
Total MVPA (>10 minutes episodes), PA log booklet
61% of bouts were in municipally-defined neighborhood planning district boundaries, 39% were outside these boundaries
H ills do n 2015 North West
England 195 18-91 42 7 days Qstarz BT-Q1000XT ActiGraph GT1M 60% LMVPA outside 0.5 mi residential buffer
CHAPTER 4: OVERARCHING METHODS Study Population
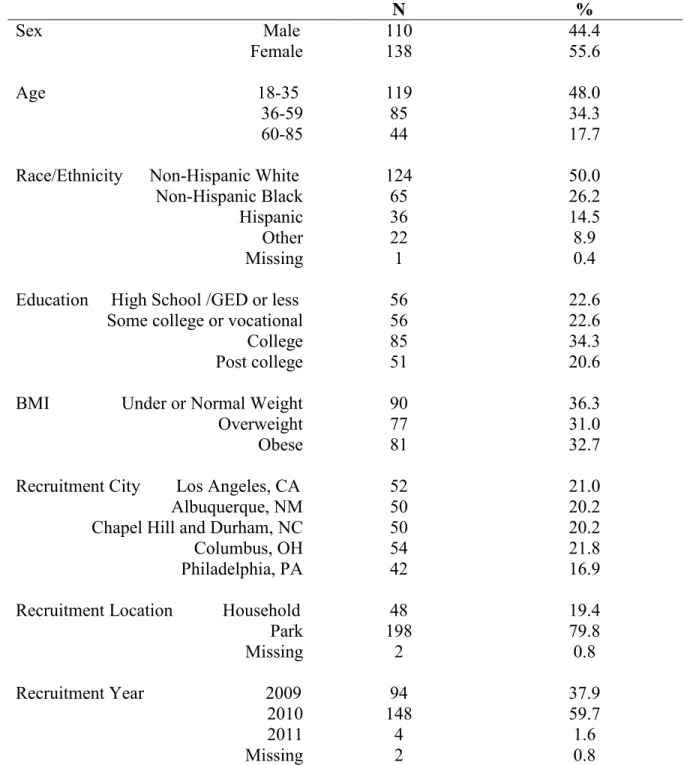
This study used data collected as part of the System for Observing Play and Recreation in Communities (SOPARC) GPS sub-study. The initial data collection involved recruitment of participants from five communities: Los Angeles, California; Albuquerque, New Mexico; Chapel Hill and Durham, North Carolina; Columbus, Ohio; and Philadelphia, Pennsylvania. Participants (n=248) were recruited from within six (seven in the case of Los Angeles) key parks in each of the communities (n=198, 80%) as well as from residences located within one mile of these parks (n=48, 19%) (Table 3). Participants were excluded if they were <18 years old, non-English speaking, or non-ambulatory. Enrollment occurred in the spring, summer, and fall from May 2009 to April 2011, with most participants enrolled in 2009 (n=94) and 2010 (n=148) and only 4 enrolled in 2011 (Table 3).
Participants were asked to concurrently wear an accelerometer to measure PA and a GPS to measure location for three consecutive 1-week periods. Details of the accelerometer and GPS are discussed in detail below. In addition, study staff used a Tanita Bc551 scale and a Seca Portable Stadiometer to measure weight and height of participants at enrollment. Participants were compensated $200-225 after participation. Further participant recruitment and study details are available elsewhere (75-77). Study protocols were approved by appropriate study site
Hispanic, 9% Other) as were individuals from varied educational backgrounds (23% ≤high school education, 23% some college, 34% college degree, 21% post-secondary). BMI was evenly distributed, with 36% under or normal weight, 31% overweight, and 33% obese [mean BMI (SD) 28.3 (7.0)]. Although SOPARC purposefully attempted to recruit individuals from varied backgrounds, there were some differences by study site. For example, most African Americans were recruited in Ohio and Pennsylvania (71%) and most Hispanics from New Mexico and California (78%). Additionally, a large proportion of the individuals with post-graduate education were recruited from the North Carolina site (41%) and 67% of those with a high school education or less were recruited from Pennsylvania and Ohio.
Outcome Assessment
Participants wore an ActiGraph (model GT1M; ActiGraph LLC, Pensacola, FL)
accelerometer on the right hip for three consecutive 1-week periods (75). The ActiGraph GT1M, a capacitive accelerometer, was used to measure acceleration in the vertical plane by recording measurable changes in voltage that were proportional to the initial acceleration (78).
The ActiGraph GT1M has been found to have acceptable reliability as evidenced by low (<5%) coefficient of variations in tests both across and within units (79). In a controlled lab setting, Silva et al. tested intra- and inter-instrument reliability of 50 ActiGraph GT1M units with a mechanical shaker (79). They observed good reliability for measuring counts (CVintra=2.9% and CVinter=3.5%) and steps (CVintra=1.1% and CVinter=1.2%) under a 15-second epoch (79). Importantly, they did not observe batch effects or evidence of systematic trends in variation with increasing intensity of acceleration (79). Despite the good reliability of the GT1M, the authors noted that variation was increased at low levels of acceleration and suggest that this poses
time (79).
based on walking/running and lifestyle activity protocols (81). A recent study examined the validity of these cut-points for the ActiGraph GT1M as compared to indirect calorimetry in a free-living environment (84). The study found that the NHANES cut-point significantly underestimated minutes of MVPA during the six hour period (n=23.8 minutes) while the Matthews’ cut-point overestimated minutes of MVPA (n=13.6 min, p>0.05) (84). The authors concluded that neither set of cut-points was better than the other overall (84). Therefore, this research uses both sets of cut-points to examine the impact of cut-point choice.
PA that occurs in bouts of ten minutes or more was considered in all stages of this research. Considering bouts allows this work to be comparable with the 2008 Physical Activity Guidelines for Americans (3) and the World Health Organization recommendations (85), which specify that PA should be of at least 10 minutes in duration to count towards meeting the weekly goal. There is evidence that short bouts of PA are effective in improving cardiovascular health, however the specific ten minute cut-point used in the guidelines is an arbitrary choice.
Additionally, considering PA in bouts aided in coding locations of PA, as described below, and additionally decreased the size of the dataset to one that is manageable for manual coding. Exposure Assessment
Geographic location of participants was tracked using a Qstarz BT-Q1000X portable GPS unit (weight, 65 g; dimensions, 72 x 46 x 20 mm) with Wide Area Augmentation System (WAAS) enabled to improve accuracy (75, 77). Participants were asked to wear GPS units concurrently with the ActiGraph GT1M accelerometers for three consecutive one-week periods.
in the top two for all tests of accuracy in terms of mean distance from either a known point or a highly accurate concurrently used GPS as described below (86). Specifically, it had the highest overall accuracy in static validity tests as compared to a geodetic point [mean (sd) distance from point: 2.1 m (0.8)] (86). The authors indicate that half of the measured points had an error <2 m from the geodetic point and none were greater than 4 m from it (86). The Qstarz was the second most accurate GPS in tests of dynamic validity when comparing measured points to those obtained from a highly (<30 cm) accurate Trimble GeoXH GPS in open space and moderate density scenarios [mean difference (sd): 5.2 m (3.8), 8.2 m (19.5), respectively] (86). In the dynamic, high density urban scenario, the Qstarz was the most accurate GPS [mean difference (sd): 20.0 m (13.8) (86).
(87). Although the Qstarz unit was superior to other models overall, all of the GPS units tested were inaccurate in the high-rise setting (mean error=59.2 m) (87). Despite this, the Qstarz unit was notably more accurate than other models in the obstructed canopy setting (50% of points <5 m from known point) (87), potentially indicating its superiority over other models in an urban setting.
Data Cleaning, Reduction, and Handling of Missing Data
For previous analyses, raw GPS and accelerometer data were transferred to SAS and GPS points with less than 1-minute epochs were removed. Overlapping data occurring due to
participants exchanging monitors between weeks were removed (75). Accelerometer non-wear time was identified as 90 minutes of consecutive zero counts, allowing for up to two minutes of nonzero counts if the 30 minutes before and after the nonzero counts contain no positive counts, and counts for these minutes were set to missing (75, 88). Data from days exceeding the
standard 21-day monitoring period were be removed. In order to account for missing
above. Missing GPS points were imputed if possible following the procedures outlined in the coding protocol. This procedure involved examining the recorded point(s) before and after the missing point(s) within a bout to impute the location of the missing point, as has been done in other studies of PA involving GPS (16).
There were 5,255 total monitoring days, of which 4,353 (82.8%), 4,176 (79.5%), 3,940 (75.0%), 3,679 (70.0%), and 2,919 (55.5%) met the requirements for compliant wear days of 7, 8, 9, 10, or 12 hours respectively. Given the large drop between 10 and 12 hours and the
prevalence of 10-hour wear days in the literature (89), the 10-hour cut point was used in the main analyses. Of the 248 enrolled participants, 238 provided data during three weeks of concurrent accelerometer and GPS monitoring, four provided data during two weeks, and six during one week (75). Table 4 displays the number of participants with differing lengths of monitoring after applying the compliant wear day definition. All of these combinations provided adequate sample size for Specific Aim III (Figure 1). Therefore, participants with compliant wear days were first used to complete Specific Aim III (determining the number of days needed to adequately capture usual locations of activity). Sensitivity to choice of compliant wear day definitions was
examined. Those participants fulfilling the requirement determined by Specific Aim III were then used in a sensitivity analysis to complete Specific Aim I.
Power
size calculations in future studies.
Table 3. Sociodemographic Characteristics of 248 Participants Enrolled in the SOPARC GPS Sub-Study 2009-2011.
N %
Sex Male 110 44.4
Female 138 55.6
Age 18-35 119 48.0
36-59 85 34.3
60-85 44 17.7
Race/Ethnicity Non-Hispanic White 124 50.0
Non-Hispanic Black 65 26.2
Hispanic 36 14.5
Other 22 8.9
Missing 1 0.4
Education High School /GED or less 56 22.6
Some college or vocational 56 22.6
College 85 34.3
Post college 51 20.6
BMI Under or Normal Weight 90 36.3
Overweight 77 31.0
Obese 81 32.7
Recruitment City Los Angeles, CA 52 21.0
Albuquerque, NM 50 20.2
Chapel Hill and Durham, NC 50 20.2
Columbus, OH 54 21.8
Philadelphia, PA 42 16.9
Recruitment Location Household 48 19.4
Park 198 79.8
Missing 2 0.8
Recruitment Year 2009 94 37.9
2010 148 59.7
2011 4 1.6
Missing 2 0.8
Table 4. Number of Participants with Various Combinations of Compliant Wear Day Definitions and Required Numbers of Compliant Days of the 248 Participants Enrolled in the SOPARC GPS Study 2009-2011
At least 7 12-hour compliant days
At least 7 10-hour compliant days
At least 10 10-hour compliant days
At least 14 10-hour compliant days
At least 14 9-hour compliant days
California 41 46 43 36 40
North Carolina 47 49 49 46 49
New Mexico 40 45 43 33 39
Ohio 28 37 33 22 26
Pennsylvania 32 37 32 25 28
Figure 1. Sample Size Needed to Produce an ICC with ±0.1 Precision vs. Number of Monitoring Days 0 50 100 150 200 250 300 350 400 450
0 1 2 3 4 5 6 7 8 9 10 11 12 13 14 15 16 17 18 19 20 21
Ne ed ed S am p
le Si
ze Monitoring Days 0 0.05 0.1 0.15 0.2 0.25 0.3 0.35 0.4 0.45 0.5 0.55 0.6 0.65 0.7 0.75 0.8 0.85 0.9 0.95 Linear (N) ICC
Available N with 3wk monitoring
CHAPTER 5: WHERE ARE ADULTS ACTIVE? AN EXAMINATION OF PHYSICAL ACTIVITY LOCATIONS USING GPS IN FIVE UNITED STATES CITIES Introduction
According to the World Health Organization (WHO), lack of physical activity (PA) is the fourth leading risk factor for mortality globally and accounts for significant disease burden (1). Despite the numerous benefits of PA, many individuals do not meet PA guidelines (3, 85). Over one-third of the world’s population is insufficiently physically active, with proportions varying substantially between countries (90).
Given these trends, identifying factors that increase PA has become an important research focus. Researchers advocate use of theoretical frameworks when studying PA behaviors and developing health promotion programs (6, 7). These frameworks propose that a variety of factors, including individual, environmental, social, cultural, and policy, influence behavior (6, 7). Therefore, understanding the types of locations typically used for PA by some populations and potentially under-used by others may be important for developing targeted interventions to increase PA in underactive populations. Traditional methods of PA measurement fail to describe the context in which PA occurs (10, 11, 16), leading many to suggest Global Positioning System (GPS) technology as an important means of understanding PA locational contexts (16, 18).
and they either are dated (22) or only classified 60% of PA into specific locations, leaving the other 40% aggregated into an “other” category (29). In addition, several key methodologic issues are apparent in the literature, including a focus on leisure time PA as opposed to total PA (21, 23, 25-27, 29, 32, 37, 39) and use of self-report PA questionnaires instead of objective measures (21-27, 29, 32, 34, 35, 37-43), with many studies soliciting a binary yes/no response in regards to use of a particular location type for PA instead of percent of PA time completed at the location (21-24, 26, 27, 32, 35, 38-43). Studies that have used a GPS to aid in location
assessment have typically lacked specificity in regards to location types, for example by simply reporting inside/outside the home neighborhood (28, 31).
In general, GPS or combined GPS and self-report measures have been more commonly used to assess PA locations in studies of children whereas self-report methods alone have been more prevalent with adults. For adults, studies that report specific types of locations have
generally used self-report methods whereas those focusing on general locations (inside vs outside home neighborhood) have more commonly used GPS to identify locations.
Therefore, a device-based study of specific PA locations of US adults from an expanded geographic scope is notably missing from the literature. This type of study would allow for examination of the locational context of total PA time as well as refinement of location
Methods
Study Population
The System for Observing Play and Recreation in Communities (SOPARC) GPS sub-study recruited participants from five communities: Los Angeles, California; Albuquerque, New Mexico; Chapel Hill and Durham, North Carolina; Columbus, Ohio; and Philadelphia,
Pennsylvania. Recruitment occurred within six (seven for Los Angeles) key parks in each of the communities (n=198, 80%) as well as from residences located within one mile of these parks (n=48, 19%) (Table 5). Participants were ineligible if they were <18 years old, non-English speaking, or non-ambulatory. Participants were enrolled in the spring, summer, and fall from May 2009 to April 2011, with most enrolled in 2009 (n=94) and 2010 (n=148) and only 4 enrolled in 2011.
SOPARC conducted sampling so as to recruit individuals of diverse sociodemographic characteristics (e.g. within the specific age and sex categories in Table 5). These characteristics (age, sex, race/ethnicity, and highest level of education achieved) were collected through a questionnaire. Study staff used a Tanita Bc551 scale and a Seca Portable Stadiometer to measure weight and height of participants at enrollment, respectively, allowing computation of body mass index (BMI in kg/m2). Further participant recruitment and study details are available elsewhere (75-77).
Physical Activity Assessment
recorded activity in 1-minute epochs and has been shown to have high validity (80).
Accelerometer non-wear time was identified as 90 minutes of consecutive zero counts, allowing for up to two minutes of nonzero counts if the 30 minutes before and after the nonzero counts contained no positive counts, and records for these minutes were flagged as non-wear (88). The GPS data were then merged with the accelerometer data, including the accelerometer minutes flagged as non-wear, by timestamp.
PA bouts were defined as ten or more minutes of accelerometer counts occurring above a given cut-point, allowing for 20% of the minutes to fall below the cut-point. In addition, a bout had to begin and end with a physically active minute and could not contain more than four consecutive minutes below the cut-point. We only examined PA in bouts of at least ten minutes as recommended by the 2008 Physical Activity Guidelines for Americans and the WHO (3, 85). The accelerometer count cut-point used can influence results (81-83), therefore sensitivity
analyses were conducted using common cut-points. The chosen cut-points were the Matthews’ point (moderate to vigorous PA (MVPA): ≥760 counts/min) (81) and the NHANES cut-points (MVPA: ≥2020 counts/min; vigorous PA (VPA): ≥5999 counts/min) (15). Although the Matthews’ MVPA cut-point is notably lower than the NHANES MVPA and VPA cut-points, the two methods have comparable validity (84). The main analysis considered wearing the
Location Assessment
Participants wore a Qstarz BT-Q1000X portable GPS unit (weight, 65 grams;
dimensions, 72 x 46 x 20 millimeter) to record geographic locations. The GPS units had Wide Area Augmentation System (WAAS) enabled to improve accuracy and points with less than a 1-minute epoch were removed (75, 77). The Qstarz BT-Q1000X consistently scored well for accuracy in comparison with four other popular GPS units, having superior static and dynamic validity in a variety of settings, including high density urban settings (86). Using a GPS with high performance in terms of validity was important for coding the latitude and longitude points into PA location types.
A protocol capable of classifying GPS points into PA location types in diverse settings was first developed (APPENDIX 1). The protocol was piloted on a small subset of data by multiple coders to qualitatively examine reliability and improve clarity. Protocol changes
included the addition of location categories to be coded, clarification of the process of examining all of the points in a PA bout when making coding decisions, and clarification of rules for
identifying points involved in motorized travel. The final protocol was implemented by a single author (KMH). Google Fusion Tables (Google Inc., Mountain View, CA) was used to map PA bouts within 35 miles of the participant’s home address, resulting in a study area of
approximately 19,000 mi2 distributed across the five cities.
dense commercial districts, restaurants, and gas stations), schools (including pre-K to university), fitness locations (e.g. pay gyms and miscellaneous fitness areas (e.g. private tennis/soccer
facilities, swim clubs, dance/martial arts studios)), footpaths/trails, and residential locations (excluding the participant’s home). The remaining location types were collapsed into an “other” category due to low frequency; however these locations were coded as: services (banks, hotels, post offices, healthcare facilities, libraries), offices, golf courses, factories, churches, and entertainment (non-fitness oriented; e.g. museums, zoos). Points located in dense downtown areas that were too difficult to classify were coded as “downtown” and grouped with “other.” The protocol instructed coders to consider of the overall pattern of points within a PA bout when making coding decisions, but did not require all points within the same PA bout to receive the same code. For example, if a participant walked to a park and then was active in the park, he or she could have minutes classified as road and park within the same bout. The protocol also described how to use the historical street view option to locate Google imagery recorded nearest in time to when the PA bout occurred. The protocol directed coders to use GPS speed and GPS points to identify and reclassify motorized travel as inactive minutes when necessary. Participant home addresses (all sites) and work addresses (subset of Pennsylvania participants) were
Statistical Analysis
In order to compare location use across sociodemographic groups known to participate in widely different amounts of PA (e.g. older adults vs younger adults), the percent of PA bout time spent in each location type was calculated overall and by sociodemographic and recruitment characteristics for all three levels of PA intensity (Matthews’ and NHANES MVPA, NHANES VPA). Sociodemographic characteristics examined include gender, age category, race/ethnic category, level of education, and BMI. Recruitment characteristics examined include
recruitment state and recruitment site (park versus household). Differences by sociodemographic and recruitment characteristics were examined using Cochran-Mantel-Haenzel tests for general association. Results are focused on three location types (homes, roads, and parks) that may be most appropriate for intervention targeting.
Results
A total of 248 individuals were enrolled in the study, of whom 13 were excluded due to missing data (two contributed no accelerometer data and eleven had all missing data for GPS points) leaving 235 participants. Of these 235 participants, 224 had at least four ten-hour days of compliant accelerometer wear and 223, 192, and 47 completed bouts of Matthews’ MVPA, NHANES MVPA, or NHANES VPA, respectively, on days with at least ten hours/day of wear (Table 5).
Participant Sociodemographic Characteristics
other race/ethnic groups, 22% with high school education/GED or less, and 22% some college or vocational school for those with Matthews’ MVPA bouts; Table 5). Participants were evenly distributed among categories of BMI for those with Matthews’ MPVA bouts. Patterns of sociodemographic characteristics were similar across enrolled participants and those with Matthews’ and NHANES MVPA; however those with NHANES VPA bouts were more educated (p=0.01), had a lower BMI category (p=0.05), and were more likely to be recruited from North Carolina (p=0.02) as compared with those having Matthews’ MVPA bouts (Table 5). Time Spent in Physical Activity Intensities
The amount of time participants were physically active in bouts varied greatly by PA intensity (Table 6). Overall, 223 participants (99.6% of those with compliant wear) contributed 145,229 minutes in Matthews’ MVPA bouts, 192 (85.7% of those with compliant wear)
contributed 46,499 minutes in NHANES MVPA bouts, and 47 (21.0% of those with compliant wear) contributed 5,293 minutes in NHANES VPA bouts on days with at least 10 hours of accelerometer wear over the three weeks of monitoring (Table 6). Matthews’ MVPA bouts ranged from 10 to 197 minutes with a median duration of 16 minutes, NHANES MVPA bouts ranged from 10 to 147 minutes with a median duration of 20 minutes, and VPA bouts ranged from 10 to 112 minutes with a median duration of 26 minutes.
Physical Activity Locations