AUTOMATIC DIFFICULTY DETECTION
Jason Carter
A dissertation submitted to the faculty at the University of North Carolina at Chapel Hill in partial fulfillment of the requirements for the degree of Doctor of Philosophy in the Department
of Computer Science.
Chapel Hill 2014
© 2014 Jason Carter
ABSTRACT
Jason Carter: Automatic Difficulty Detection (Under the direction of Prasun Dewan)
Previous work has suggested that the productivity of developers increases when they help each other and as distance increases, help is offered less. One way to make the amount of help independent of distance is to develop a system that automatically determines and communicates developers’ difficulty. It is our thesis that automatic difficulty detection is possible and useful.
To provide evidence to support this thesis, we developed six novel components: programming-activity difficulty-detection
multimodal difficulty-detection
integrated workspace-difficulty awareness difficulty-level detection
barrier detection
reusable difficulty-detection framework
Programming-activity difficulty-detection mines developers’ interactions. It is based on the insight that when developers are having difficulty their edit ratio decreases while other ratios such as the debug and navigation ratios increase. This component has a low false positive rate but a high false negative rate.
Integrated workspace-difficulty awareness combines continuous knowledge of remote users’ workspace with continuous knowledge of when developers are having difficulty. Two variations of this component are possible based on whether potential helpers can replay developers’ screen recordings. One limitation of this component is that sometimes, potential helpers spend a large amount of time trying to determine if they can offer help.
Difficulty-level and barrier detection address this limitation. The former is based on the insight that when developers are having surmountable difficulties they tend to perform a cycle of editing and debugging their code; and when they are having insurmountable difficulties they tend to spend a large amount of time a) between actions and b) outside of the programming
environment. Barrier detection infers two kinds of difficulties: incorrect output and design. This component is based the insight that when developers have incorrect output, their debug ratios increase; and when they have difficulty designing algorithms, they spend a large amount of time outside of the programming environment.
TABLE OF CONTENTS
LIST OF TABLES ... x
LIST OF FIGURES ... xiii
Chapter 1. Introduction ... 1
1.2 Baseline Approaches ... 6
1.3 Evaluation Metrics ... 7
1.4 Thesis ... 7
1.5 Definition of Having Difficulty ... 9
1.6 Summary ... 10
Chapter 2. Comparison with Related Work ... 11
2.1 Overview ... 11
2.2 Motivation for Encouraging Programmers to Help Each Other ... 11
2.3 Techniques to Reduce the Need for Help ... 16
2.4 Techniques to Promote Actively Asking Help ... 18
2.5 Techniques to Promote Passively Noticing the Need for Help ... 19
2.6 Automatic Detection of Difficulty ... 21
2.6.1 Mining Interactions with Non-Standard Equipment ... 22
2.6.3 Mining Interactions with Programming Environments ... 24
2.6.4 Computing Time Spent Using Programming Environment Events ... 27
2.6.5 Automatically Determining Compiler Error Difficulties ... 34
2.6.5 Difficulties with Logic Errors ... 36
2.6.6 Using Breakpoint Debuggers to Overcome Logic Errors ... 36
2.6.7 Intelligent Tutoring Systems ... 37
2.6.8 Mining Code Changes ... 38
2.7 Notification of Status ... 41
2.8 Context Awareness ... 43
2.9 Programming Context ... 44
2.10 Multi-level Classification of Developers’ Status ... 45
2.11 Summary ... 46
Chapter 3: Programming Activity Difficulty Detection and Implementation ... 47
3.1 Introduction ... 47
3.2 Issues, Approach, and Evaluation ... 48
3.3 Deriving Mining Algorithm ... 51
3.4 Mining Algorithm Results ... 54
3.4.1 Comparison of Mining Algorithm Results to Baselines ... 57
3.4.2 Discussion ... 61
3.6 Reusable Difficulty Detection Framework ... 65
3.7 User and Coding Study ... 69
3.8 User and Coding Study Results ... 72
3.9 Predicting Observer Status ... 78
3.9.1 Comparison of Group Model Results to Baselines ... 83
3.10 Privacy ... 88
3.11 Limitations ... 90
3.12 Summary ... 91
Chapter 4: Multimodal Difficulty Detection... 94
4.1 Introduction ... 94
4.2 User Study ... 95
4.3 Programming Activity Results ... 97
4.4 Tracking Body Posture ... 100
4.4.1 Creative® Interactive Gesture Camera ... 100
4.4.2 Microsoft Kinect Camera ... 105
4.5 Combining Body Posture and Programming Activity Tracking... 110
4.6 Limitations ... 111
4.7 Summary ... 112
Chapter 5. Help Promotion ... 113
5.2 Context Awareness ... 114
5.2.1 Semi-Structured interviews ... 116
5.2.2 User Study ... 116
5.2.3 Metrics and Study Results ... 119
5.3 Classroom Field Study ... 122
5.3.1 Field Studies in Education ... 122
5.3.2 Help vs. Grade ... 123
5.3.3 Screen vs. Model Sharing ... 125
5.3.4 Distributed Tool Use ... 126
5.4 Summary ... 129
Chapter 6. Difficulty Level and Barrier Detection ... 131
6.1 Barrier Detection ... 132
6.2 Difficulty Level Detection ... 140
6.3 Limitations ... 154
6.4 Summary ... 154
Chapter 7. Conclusions and Future Work ... 156
APPENDIX A: LAB STUDY TASKS (CHAPTER 3) ... 163
APPENDIX B: FIELD STUDY TASK (CHAPTER 5) ... 170
APPENDIX C: PARTICIPANT DIFFICULTIES ... 176
LIST OF TABLES
Table 2.1: Comparative statistics on productivity measures taken from [55]. ... 15
Table 2.2: Example of attributes and labels. ... 23
Table 2.3: Our example of a programming activity log captured by Eclipse Watcher [41]. ... 28
Table 2.4: Amount of time editing each line of code [41]. Rows represent a file and columns represent five lines of code. ... 29
Table 2.5a: Student’s programming activity log for session 1. ... 32
Table 2.5b: Student’s programming activity log for session 2. ... 32
Table 2.5c: The sum of the time spent for sessions 1 and 2 on an assignment... 33
Table 2.6a: Average time students spent on all assignments. ... 34
Table 2.6c: The time students spent on an assignment in a previous offering of the course. ... 34
Table 3.1: Programming action categories and their explanations. ... 52
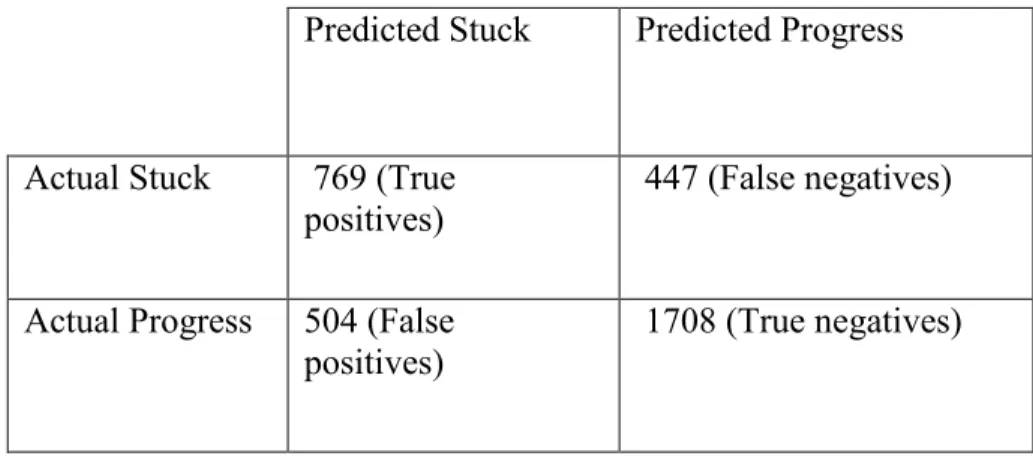
Table 3.2: Confusion matrix for naïve Bayes algorithm with the smote algorithm applied. ... 55
Table 3.3: Confusion matrix for decision tree algorithm with the smote algorithm applied. ... 55
Table 3.4: Confusion matrix for classification via clustering algorithm. ... 56
Table 3.5: Confusion matrix for random baseline. ... 60
Table 3.6: Confusion matrix for modal baseline. ... 60
Table 3.7: Confusion matrix for data distribution baseline. ... 61
Table 3.8: Field Study of Industrial Software Developer. ... 65
Table 3.9: ACM problems from Mid-Atlantic contest. ... 71
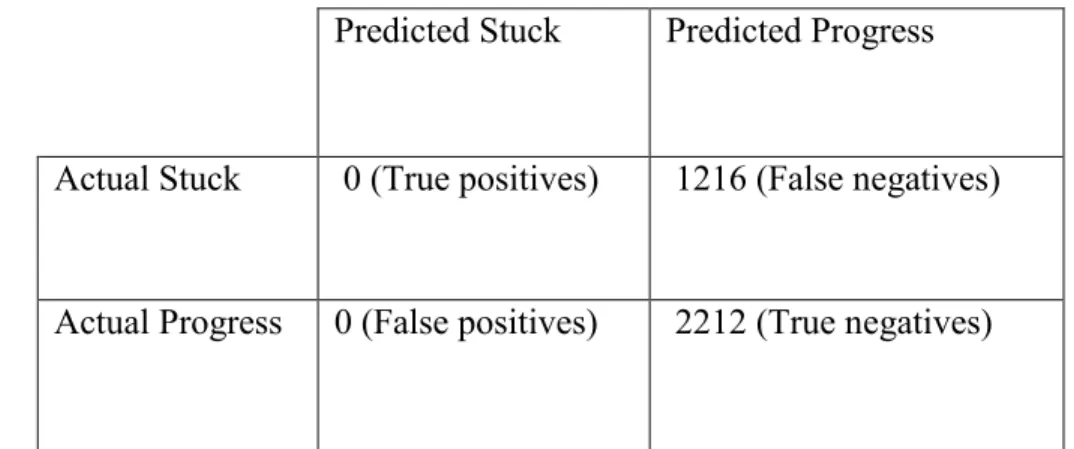
Table 3.11: Confusion matrix for programming environment component
using observers as ground truth. ... 75
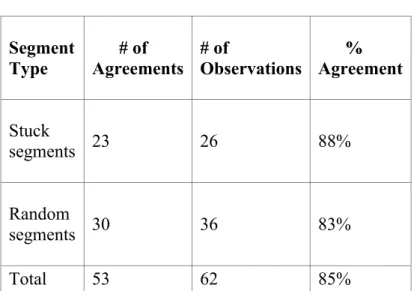
Table 3.12: Coders’ agreement with the tool, me, and participants (stuck segments)... 75
Table 3.13: Confusion matrix for programming environment component using developers as ground truth. ... 76
Table 3.14: Survey Questions and Results (Scale: 1 = Strongly Disagree to 7 = Strongly agree). ... 83
Table 3.15: Confusion matrix for random baseline (observers’ data group model). ... 84
Table 3.16: Confusion matrix for modal baseline (observers’ data group model). ... 85
Table 3.17: Confusion matrix for data distribution baseline (observers’ data group model). ... 85
Table 3.18: Confusion matrix for random baseline (developers’ data group model). ... 86
Table 3.18: Confusion matrix for modal baseline (developers’ data group model). ... 87
Table 3.19: Confusion matrix for data distribution baseline (developers’ data group model). ... 88
Table 4.1: Participants’ tasks. ... 96
Table 4.2: Confusion matrix for initial programming activity algorithm. ... 98
Table 4.3: Confusion matrix for improved programming activity algorithm. ... 100
Table 4.3: Confusion matrix for Creative® Interactive Gesture camera (individual model). ... 104
Table 4.4: Confusion matrix for Creative® Interactive Gesture camera (group model). ... 105
Table 4.5: Confusion matrix for Kinect camera (individual model). ... 109
Table 4.7: Confusion matrix for improved programming activity
algorithm and posture. ... 110
Table 5.1: Survey Questions and Results (Scale: 1 = Strongly Disagree to 7 = Strongly Agree). ... 121
Table 6.1: Barrier Confusion Matrix for Help Sessions. ... 137
Table 6.2: Confusion matrix for random baseline. ... 138
Table 6.3: Confusion matrix for modal baseline. ... 139
Table 6.4: Confusion matrix for data distribution baseline. ... 139
Table 6.5: Programming actions and their explanations (an asterisk denotes new programming actions). ... 142
Table 6.6: Confusion matrix for k-nearest neighbor algorithm when k is 25 and segments are split by save. ... 148
Table 6.7: Confusion matrix for k-nearest neighbor algorithm when k is 29 and segments are split by the length of the longest common subsequence. 151 Table 6.8: Confusion matrix for random baseline (split by save). ... 152
Table 6.9: Confusion matrix for modal baseline (split by save). ... 153
LIST OF FIGURES
Figure 1.1: First step in help-giving model. ... 2
Figure 1.2: Help Independent of Distance. ... 3
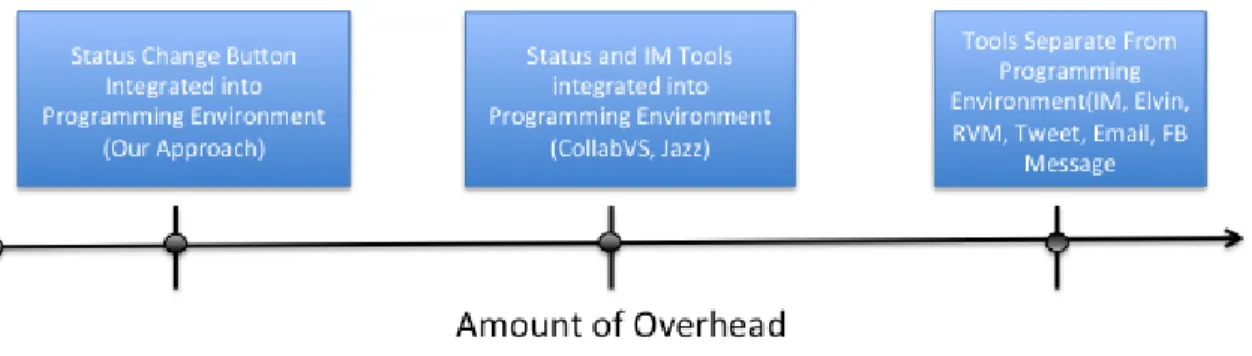
Figure 1.3: Relationship between tools that make asking for help independent of distance and the amount of overhead of each tool. ... 5
Figure 2.1: Comparative statistics on productivity measures taken from [27]. ... 12
Figure 2.2: One of the war-rooms taken from [55]. ... 14
Figure 2.3: The percentage of post-development test cases solo and pair programmers passed on three assignments. ... 16
Figure 2.4: A screenshot of the ticker tape taken from [10]. ... 17
Figure 2.5:A screen shot of the Rear View Mirror Tool taken from [16]. ... 17
Figure 2.6: Hyper plane that separates mouse pressure data into two groups. ... 23
Figure 2.7: Hidden Markov Model of state transitions for a student. “Code” nodes represent a version of a student’s code at a particular time and “State” nodes represent the high-level label the student is in at that same time. N represents the number of states and versions of code for a student. ... 41
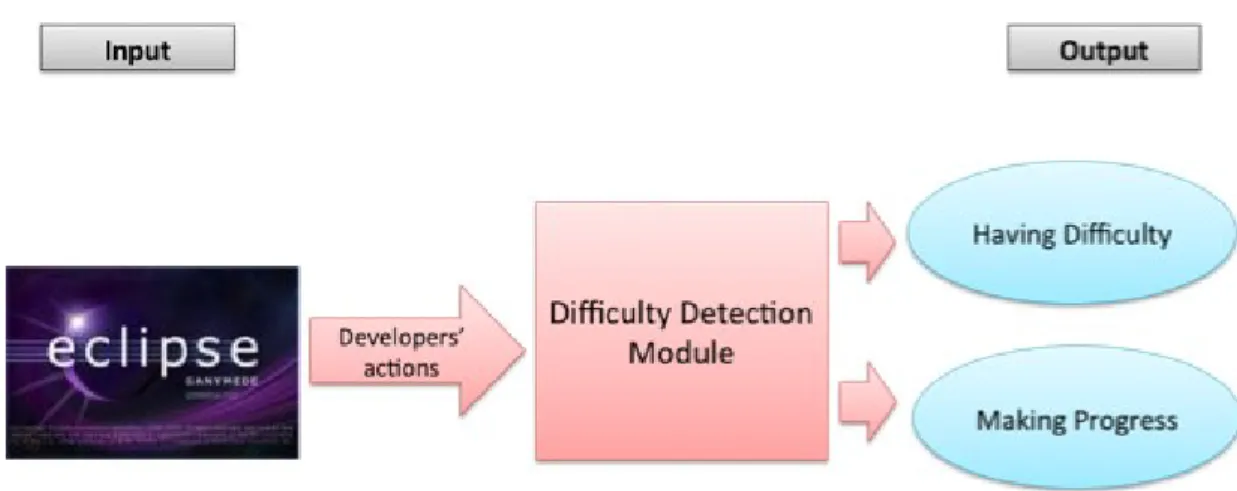
Figure 3.1: Block diagram of our difficulty detection module that takes as input developers’ actions an outputs a prediction as to whether developers are having difficulty or making progress. ... 47
Figure 3.2: Buttons developers press to indicate their status. ... 50
Figure 3.3: Participant 1’s programming activity over an hour. ... 51
Figure 3.4: Participant 2’s programming activity over an hour. ... 53
Figure 3.5: The number of progress and difficulty status events. ... 54
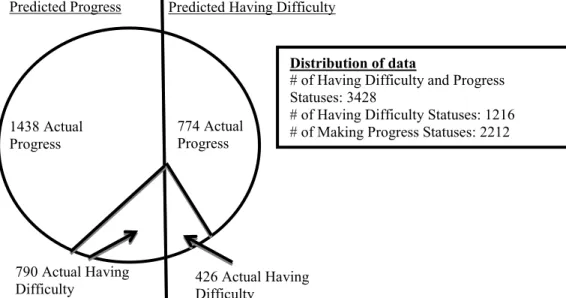
Figure 3.6: The distribution of data for the random baseline (decision tree data). ... 58
Figure 3.8: The distribution of data for the data distribution baseline
(decision tree data). ... 59
Figure 3.9: System Architecture. ... 67
Figure 3.10: Video Coding Tool ... 71
Figure 3.11a: Accuracy of tool (participants 1-6) ... 79
Figure 3.11b. Accuracy of tool (Participants 7-12) ... 81
Figure 3.12: Training user interface that show actual versus report status. ... 89
Figure 4.1: Status correction and indication buttons. ... 97
Figure 4.2: A comparison of participant 1’s edit, insertion, and deletion ratio. ... 99
Figure 4.3: Experimental setup that shows placement of the Creative® Interactive Gesture Camera. ... 101
Figure 4.4: Facial positions measured by the Creative® Interactive Gesture Camera. ... 101
Figure 4.5: Examples of when the camera did not capture facial positions. ... 102
Figure 4.6: Examples of participants’ leaning back, normal, and leaning forward postures (Creative® Interactive Gesture camera). ... 103
Figure 4.7: Experimental setup that shows placement of the Microsoft Kinect camera... 106
Figure 4.8: The 20 joints captured by the Kinect camera. ... 106
Figure 4.9: Differences between joints in standing and seat mode. ... 107
Figure 4.10: Examples of participants’ leaning back, normal, and leaning forward postures (Kinect camera). ... 108
Figure 5.1: “Stuck Point” Video Observation Tool simulating two modes: (a) buffered and (b) simple with (c) answer interface. ... 117
Figure 5.2: Coder Agreement Tool. ... 119
Figure 5.3: Grades vs. amount of help received. ... 124
Figure 5.5: Instructor’s view. ... 127 Figure 6.1: Programming activities when participants are
correcting incorrect output. ... 135 Figure 6.2: Programming activities when participants are having issues
designing algorithms. ... 136 Figure 6.3a: The accuracy of the k nearest neighbor algorithm per
number of neighbors when segments are split by save. ... 145 Figure 6.3b: The true positive rate of the k nearest neighbor algorithm
per number of neighbors when segments are split by save. ... 146 Figure 6.3c: The true negative rate of the k nearest neighbor algorithm
per number of neighbors when segments are split by save. ... 146 Figure 6.3d: The false postive rate of the k nearest neighbor algorithm
per number of neighbors when segments are split by save. ... 147 Figure 6.3e: The false negative of the k nearest neighbor algorithm per
number of neighbors when segments are split by save. ... 147 Figure 6.4a: The accuracy of the k nearest neighbor algorithm per
number of neighbors when segments are split by the length of
the longest common subsequence. ... 149 Figure 6.4b: The true positive rate of the k nearest neighbor algorithm
per number of neighbors when segments are split by the length
of the longest common subsequence... 149 Figure 6.4c: The true negative rate of the k nearest neighbor algorithm
per number of neighbors when segments are split by the length
of the longest common subsequence... 150 Figure 6.4d: The false positive rate of the k nearest neighbor algorithm
per number of neighbors when segments are split by the length of
the longest common subsequence. ... 150 Figure 6.4e: The false negative rate of the k nearest neighbor algorithm
per number of neighbors when segments are split by the length
Chapter 1. Introduction
This thesis is about collaborative software development. In such development,
programmers interact with each other for a variety of reasons such as to get clarification on tasks, divide tasks, and resolve conflicts. A relatively unexplored form of such interaction is
developers helping each other. When developers help each other, they stop their own work to help others. If this is true, helping teammates may decrease team productivity. However, three research results imply that helping teammates could actually improve team productivity.
The first result by Herbsleb et al. [27] found that the productivity of co-located teams, teams that are in the same building but sit in different cubicles, was higher than that of
distributed teams, teams that are in geographically dispersed locations. The reason was that co-located teammates helped more than remote teammates. An earlier study by Herbsleb and Grinter suggests one reason for this phenomenon. They found that distributed developers are less comfortable asking each other for help because they interact with each other less than co-located developers [25]. If this is true, then as people get more opportunities to interact with each other, their productivity should increase.
More concretely, if someone was having difficulty with some aspect of code, another developer in the war-room who is “walking by [and] seeing the activity over their shoulders, would stop to provide help.” However, if developers are not nearby, sometimes they miss opportunities to help.
Conversely, constantly monitoring developers to see if they need help may increase their interactivity to an even greater degree. This is exactly what happens in pair programming where two programmers sit next to each other, with one programmer, called the driver, writing code, and the other programmer, called the navigator, offering help. Williams and Cockburn [9] found that student pair programming teams were more productive than solo programmers. They measured productivity using the following equation:
where task completion time is the amount of time it took to complete assignments and bug fix time is the amount of time it took to fix bugs.
In some cases, asking for help is more efficient than passively noticing the need for help because askers do not have to wait for helpers to notice that they need help and helpers do not have to monitor teammates to determine if they need help. For example, in a classroom with hundreds of students and four teaching assistants, it is much more efficient for students to ask for help than for teaching assistants to notice that students need help. On the other hand, passively noticing the need for help is more efficient if developers delay asking for help. Two recent studies show that sometimes developers do indeed delay asking for help.
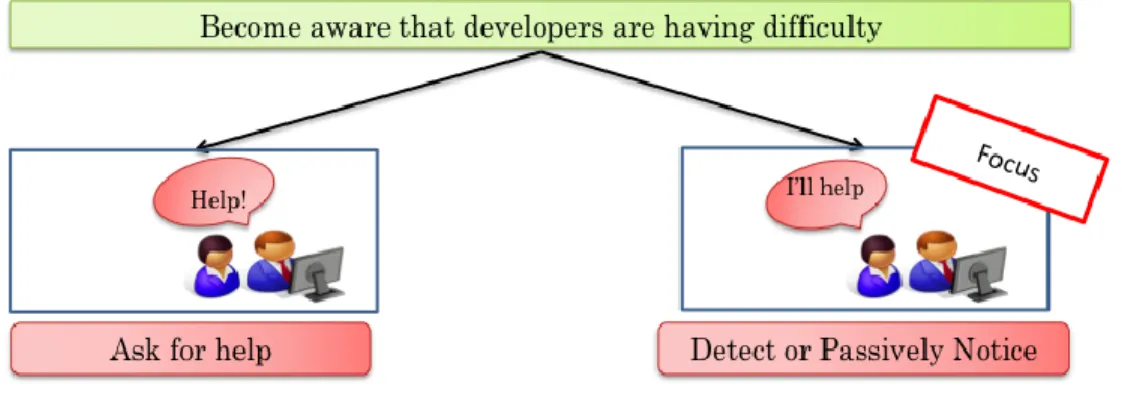
Figure 1.1: First step in help-giving model.
Begel and Simon found that students and new programmers are often late to use help while Latoza et al. found that programmers often exhaust other forms of help such as code or documentation before asking a teammate for help [3,39]. Thus, both requesting help and passively noticing the need for help are important. However, as mentioned earlier, as distance increases a) people are less willing to ask for help and b) fewer passive awareness scenarios are possible. The solution is to make help independent of distance. There are two ways to do so: reduce the need for developers to ask for help, and promote help.
components that do not depend on each other to different locations. The second is to only split the development of only well-understood software components.
Social and technical solutions promote help. Social solutions enable developers and potential helpers to interact with each other without using special help-promotion tools. These solutions are important, because, as mentioned above, distributed developers sometimes delay asking for help. Herbsleb et al. proposed a social solution that addresses this problem [25]. Their solution is to bring distributed teammates who need to communicate together at the beginning of projects. These initial meetings enable distributed teammates to get to know each other.
Technical solutions enable distributed developers and potential helpers to use special
help-promotion tools to interact with each other. There are many technical solutions that promote both actively asking for help and passively noticing the need for help (Figure 1.2).
Figure 1.2: Help Independent of Distance.
One way to promote asking for help is to enable teammates who need help to use Elvin to
Make help independent of distance
Help-need reduction management/Process Project
Modular Software Design
Stable Software Module Distribution
Help promotion
Social Initial Meetings
Technical
Actively Asking for help
Elvin, RVM, Facebook,Email, Twitter, CollabVS, Jazz, Help-Need
Button
Passively noticing the need for help
messages indicate teammates’ need for help. Herbsleb et al. also created a similar tool, Rear View Mirror (RVM), which provides distributed teammates two ways to ask for help [26]. Teammates can a) change a status message that is displayed to collaborators after some period of keyboard and mouse inactivity or use a more direct approach and b) send an instant message to collaborators. The features of these two early research tools, Elvin and Rear View Mirror, can also be found in modern state-of-the-practice tools. For example, programmers can send an email, tweet, instant message, or Facebook messages to potential helpers, or ask a question on a discussion forum.
These tools, including Elvin and Rear View Mirror, require developers who are
interacting with a programming environment to switch to a separate tool to ask for help. A more lightweight approach is to provide the capabilities of the tools within the user interface of the programming environment. Both Jazz and CollabVS use this approach [8,24]. Jazz enables distributed developers to a) change a status message that is displayed to collaborators and b) send an instant message to each other within the Eclipse programming environment [8]. CollabVS enables distributed developers to send an instant message to each other within the Visual Studio programming environment [24].
Figure 1.3: Relationship between tools that make asking for help independent of distance and the amount of overhead of each tool.
Two problems with this approach are a) developers who manually change their status are not likely to set it back, just as people forget to change their busy status in an IM tool and b) this approach alone is arguably not enough work for a thesis, even though it is the most lightweight when compared to other approaches. For all of these reasons, our focus is making passively noticing the need for help independent of distance rather than actively asking for help. Nonetheless, we have implemented a need help button into the Eclipse programming
environment to enable distributed developers to ask for help. As explained later this button has to do less with promoting actively asking for help and more with passive awareness of help-need.
Given a physical coupling, one way to make passively noticing the need for help independent of distance is to virtually simulate a tighter physical coupling such as pair
A more scalable approach is to use video walls, walls that show the activities of remote teammates in one room, which simulate radical location [1]. However, as in radical co-location, teammates may miss opportunities to help each other.
A fundamental problem of both of these approaches is that they go towards “being there.” “Being there” gives collaborators the feeling of being face-to-face. Hollan and Stornetta have argued that if collaboration technology is to be successful, it should go “beyond being there” by providing capabilities not available in face-to-face interaction [28]. In our case, this means creating a mechanism that detects when developers are having difficulty and communicates this to teammates, making teammates aware that developers need help.
1.2 Baseline Approaches
1.3 Evaluation Metrics
In our work, the true positive rate identifies how often difficulty detection modules correctly predicted developers were having difficulty, the true negative rate identifies how often these modules correctly predicted developers were making progress, the false negative rate identifies how often these modules predict developers are making progress when they are actually having difficulty, and false positive rate indicates how often these modules predict developers are having difficulty when they are actually making progress. The following equations specify these metrics more precisely.
The true positive rate (TPR) is:
The true negative rate (TNR) is:
The false negative rate (FNR) is:
The false positive rate (FPR) is:
1.4 Thesis
I. Programming Activity Difficulty Detection Sub-Theses (Sub-thesis I): It is possible to develop an approach that a) uses developers' interactions with their programming environment to determine whether developers are having difficulty with their task and b) performs better than baseline measures.
II. Implementation Sub-Theses (Sub-thesis II): It is possible to develop a common set of
difficulty detection modules for different programming environments that have significantly fewer lines of code than difficulty detection modules written specifically for each programming environment.
III. Multimodal Difficulty Detection Sub-Theses (Sub-thesis III): It is possible to develop an approach that a) combines programming activity and body posture recognition to predict when developers are having difficulty with their tasks and b) has greater accuracy and a lower false negative rate (predicting stuck) than existing approaches that only use programming activities to determine when developers are having difficulty with their tasks.
IV. Context Awareness Sub-Theses (Sub-thesis IV): Replaying the programming actions
of developers who are stuck takes potential helpers longer to decide if they can offer help, but potential helpers prefer replaying programming actions to not having the ability to replaythem.
V. Difficulty Level and Barrier Detection Sub-Theses (Sub-thesis V): It is possible to
programmers are having with their tasks, and c) performs better than baseline measures.
VI. Field Study Sub-theses (Sub-theses VI): It is possible to build a difficulty detection
tool that is successfully used to offer help to students.
1.5 Definition of Having Difficulty
As having difficulty is a human characteristic it is difficult to define and measure. A variety of prior work in detecting human characteristics such as frustration and interruptibility has also faced this problem. Despite this obstacle, prior work has been successful in predicting human characteristics. In particular, Fogarty et al. faced this issue while developing a tool that uses developers’ interactions with the programming environment to determine if they are
interruptible. Their solution was to randomly interrupt users to determine how interruptible they were. We cannot use this approach, as it is likely that no random interruption would find a developer is having difficulty – the results of our studies show that having difficulty is an
exceptional event. Therefore, an alternative approach is to allow participants to report when they are having difficulty. Kapoor et al. use this approach to allow students to indicate their
frustration level.
underestimate their problems [52]. This means that developers may not always admit when they are having difficulty, which is the reason for using observers. In some studies, we only use developers as ground truth, in some, we only use observers as ground truth, and in some, we use both. In field studies, we only use developers as ground truth because there were no screen recordings for observers to view. However, in lab studies, there are screen recordings; therefore, we use both observers and developers. There were some lab studies where we only used
observers. More specifically, in the difficulty level and barrier detection lab studies, we only used observers because developers do not indicate their difficulty level or barrier even though we provided tools that allowed them to indicate this information.
1.6 Summary
Chapter 2. Comparison with Related Work 2.1 Overview
In this chapter, we present previous techniques and motivations to promote help. These motivations and techniques come from a combination of computer science fields: collaborative software engineering, data mining, human-computer interaction, and computer science
education.
The rest of this chapter is organized as follows. Next, we present previous work that provides the motivation for encouraging programmers to help each other. Following this, we discuss techniques to promote help. Then, we present work on making developers aware that their teammates need help. Finally, we end with a summary.
2.2 Motivation for Encouraging Programmers to Help Each Other
A variety of previous work shows that increasing the amount of help in a software development team also increases the productivity of the team.
functionality, bug fixes, or software updates. A modification request has a record of the date of the request, the date a change was made to the code, the requestor. They created two measures using the date of the request and the dates a change was made to the request. The first measure, work interval, was the difference between the date of the first code change and the date of the last code change. This measure was an approximation of how much time it took to
complete the work. The second measure, full interval, was the difference between the date the request was made and the date of the last change. The full interval includes the work interval and the time taken to assign the work and for developers to start the work. The data from the survey was participants’ approximation of the number of times their work was delayed in the last month and the average duration in days of these delays. Participants gave approximations for both participants’ local and remote teammates. Figure 2.1 shows the results from the
modification data.
co-fewer delays when working with distributed teammates, but the length of these delays were on average 1.5 days longer. These results show that co-located teams were more productive than distributed teams. To determine which factors caused delays in productivity, they surveyed members of distributed and co-located teams and found that several breakdowns made it difficult to find co-workers, get timely information about plan changes, have clearly formed plans, agree about plans, be clear about assigned tasks, and have co-workers provide help beyond the call of duty. However, the perception of received help was the only factor that correlated with
productivity. An earlier study by Herbsleb and Grinter suggests one reason developers had this perception. They found that distributed developers are less comfortable asking each other for help because they interact with each other less than co-located developers [25]. If this is true, then as people get more opportunities to interact with each other, their productivity should increase.
Figure 2.2: One of the war-rooms taken from [55].
Table 2.1: Comparative statistics on productivity measures taken from [55].
Radically co-located teams Co-located teams (company
baseline)
Function points per staff
month (Higher is better)
29.49 14.35
Cycle Time (lower is better) 7.64 19.47
This is exactly what happens in pair programming where two programmers sit next to each other, with one programmer, called the driver, writing code, and the other programmer, called the navigator, offering help. Cockburn and Williams conducted a lab study to determine whether student pair programming teams were more productive than solo student programmers [9]. Eighteen students programmed alone while 28 students completed their assignments with a partner. They measured productivity across three assignments using the following equation:
programmers. The study also claims that pair programmers learned different coding strategies from each other and the design of their code improved. Williams and Cockburn report that "pairs often find that seemingly "impossible" problems become easy or even quick, or at least possible, to solve when they work together [9]".
Together, these studies provide some evidence that a) developers’ productivity increases when they help each other and b) as distance increases, help is offered less. These results can be taken as a given of our research. One way to address this problem is to make help independent of distance. There are two ways to do so: reduce the need for help and promote help.
Figure 2.3: The percentage of post-development test cases solo and pair programmers
passed on three assignments. 2.3 Techniques to Reduce the Need for Help
components that do not depend on each other to different geographical locations. The second is to only split the development of only well-understood software components among teams.
Social and technical solutions promote help. Social solutions enable developers and potential helpers to interact with each other without using special help-promotion tools. These solutions are important because, as mentioned above, distributed developers are less comfortable asking for help than co-located developers. Herbsleb et al. proposed a social solution that overcomes this problem [25]. Their solution was to bring distributed teammates who need to communicate together at the beginning of projects. These initial meetings enable distributed teammates to get to know each other, which could make them more comfortable with each other. Technical solutions enable distributed developers and potential helpers to use special
help-promotion tools to interact with each other. There are many technical solutions that promote both actively asking for help and passively noticing the need for help.
Figure 2.4: A screenshot of the ticker tape taken from [10].
2.4 Techniques to Promote Actively Asking Help
One way to promote actively asking for help is to enable teammates to use a ticker tape, implemented in Elvin, to post messages that are continuously shown to collaborators [18].In their work, a ticker tape, shown in Figure 2.4, is a resizable rectangular window that displays colored messages that scroll from right to left. Teammates can use a ticker tape to write messages that indicate a need for help. Herbsleb et al. also created a similar tool shown in Figure 2.5, Rear View Mirror (RVM), which provides distributed teammates two ways to ask for help [26]. Teammates can a) change a status message that is displayed to collaborators after some period of keyboard and mouse inactivity or b) send an instant message to collaborators. The features of these two early research tools, Elvin and Rear View Mirror, can also be found in modern state of the practice tools. For example, programmers can send an email, tweet, instant message, or Facebook message to potential helpers, or ask a question on question and answer sites such as Stack Overflow.
These tools, including Elvin and Rear View Mirror, require developers who are
interacting with a programming environment to switch to a separate tool to ask for help. A more lightweight approach is to provide the capabilities of the tools within the user interface of the programming environment. Both Jazz and CollabVS use this approach. Jazz enables distributed developers to a) change a status message that is displayed to collaborators and b) send an instant message to each other within the Eclipse programming environment [8]. CollabVS enables distributed developers to send an instant message to each other within the Visual Studio programming environment [24].
breakdowns that occur in distributed software teams found that developers are less comfortable asking remote rather than co-located software developers for help [25]. This lack of trust occurs because distributed software teams do not interact with each other as often as co-located teams. This result is consistent with previous work [13] which found that subjects doing side-by-side programming were willing and found it socially acceptable to interrupt a partner to ask for help, while in radically-co-located programming, they were afraid of disturbing the same partner. Moreover, studies show students and new programmers are late to use help [3,12] and
programmers often exhaust other forms of help before contacting a teammate. Even those who are willing to manually change their status are likely to not set it back, just as people forget to change their busy status in an IM tool or turn off the “call steward” light in a plane. One way to address these problems is to have teammates passively notice the need for help.
2.5 Techniques to Promote Passively Noticing the Need for Help
By passive, we mean that developers do not have to take explicit steps to communicate
that they need help, but observers monitor developers to determine if they need help. One way to make passively noticing the need for help independent of distance is to enable a pair of developers to passively monitor the progress of each other, using local [44] or distributed side-by-side programming [13]. Another approach is to use passive awareness mechanisms. Several passive awareness mechanisms have been developed to enable collaborators to become aware of a teammate’s activities. These mechanisms can be classified into two categories: syntactic and semantic. Such mechanisms provide information to remote collaborators that co-located collaborators could observe by sitting next to their teammates.
PortHoles [17] system developed by Dourish and Bly is in the syntactic category. PortHoles periodically communicates images of users to their collaborators with the goal of increasing increase awareness in distributed teams. One participant inferred interruptibility of his teammates by looking to see if they were talking to someone, while another participant inferred progress of a distributed student by noticing that he worked many late nights. Being aware of the
teammate’s presence led them to become aware of the progress on his dissertation.
One kind of passive awareness is workspace awareness [23], which is knowledge of another person’s interactions with a shared workspace. Gutwin and Greenberg argue that this information is useful for several types of activities: mixed-focus collaboration -- collaboration where a distributed team member switches between both group and individual work--
simplifying communication, coordination, anticipation of collaborators’ actions, and helping collaborators with their tasks. Workspace awareness supports distributed mixed-focus
collaboration because it enables collaborators who are working individually to monitor and keep track of the rest of the group's activity. Similarly, it simplifies communication because
collaborators can view information about a task without the need to explicitly ask teammates for that information. Collaborators monitoring the activities of others can also use this information to anticipate when teammates will have a need and fulfill it. Finally, collaborators can use information about teammates’ tasks to determine if they should offer help and the type of help that is required.
scenario in which Bob, on seeing Alice stuck on debugging a particular class, deduces she could use help, and offers it.
Providing virtual channels that give distributed users the feeling of “being there” in a single location is an important goal of CSCW. However, Hollan and Stornetta have argued that if CSCW is to be truly successful, it should go “beyond being there” by providing capabilities not available in face-to-face interaction [28]. Dewan [16] surveyed several software engineering tools, which provide “beyond being there” capability to collaborators. For example, systems by Schummer and Haake, Dewan and Hegde, and Sarma et al. automatically try to determine if the activities of members of a team conflict and make collaborators aware of these conflicts
[15,48,49]. One such capability not provided by the previously mentioned systems [15,48,49], is to infer when developers need help. Previous work has [4] argued that inferring when
developers need help could increase useful group awareness among large development teams, and enable new programmers to get help from their mentors [5,12].
2.6 Automatic Detection of Difficulty
Previous research has taken a step toward developing mechanisms that explicitly or implicitly infer developers’ progress status. A status is a semantic inference of interest to collaborators about the state of developers such as having difficulty, being interruptible, or the level of interruptibility. Each work uses a different technique to make this inference. First, we present a technique that uses non-standard equipment, second, one that uses logs from
2.6.1 Mining Interactions with Non-Standard Equipment
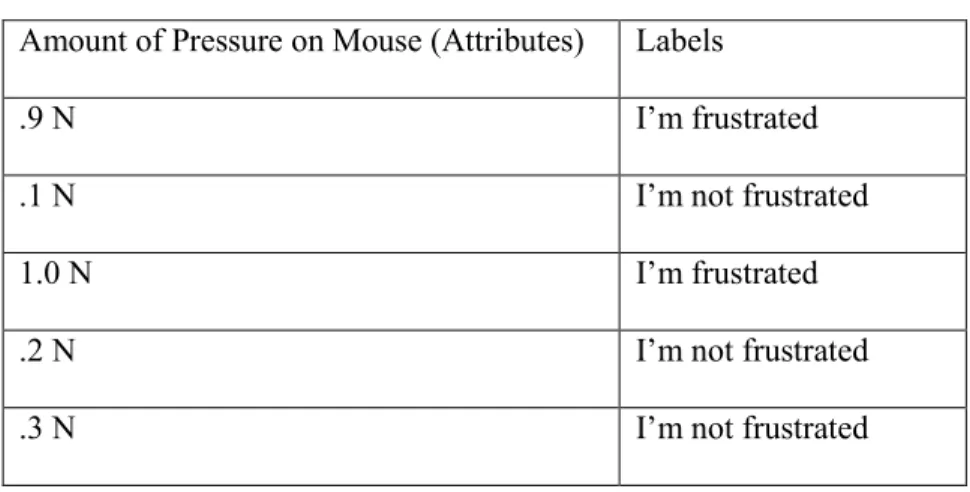
Kapoor et al. [35] use classification, a data mining technique, to infer when kids are frustrated. The goal of classification is to associate labels (in their case frustrated or not frustrated) with new input data based on known labels of preexisting data. The input data are sets of attributes or features that are in some way correlated with the labels. In the case of the labels, frustrated and not frustrated, an attribute could be the amount of pressure put on a mouse. A general approach to classification consists of four steps. First, training data, preexisting data with known labels, is gathered. Next, training data are used as input to an algorithm to create a function or model that identifies the relationship between attributes and labels. Then, new attributes are used as input to the model, which outputs the predicted values of labels. Finally, the performance of the model is evaluated. There are several ways to measure the performance of models. One such measure is accuracy, the number of correct predictions divided by the total number of predictions.
Table 2.2: Example of attributes and labels.
Amount of Pressure on Mouse (Attributes) Labels
.9 N I’m frustrated
.1 N I’m not frustrated
1.0 N I’m frustrated
.2 N I’m not frustrated
.3 N I’m not frustrated
They trained several classification algorithms to output models. One such algorithm is Support Vector Machines (SVMs), which find a hyper-plane, a plane in n-dimensional space, which best separates records into groups. To illustrate, let us assume that Table 2.2 shows an example of attributes taken from the equipment with mouse pressure data as an attribute and “I’m frustrated” or “I’m not frustrated” as a label. Figure 2.6 shows a hyper-plane based on Table 2.2 that separates the mouse pressure data. Data on one side of the hyper-plane represents the “I’m Frustrated” label and data on the other side represents the “I’m Not Frustrated” label. Many hyper-planes could be drawn to separate the data, but the best one represents the largest separation between groups of data and has the greatest distance between the nearest data point on each side of the hyper-plane.
To train SVMs, they aggregated data from all participants except the participant whose label they were trying to predict. The exclusion was meant to test if SVMs trained by one set of participants could be used to predict the label of another. This approach was used to predict the label of each participant. To determine the accuracy of the model’s predictions, they summed the number of times the algorithm predicted the correct label and divided the sum by the total number of participants. Their results show that SVMs algorithm was accurate 70% of the time. A problem with their approach is the overhead of using non-standard equipment.
2.6.2 Mining Interactions with Components
An alternative approach to infer difficulty is to log developers’ interaction with some component of their systems. Liu and Stroulia take an important step in this direction. They developed a tool that monitors students’ interactions with CVS and newsgroups to calculate the workloads and work-status of students [40]. Several CVS operations such as adding a file, checking out a file, removing a file, and modifying a file were used to determine students’ workloads. In particular, the number of file modifications was used to compare the workloads of two student groups to infer which group preformed the most work. This information could potentially be used to determine if students were having difficulty, but this awareness would be provided, not when they had the difficulty, but later, when they checked in the files or posted to newsgroups. Developers may struggle for a long time before they take these actions, and for certain problems, would not expect a response from the Internet. Providing earlier awareness requires mining interactions with the programming environment.
2.6.3 Mining Interactions with Programming Environments
programming environment and used classification to determine whether they were interruptible [20]. Their intuition was that a) the longer it took developers to respond to an interruption, the less interruptible they were and b) the specific actions developers perform right before they were interrupted would correlate with being interruptible. To test their intuition, they created an Eclipse plug-in to log developers' actions and randomly interrupted developers while they were performing maintenance tasks. Interruptibility was measured using the following equation:
They used this information along with developers’ actions to create training data (labels and attributes). To create labels, they clustered the amount of time it took for developers to respond to an interruption using the expectation–maximization (EM) algorithm as implemented in the WEKA toolkit [59]. Given a set of values (the time taken to respond to an interruption) and a number of clusters to produce, the algorithm computes the mean and standard deviation of each cluster and the probability that each value belongs to a cluster. They experimented with the number of clusters and decided to use three clusters because the standard deviation of one cluster was large when using two clusters. This large standard deviation indicated that some values in that cluster were significantly further away from the mean than other values. Therefore, they increased the number of clusters to three with the hope that those values that were significantly further away from the mean would form their own cluster. This was indeed the case. They found that three clusters represented a better division of the data and that four clusters offered no
To determine what actions indicate that developers are interruptible, engaged, or deeply engaged, they analyzed the logs of developers' actions to compute attributes. The goal of their analysis was to a) find actions that occurred within some time prior to an interruption and b) determine how frequent these actions occurred within that same time. They used these actions and their frequency as attributes. Some of their attributes are the number of edit events that occurred 15 seconds prior to an interruption, whether the Eclipse programming environment lost focus 5 seconds prior to an interruption, and whether developers stopped typing 15 to 20 seconds prior to an interruption. These attributes were combined with their labels to form training data. The labels engaged and interruptible were combined to form one label: engaged/interruptible.
They input this training data into the naïve Bayes classification algorithm, which
However, several tools [31,41,42,46] have explored logging programming activities and computing metrics using these activities. One such metric is the time spent programming, which could be used to infer when developers have difficulty. For example, if student programmers are expected to finish an assignment in ten hours, but one student is taking longer to complete the assignment, one can infer that the student is having difficulty. There are several ways to compute the time spent programming.
2.6.4 Computing Time Spent Using Programming Environment Events
McKeogh and Exton developed Eclipse Watcher [41], an Eclipse plug-in that logs students’ programming activities such as editing (insertions and deletions) code and navigating between files, the timestamp of these programming activities, the line number of a specific edit, and the file being edited. They used this logged data to compute the time spent editing on each line of code and the time spent editing and navigating. The goal of their work was to determine if these metrics could be used to determine the lines of code and files that are causing developers to have difficulty. This information could be used to find complex code and refactor it.
To compute the time students spent editing and navigating, the timestamp of the previous programming activity is subtracted from the timestamp of the current programming activity. A problem with this approach is that periods of inactivity could lead to inaccurate calculations of time spent. To overcome this problem, the timestamp of the current programming activity is disregarded if it occurs more than five minutes after the timestamp of the previous programming activity. This threshold was chosen arbitrarily. The time spent programming equals:
∑
where n is the number of programming activities, x is the timestamp of a programming activity,
xi is the ith timestamp of a programming activity, xi+1 is the ith + 1 timestamp of a programming
activity, and y is the number of minutes. To illustrate, consider the example log we created shown in Table 2.3 and Equation 3. The total time spent editing and navigating is 12 minutes.
Table 2.3: Our example of a programming activity log captured by Eclipse Watcher [41]. Id Timestamp Programming
Activity
Line
Number
File
Name
1 3:40 pm Editing 1 Test.java
2 3:41 pm Navigating n/a n/a
3 3:50 pm Navigating n/a n/a
4 3:51 pm Editing 1 Test.java
5 3:52 pm Editing 1 Test.java
6 3:53 pm Editing 2 Test.java
7 3:56 pm Editing 2 Test.java
8 3:59 pm Navigating n/a n/a
9 4:10 pm Editing 2 Test.java
This paper did not give any indication of how to compute the time spent editing on each line of code in a file, but it provided a table, Table 3 taken from [41], which shows the amount of time a student spent editing on each line of code in a file. Rows represent a file and columns represent five lines of code. Based on Table 2.4, we assume that time spent on each line of code is computed by a) modifying Equation 2 to only subtract the timestamps of edit events if both occur in the same file and on the same line, b) summing the computed time of edits with the same file name and line number, and c) summing the result of the previous step for every five lines of code. For example, using Table 2.3, if we perform steps (a) and (b), the total time spent editing code on line 1 is 2 minutes and on line 2 is 6 minutes. If we perform step (c), the total time editing lines 1 through 5 is 8 minutes.
Table 2.4: Amount of time editing each line of code [41]. Rows represent a file and columns represent five lines of code.
To evaluate their tool, they logged three student programmers with varying levels of experience while working on a maintenance task. Their preliminary results show that their tool could be used to explain the navigation behavior of the students. More specifically, the student with the most experience spent the least amount of time navigating code. One possible reason is that the most experienced student understood the code faster than the inexperienced students.
and edit behavior. To realize this goal they created ClockIt [46], an extension of the BlueJ programming environment that a) monitors compilations, edits (insertions and deletions), and the number of lines of code and comments written, b) computes the number and percentage of failed compilations, time spent on an assignment, and project growth, and c) graphically displays this information to students and instructors through a web interface. This paper gave no indication of how time spent is computed, but we assume they use Equation (2). Project growth is computed daily using the following equation:
(4)
To determine the usefulness of these metrics, they logged and computed metrics for 75 students working on lab assignments. However, they only reported the results of three of those students. Their results show that a) the student with the least amount of time spent writing code wrote the least amount of code and got the worst grade of the three students and b) two of the students spent nearly the same amount of time writing code, but the student with the best grade wrote less code. The student with the best grade encountered fewer compiler errors and did not encounter the same types of compiler errors as the other two students. These metrics could be used to answer questions common to instructors teaching a CS1 course. Examples of questions are: a) how much time are students spending on their assignments? and b) what types of errors do students make?
the percentage of successful compilations, and f) compare these metrics for an individual student against the class’s average of these metrics.
Time spent is estimated by grouping compilation events that occur within a fixed time, e.g. 30 minutes, into individual programming sessions and summing the time spent on each individual session for an assignment. The time spent programming for a session can be computed using Equation 3 if we set y equal to a fixed time. Thus, the amount of time spent programming for all sessions equals:
∑
where n is the number of sessions, x is the time spent programming computed for a session using Equation 1, and xi is the ith session. The example log we created in Tables 2.5a, 2.5b, and 2.5c
Table 2.5a: Student’s programming activity log
for session 1.
Table 2.5b: Student’s programming activity log
for session 2.
Programming Activity Timestamp
compilation event 3:40 PM
compilation event 3:45 PM
compilation event 3:54 PM
compilation event 4:00 PM
compilation event 4:15 PM
compilation event 4:38 PM
compilation event 4:50 PM
compilation event 5:45 PM
Total Time Spent: 80 minutes
Programming
Activity Timestamp
compilation
event 5:49 PM
compilation
event 6:04 PM
compilation
event 6:13 PM
compilation
event 6:14 PM
compilation
event 6:55 PM
Total Time
Table 2.5c: The sum of the time spent for sessions 1 and 2 on an assignment.
Time spent
Session 1
80
minutes
Time spent
Session 2
25
minutes
Total Time 105
minutes
Retina estimates the amount of time it would take a student to finish an assignment based on how much time (a) students in a previous offering of a course took on their assignments and (b) students in a current offering of the course took on previous assignments. Let Sc denote all
students in the current semester, Sp all students in the previous semester, j the student whose time
is being estimated, and n the assignment for which time is being estimated. The estimated
amount of time it would take j to finish n is computed by a) averaging the amount of time Sc took
on previous assignments, b) ranking j’s average time spent on previous assignments with respect to Sc, c) averaging and ranking the amount of time Sp spent on all assignments, and d) finding the
time it took similarly-ranked Sp to complete n. For example, a student with Id of 2 in Table 2.6a
a) ranked 2nd in terms of average time spent on all previous assignments, b) spent a similar average time on assignments as a student with an Id of 3 in a previous semester (Table 2.6b), and c) is predicted to spend approximately 107 minutes on an assignment, which is the same time that a student with an Id of 3 spent on that assignment (Table 2.6c).
To evaluate Retina, they a) logged 48 students doing class assignments and b) asked a small number of students and three instructors to comment on the usefulness of the tool.
determine that their classmates also struggled with the material. Instructors used to tool to a) determine the types of compilation errors that caused students to have difficulty, b) anticipate the questions students would ask, and c) tailor their help based on students’ compilation errors. They focused on compiler errors because student programmers often struggle with getting their programs to compile correctly [37].
Table 2.6a: Average time
students spent on all
assignments.
Table 2.6b: Average time
students taking a previous
offering of a course spent on
all assignments.
Table 2.6c: The time students
spent on an assignment in a
previous offering of the course.
Current Semester
Student Id Average time
spent on previous
assignments
1 165 minutes
2 175 minutes
3 177 minutes
4 179 minutes
Previous Semester
Studen
t Id
Average time
spent on previous
assignments
1 150 minutes
2 165 minutes
3 172 minutes
4 185 minutes
Previous Semester
Student
Id
Time spent on
assignment in previous
semester
1 95 minutes
2 105 minutes
3 107 minutes
4 113 minutes
2.6.5 Automatically Determining Compiler Error Difficulties
make their programs syntactically correct. The EQ metric could be used to determine when students are having difficulty. It is computed using the following algorithm:
Given a session of compilations, e1 through en:
(1) Pair consecutive compilations (e1, e2), (e3, e4), (e5, e6)…..(en-1, en)
(2) Assign a numerical penalty to pairs with compilation errors
a. Assign a penalty of 8 if both pairs have a compilation error
b. Assign an additional penalty of 3 if both pairs have the same compilation error (3) Divide the score assigned to each pair by 11 (the maximum value possible for each pair) (4) Sum the scores for each pair of compilation
(5) Divide the sum by the total number of pairs
2.6.5 Difficulties with Logic Errors
After student programmers get their program syntactically correct, they may also have problems getting their programs to output the correct information. We refer to these types of problems as logic errors. One reason students struggle with logic errors is that they do not give a warning like compiler errors. Therefore, students have to a) detect that the output is incorrect, b) find the code that is responsible for the error, c) understand the cause of the error, and d) modify the code to remove the error. This process is debugging and can often be difficult and time-consuming [58]. One way to ease the difficulty and reduce the amount of time students and even experienced developers spend debugging is to use debugging tools.
2.6.6 Using Breakpoint Debuggers to Overcome Logic Errors
One such tool, breakpoint debuggers, enables developers to a) pause a program’s execution at specified lines, b) inspect the value of variables of the paused program, and c) step through the program’s execution. Breakpoint debuggers are a standard part of modern programming
environments, but novice student programmers may hesitate to use them or may not be aware that they exist. More importantly, these tools require developers to guess which line of a program is causing an error. If developers guess incorrectly, the tools provide them with incorrect information. One way to reduce this speculation is to help developers find the line(s) of code that is causing an error, show developers the line(s) of code that is causing an error, explain the reason for the error, and fix the error.
who used a breakpoint debugger. One possible reason is that the WhyLine helped participants find the code that was responsible for an error. However, some participants still struggled with understanding the reason for their errors and thus, had trouble fixing them.
One way to overcome this problem is to anticipate the problems students will have and offer hints to students about why their programs are incorrect and how to fix them. This is exactly how Intelligent Tutoring Systems (ITS) helps students.
2.6.7 Intelligent Tutoring Systems
One example of an ITS is the LISP Tutor [2], which helps students who write code in the LISP programming language overcome compiler and logic errors. Since we have discussed an approach to detect compiler errors, we do not consider them from now on. To help students overcome logic errors, the tutor must model students’ progress. It does this by monitoring students’ individual keystrokes and determining whether students’ input will produce the correct output. The tutor monitors individual keystrokes using a structured editor that a) only enables one line of code to be entered at a time, b) automatically balances parenthesis, and c) provides placeholders that structure methods into segments. These segments are: a) the parameters of a method, b) initialization of variables, and c) the body of the method.
function append”, while a buggy rule would be “if the goal is to combine list1 and list2 into a
single list, then use the function add, add is the incorrect function name, should use the function append.”
If students’ input follows a buggy rule, the tutor determines the exact error and offers help to students. It offers two types of help. First, it gives students hints in natural language. It constructs hints using the buggy rules and the segment of the code where students are editing. For example, if the task is to define a method that takes two numbers as parameters and returns the sum of those numbers, and students write a method that returns the difference of two
numbers, the tutor would suggest that students use addition instead of subtraction. Second, after students make a certain number of errors, usually two, the tutoring module gives students the correct code piece of code, which enables them to continue solving the problem instead of staying stuck and giving up. One problem with Intelligent Tutoring Systems is that they
constrain students' input, which limits their ability to explore and try different ways of solving a problem.
2.6.8 Mining Code Changes
This limitation is overcome to some extent by Piech et al. who enable students to use the Eclipse programming environment, a non-structured editor, to invoke methods that are defined by instructors and use statistical models to automatically determine the amount of difficulty students had with their assignments [47].
“the student has just started”, b) students transitions from label to label could be graphically modeled to show how students transition through assignments, and c) the amount of difficulty students had on assignments was based on the number of code submissions it took before they moved to the next label.
To test their intuition, they created an Eclipse plug-in to log students’ code when they saved or compiled their program. Since labels were not predefined, they needed a way to a) automatically convert incremental code submissions into labels and b) predict the likelihood that students will transition to the next label. To create labels, they clustered 2000 code submissions from different students using the K-Mediods algorithm. Given n versions of code and k (the initial number of clusters to produce), they asked the algorithm to partition the code into clusters based on the median distance between versions of code. In their case, n was 2000 and k was 26. Since there is no well-known measure for determining similarity between two pieces of code, they created three measures.
The first measure, Bag of Words Difference, uses histograms to represent the frequency that key words appear in two versions of code and the Euclidean distance between two
programming syntax is excluded from the tree such as parentheses. The next step is to determine the Evolizer change severity score, which is the minimum number of changes needed to
transform an AST from one program to the AST of another program. Finally, they use the Evolizer change severity score to determine the difference between two programs.
To evaluate each measure, they a) selected 90 pairs of programs where each pair was from the same student, b) computed each measure for each pair of programs, c) recruited five experts to label each pair of programs as either similar or different based on style and functional rules given to them, and d) compared the experts’ assessment to each measure. The API Call Dissimilarity and the AST Change Severity metric preformed best. Therefore, they created a weighted sum of both metrics. We refer to the weighted sum of these metrics as code distance because they determine the amount of difference between two versions of code. They used the K-Mediods algorithm to partition the code submissions clusters based on the code distance. A manual inspection of the clusters confirmed that code submissions that were clustered together were similar in functionality and intuitively made sense.
To graphically model students’ transitions they used Hidden Markov Models (HMMs), which is a probabilistic finite state machine shown in Figure 2.7. The term “hidden” means that states or labels, are not explicitly labeled, but are inferred using data that correlates with states. In their case, data is incremental code submissions. Each label is a node in the finite state
machine and the HMM provides the probability of transitioning from one label to the next and A computes the probability that a code submission is a label given X. The final step is to
determine the amount of difficulty students had using the graphical model.
various labels and k (the number of clusters to produce), they asked the algorithm to partition the sequences into clusters based on the average probability that one student’s path could be
produced by another student’s HMM and vice versa. They found that there were several clusters where students submitted several versions of code, but remained in the same label. The number of times students remained in the same label indicated the amount of difficulty students had while programming. Interestingly, once students were having difficulty, there was a high probability that they would continue being stuck.
Figure 2.7: Hidden Markov Model of state transitions for a student. “Code” nodes represent a version of a student’s code at a particular time and “State” nodes represent the
high-level label the student is in at that same time. N represents the number of states and versions of code for a student.
2.7 Notification of Status
So far, we have discussed mechanisms that explicitly or implicitly infer developers’ progress status. One question left unanswered is, how do we display these inferences to collaborators? One way to display inferences is to use standard notifications; however,
notifications may be disruptive if they occur too frequently. One way to address disruptions is to enable observers to poll for a developer’s status through an IM status or newsfeed during their activity breakpoints [30] to learn about status changes. The Jazz [8] and CollabVS [24]
[24] and Jazz [8] programming environments, the view is located in the user interface of the programming environment. Alternatively, this information could be presented in a separate tool. For example, an update to the Jazz programming environment [21] provides newsfeeds, which are implemented in dashboards, a separate tool, to enable developers to passively monitor collaborators’ programming activities.
Yet another alternative is a manager polling for status during a “walk around”. Management by physically walking around is a well-known practice devised at HP by Dave Packard and Bill Hewlett. Sharma et al. [50] create a virtual analog of this technique to enable such management of remote offices. Their system, Virtual Office, is a 3D environment that mimics the layout of a physical office and supports audio and text chat, screen sharing, and navigation. To make the system even more realistic, only users that are within a certain distance of each other can communicate. Sharma et al. [50] envision several uses of this tool such as enabling employees who are at home to meet with collaborators who are either physically or virtually at the office and enable managers to remotely manage virtual offices. Combining a virtual office with difficulty status predictions could enable a manager visiting a worker to see, in addition to other information, the current difficulty status, and an aggregation of the status values of the worker computed since the last walk around.
![Figure 2.2: One of the war-rooms taken from [55].](https://thumb-us.123doks.com/thumbv2/123dok_us/8306778.2200046/30.918.227.690.107.342/figure-war-rooms-taken.webp)