EXPECTATIONS OF RECOVERY AFTER LUMBAR SPINE SURGERY: A QUALITY IMPROVEMENT PROJECT TO IMPROVE PATIENT SATISFACTION
Nancy L. Loyack
A DNP Project submitted to the faculty at the University of North Carolina at Chapel Hill in partial fulfillment of the requirements for the degree of Doctor of Nursing Practice in the
School of Nursing
Chapel Hill 2015
Approved by: Debra J. Barksdale
Dennis A. Turner
ABSTRACT
Nancy L. Loyack: Expectations of Recovery after Lumbar Spine Surgery: A Quality Improvement Project to Improve Patient Satisfaction
(Under the direction of Debra J. Barksdale)
Patients scheduled for lumbar spine surgery have expectations of recovery that can positively or negatively affect their post-operative surgical experience. Pre-surgical
counseling that prospectively addresses expectations of recovery can help: (1) direct patient education focused on setting realistic goals; (2) personalize their healthcare experience; and (3) allow for shared decision making. A discussion of patient expectations between the patient and provider is an essential component of the pre-surgical assessment that is often overlooked.
The purpose of the project was to determine patient expectations regarding lumbar spine surgery and to implement and evaluate an education program that was designed to better align patient-provider expectations, particularly those with high expectations. The project also involved evaluation of overall satisfaction with the provider and educational intervention. A descriptive cross-sectional analysis of 23 patients scheduled for lumbar spine surgery at a Veterans Affairs Medical Center in the southeast was conducted from June 11, 2015 through September 10, 2015.
educational intervention and provider consultation was high. Eighty-six percent of patients indicated that they were strongly satisfied with the information given and felt that the education resulted in reduced distress related to recovery after surgery.
The results of this project demonstrates that although patient and provider recovery expectations may initially be discordant, conversations that impart knowledge and
ACKNOWLEDGEMENTS
TABLE OF CONTENTS
LIST OF TABLES ... ix
LIST OF FIGURES ... x
LIST OF ABREVIATIONS ... xi
CHAPTER 1: INTRODUCTION ... 1
Problem Statement ... 1
Purpose of the Project ... 3
Literature Review ... 3
Patient Expectations, Satisfaction and Quality Care ... 3
Recovery Expectation Measures ... 8
Theory that Explains Project Intervention ... 12
Hildegard E. Peplau’s Theory of Interpersonal Nursing ... 12
CHAPTER 2: METHODOLOGY ... 16
Project Design ... 16
Subject and Setting ... 16
Variables and Measures ... 17
Demographic Variables ... 17
Recovery Expectation Measures ... 18
Patient Satisfaction Measures ... 19
The Education Intervention and Data Collection ... 20
CHAPTER 3: RESULTS ... 23
Demographic Data ... 23
Therapies, Diagnosis and Type of Surgery Data ... 24
Recovery Expectation Analysis ... 26
Patient Satisfaction Analysis ... 32
CHAPTER 4: DISCUSSION ... 35
Limitations ... 37
Implications for Practice and Future Work ... 38
Conclusion ... 40
APPENDIX A: SOCIAL DEMOGRAPHICS SURVEY ... 41
APPENDIX B: EXPECTATIONS SURVEY ... 44
APPENDIX C: AUTHOR PERMISSION TO USE EXPECTATION SURVEY... 46
APPENDIX D: MEDICAL INTERVIEW SATISFACTION SCALE-21 SURVEY... 48
APPENDIX E: JOURNAL PERMISSION TO USE SATISFACTION SURVEY... 49
APPENDIX F: AUTHOR PERMISSION TO USE SATISFACTION SURVEY ... 50
APPENDIX G: EXPECTATION SURVEY PRE- AND POST- TEST RESULTS AND NET CHANGE ... 51
LIST OF TABLES
Table 1. Patients Demographics (n=23) ... 24
Table 2. Therapies, Diagnosis and Type of Surgery ... 26
Table 3. Net Change in Patients with High Expectations ... 30
Table 4. MISS-21 Total Survey Scores and Mean per ID ... 33
LIST OF FIGURES
LIST OF ABREVIATIONS
CC Communication Comfort
CI Compliance Intent
DR Distress Relief
EMQ Expectations Met Questionnaire
HIPPA Health Insurance Portability and Accountability Act ID Identification
MeSH Medical Subject Heading
MISS-21 Medical Interview Satisfaction Scale
MODEMS Musculoskeletal Outcomes Data Evaluation and Management Systems NDI Neck Disability Index
NNEI National Nursing Educational Initiative ODI Oswestry Disability Index
PIQ Patient Intentions Questionnaire PROs Patient-reported outcomes SD Standard Deviation
SF-36 MCS Short Form Health Survey Mental Component Summary TENS Transcutaneous Electrical Nerve Stimulation
CHAPTER 1: INTRODUCTION
Lumbar spine degeneration and associated conditions such as lumbar stenosis can cause patients to experience pain, considerable difficulties with walking and can affect their quality of life (Athiviraham, 2011; McKillop, Carroll & Battie, 2014). Lumbar stenosis is the most common reason for back surgery in adults over 65 years of age. The associated
physical and psychological manifestations of painful spinal degeneration disorders can influence their goals or expectations of recovery after surgery (Mancuso, Duculan, Stal & Girardi, 2014). Understanding a patient’s mental outlook and expectations of lumbar spine surgery will help direct patient education focused on setting realistic goals and mutual decision making (Carr et al., 2011; Mancuso et al., 2014; Mancuso, Cammisa, Sama, Hughes, Ghomrawi & Girardi, 2013). For example, Soroceau, Abdu and McGuire (2012) found that prospectively addressing expectations improved postoperative patient satisfaction and functional outcomes after spine surgery. Mondloch, Cole and Frank (2001) in a
systematic review of 16 studies on patient expectations, found that positive expectations correlated with better health outcomes and emphasized the need for providers to “clarify patient expectations and to assist them in having appropriate expectations of recovery” (p. 174).
Problem Statement
provider expectations of lumbar spine surgery are often incongruent. Many patients have unrealistically high expectations of a surgical cure that is often at odds with a surgeon’s more pragmatic view. Whether recovery expectations and satisfaction are realistic or not, meeting expectations and achieving patient satisfaction can positively influence postoperative
outcomes. A critical discussion of patient expectations between patient and provider is a vital component of the pre-surgical education and assessment that is often overlooked. Pre-surgery counseling is therefore essential to identify and understand patient expectations to assist them in setting realistic expectations.
The Veterans Health Administration is the largest integrated healthcare system in the United States, serving more than 8 million veterans within 21 regional districts (U.S.
Purpose of the Project
The purpose of the project it to determine patient expectations regarding lumbar spine surgery and to implement and evaluate an education program that is designed to better align patient-provider expectations. The hope is that this expectations assessment will identify specific knowledge gaps so that education can be tailored to focus on setting realistic goals. The goal is that patients will have appropriate expectations of recovery to positively affect patient satisfaction with their surgical experience. If successful, this project will provide support for incorporating preoperative surgical counseling as a foundation for a structured preoperative educational program as a standard of care at the Durham Veteran Affairs Medical Center, Department of Neurosurgery.
Literature Review Patient Expectations, Satisfaction and Quality Care
In the United States, the incidence of lumbar spinal stenosis is estimated between eight and 11%. Lumbar spinal stenosis is expected to affect up to 2.4 million Americans by 2021 with the rate of lumbar spine surgery doubling in the coming years due to an aging population (American Academy of Orthopaedic Surgeons, 2011). Furthermore, as more baby boomers begin to qualify for Medicare, lumbar spine stenosis will have a huge impact on government spending creating a need for providers and hospitals to develop patient satisfaction measures that improve surgical outcomes.
Satisfaction is a valid patient-centric metric that measures overall contentment with healthcare services (Godil et al., 2013). Public reporting of these measures has led to increased accountability and a need for a shift towards value-based care in healthcare
develop patient satisfaction tools that identify patients who will likely benefit from surgery as compared to patients with unrealistic recovery expectations who are more likely to have poor outcomes.
The Institute of Medicine’s landmark report, Crossing the Quality Chasm (2001) identified patient satisfaction and patient-centered care as priority areas to improve healthcare in the United States. Hospitals have a financial incentive to improve patient satisfaction and outcomes as a result of pay-for-performance and Medicare reporting requirements to qualify for full payment (Kutney-Lee et al., 2009).
Understanding veteran expectations of recovery after spine surgery is an important component of patient-centered care and providers should discuss expectations with their patients. Mondloch et al. (2001) conducted a systematic review from 1996 to 1998 using MEDLINE to identify published studies that measured a relationship between patient expectations and health outcomes. Studies were deemed relevant if title or abstract included words such as “patient”, “survivor”, “client”, “subject”, “participant,” at least one
expectation instrument was clearly described, outcome criteria was relevant to research question, and included a stratified analysis of data. The two authors conducted an independent assessment using this criteria assessment to evaluate and score studies using Cohen’s kappa statistic. Disagreements in quality assessments were resolved by general agreement. Final analysis revealed 15 moderate quality studies that found a positive association between expectations and better health outcomes. Results from this study highlight the need for providers to have conversations with patients about their recovery expectations prior to surgery. This conversation will allow providers to impart knowledge and understanding of recovery so patients can decide if surgery is right for them.
greater patient satisfaction with results (p=0.01) than patients who expected residual pain. Patients who were more optimistic and did not expect pain after recovery reported better clinical outcomes scores when compared with the study participants that expected residual pain. Higher preoperativemental component summary scores predicted significantly higher postoperative satisfaction (p=0.03) and less neck pain (p=0.003). Patients who expected no pain after surgery reported better outcomes. Demographic analysis did not show any significant differences in expectation groups. This study suggests that optimism is a mental health component that may positively impact satisfaction and outcomes. They concluded that future research should include tools to measure recovery expectations in a broader sense, not just limiting to pain and should include a more detailed analysis of specific psychological influences.
Preoperative counseling can identify common concepts that may impact outcomes and satisfaction after surgery. Patients with higher preoperative disability and pain may not benefit from surgery if outcomes and satisfaction are poor. For example, a prospective case series of 145 patients undergoing single level lumbar spine surgery were evaluated to determine a relationship between pre-surgery expectations and postoperative outcomes and satisfaction (Licina, Johnston, Ewing, & Percy, 2012). Patient characteristics were assessed but not included in statistical analysis. Most patients were male (91), insured (117) and had discectomy surgery (58). Average age was 54. All patients had routine preoperative
counseling at least twice before surgery. Counseling included the risks, benefits and goals of surgery. The Oswestry Disability Index (ODI), leg VAS and back VAS scores were
measured before surgery and postoperatively at six weeks and six months. Patient
pain that would make them least satisfied with their surgical outcome. Data was collected by the same research assistant to minimize bias. Improvements were measured by subtracting preoperative and postoperative scores. Most patients had clinically relevant improvements and 135 were either “very satisfied” or “satisfied” with their outcome. Of the sample, ten patients were “somewhat satisfied.” These patients also had higher disability and pain scores and expected more pain after surgery than the sample population. Correlational analysis of expectations and satisfaction was difficult as most patients were “very satisfied.” They were unable do a correlational analysis of the “satisfied” and “somewhat satisfied” as the sample size was too small for statistical relevance. Correlational analysis of the “very satisfied” showed no statistical significance as most of these patients had high expectations and were satisfied with their outcome likely indicative that their expectations were met. Limitations of the study described by the authors are the small sample size and that participants may have had difficulty quantifying expectations. Future research should include statistical analysis of the relationship between expectations, pre-surgery counseling and postoperative outcomes.
Similarly, other researchers have reported a relationship between preoperative expectations, outcomes and satisfaction. Soroceanu, Ching, Abdu, and McGuire (2012) studied preoperative expectations in cervical and lumbar spine surgery to determine its influence on postoperative functional outcomes and patient satisfaction. Data were collected prospectively from 402 patients at two medical centers via a web based health survey
conducted before and after surgery. Preoperative expectations were measured using the Musculoskeletal Outcomes Data Evaluation and Management Systems (MODEMS)
disability. Fulfillment of these expectations and postoperative satisfaction were measured postoperatively between six and twelve weeks using a MODEMS satisfaction survey. The Oswestry Disability Index and a Short Form Mental and Physical Health Survey were
provided at the same time to assess functional outcomes. The average age of the participants was 52, most were female (56.25%), nonsmokers (56.25%) and undergoing lumbar spine surgery (74.19%). The researchers found that higher pre-operative expectations of their capability to exercise after surgery was associated with less satisfaction (p=0.03). Patients who expressed greater fulfillment of expectations in regards to pain and return to work were more satisfied with post-surgical outcomes (p=0.008 and 0.003. respectively). Patients undergoing cervical spine surgery were less satisfied but had better functional outcomes. The author’s felt this was because lumbar spine surgery has a longer recovery time possibly requiring a survey time point after surgery. This study supports the need for providers to discuss realistic expectations regarding the likely ability to exercise postoperatively and that patients scheduled for lumbar spine surgery may need more time for recovery to improve postoperative satisfaction.
Recovery Expectation Measures
expected level of improvement, for example, “complete improvement, back to normal or not back to normal, but a lot of improvement.” Responses were recorded verbatim. Participants volunteered an average of four expectations. Women volunteered more. Study participants ranged in age from nineteen to ninety-seven years with a primary diagnosis of lumbar stenosis. Most had failed physical therapy, epidural steroid injections and non-steroidal anti-inflammatory medications. The identified expectations were grouped into categories and a draft survey was developed. These categories were pain, personal and work activities, mobility and psychological distress.
Phase two included a test-retest analysis of the draft survey. Participants were given the survey twice before surgery. All participants felt survey items were applicable. Thirty-one items in the survey were endorsed 43% to 100% by participants. In phase three, a final analysis revealed four common recovery expectation themes that explained 67% of variance: (1) function (walking and exercising); (2) personal daily activities (sleeping and managing personal care); (3) psychosocial (social interaction and decrease in emotional stress); and (4) skeletal improvement (leg strength and balance). Pain was the only theme that was not attributed to any factor as similarly expected by all. Analysis revealed patients with the diagnosis of herniated nucleus pulposus had higher expectations than those with spinal stenosis. Researchers surmised that expectations were greater as these patients tended to be younger and their condition more acute. The participants that had lumbar stenosis were older with a chronic condition so possibly their expectations are lower.
Survey that can be used to capture patient recovery expectations prospectively. The survey generates an overall score that identifies the number of patient expectations and degree of expected improvement. Mancuso et al. (2013) felt the primary advantage of the survey is its usefulness in the preoperative clinical setting. This survey can identify specific recovery expectations to enhance communication tailored to what matters most to the patient.
The Patient Intentions Questionnaire (PIQ), a post-visit Expectations Met Questionnaire (EMQ) and a Medical Interview Satisfaction Scale (MISS-21) are other examples of measures used in research to determine between patient expectations and satisfaction. Hageman and colleagues (2014) studied 86 patients scheduled for hand surgery to determine a relationship between pre-visit expectations and satisfaction. Participants completed a pre-visit PIQ, a post-visit EMQ and a MISS-21. The median age of participants was 44 and an equal number of men and women were included in the study. Most were white (84%), had an acute diagnosis (56%), working full time (65%), married (50%) and seen primarily by one surgeon (90%). The PIQ was given before the clinical encounter with the surgeon. It consists of 34 questions that measure pre-visit expectations such as, “ I want my general practitioner to understand the problem”; and “I want the general practitioner to explain my emotional problems.” Participants were asked to weigh their responses to these questions on a 3 point Likert scale as to whether they agreed, were uncertain or disagreed. The EMQ consisted of the same PIQ questions but written in the past tense to see if
expectations were met after the clinical encounter. For example, “ The doctor understood the problem” or “the doctor explained my emotional problems.”
understanding; (3) emotional problems; (4) diagnostics; and (5) comforting. Factor analysis revealed that pre-visit patient goals focused more on information and explanation, comforting and diagnostics than emotional factors. The study found that met expectations, not pre-visit expectations correlated with satisfaction with the clinical encounter (p<0.001). Information and explanation (p<0.001) was the only category that correlated with satisfaction that highly met expectations. The other four categories only met expectations to a moderate or low degree. The researchers recommend counseling to include evidence based information and educational material that is provided at initial consultation to improve pre-visit expectations in the pre-surgical encounter.
improved PROs. Expectation fulfillment was associated with improved patient satisfaction in 18 of the studies and improved PROs in 24 (40%). Ten of the studies reported improved quality of life correlated with positive expectations. Positive preoperative expectations correlated to less reported pain (8 studies) and disability (15 studies) when compared to patients with negative preoperative expectations.
Limitations identified in the study are the paucity of homogeneous methods to
measure preoperative expectations and postoperative patient reported outcomes and that most studies included were observational. Regardless of these limitations, the literature synthesis did identify common patient reported outcomes associated with preoperative expectations that can direct education to improve the consent process, enhance patient knowledge and prepare them for their postoperative recovery.
These studies validate using self-report surveys are reliable instruments to identify common expectation concepts that may impact counseling and patient education.
Furthermore, surveys can reflect individualized expectations, which can direct preoperative discussions so patients may have appropriate expectations of recovery. By tailoring
education to align patient-provider surgical goals, we can fulfill postoperative recovery expectations and positively affect patient satisfaction with their surgical experience.
Theory that Explains Project Intervention Hildegard E. Peplau’s Theory of Interpersonal Nursing
based upon a common goal that provides the incentive for the therapeutic relationship (Plummer & Molzahn, 2009). The common goals are to understand recovery expectations and to ensure that patients and providers share similar priorities and are working towards the same realistic goals. The theory incorporates shared decision-making and interactive
communication that allows patients to express their surgical expectations so the practitioner may understand their hopes to tailor education.
Peplau believes that patients have a subjective perception about the quality of their life that is linked to their wellbeing or psychological wellness. Practitioners use their
expertise as a counselor, educator and resource to interact with patients to impact their health goals. One-to-one counseling helps build trust and improve patient satisfaction, mutual understanding and open communication to affect change in surgical perceptions and expectations (Radtke, 2013).
Nurse practitioners have an opportunity to convey surgical information regarding recovery expectations because the patient needs it to make sense of the experience.
Peplau’s theory moved thinking away from what nurses do to patients to what nurses do with patients, making nursing a collaborative and interactive process (Sheldon & Lee, 2008). Her theory focuses on specific components or processes that comprise the
relationship that is based upon the patients perceived needs (McCamant, 2006). These processes are a series of behaviors that occur in sequence and unfold in a predictable way. The term process implies organization and structure applied to critical thinking by the nurse. There are four distinct elements to the process: (1) orientation; (2) identification; (3)
exploitation; and (4) resolution. Orientation is the initial encounter when nurses are responsible for helping the patient feel comfortable and reduce anxiety associated with the upcoming surgery, allowing the patient the ability to benefit from care. Identification is when the patient recognizes that they need care. The patient may express ambivalence caused by anxiety. The nurse provides assurance during this phase, clarifies expectations and provides prospective education. Exploitation occurs when the patient acknowledges that he needs the care the nurse can provide. The final phase, resolution, describes the conclusion of the healthcare encounter when the patient is able to understand recovery expectations
that impact the relationship. Within the therapeutic interactions, nurse clinicians identify the therapeutic use of self that will have the most impact on learning: (1) counselor; (2) educator; and (3) leader. Nurse practitioners are able to incorporate their expert knowledge and
CHAPTER 2: METHODOLOGY Project Design
The Expectations of Recovery after Lumbar Spine Surgery Patient Satisfaction Program was a descriptive cross-sectional analysis of a quality improvement and patient education project that was conducted from June 11, 2015 through September 10, 2015 at the Durham Veterans Affairs Medical Center. A pre- and post-test comparison design was used to determine whether veteran feedback through surveys enhances the clinical encounter and directs education in a way that positively impacts veteran satisfaction with recovery
expectations. The Institutional Review Boards at The University of North Carolina at Chapel Hill and the Durham Veterans Affairs Medical Center reviewed the project and deemed it exempt. The overall purpose of the project was to determine whether the expectation survey could be used as a tool in the preoperative setting to identify veterans with high expectations and whether specific education targeting knowledge deficits could modify their expectations so they could be considered more reasonable and therefore realistic.
Subject and Setting
and preoperative visit was variable depending on surgery availability and patient readiness. Twenty-three veterans were recruited when they presented to their pre-surgery visit. Patients were invited by the clinic nurse to participate by completing a survey regarding their
expectations of recovery after their lumbar surgery. The study was described in detail by the project principle investigator who is a nurse practitioner and who also delivered the patient education intervention. Patients were excluded if they had a history of back surgery, were scheduled for lumbar fusion surgery, declined participation, had an urgent surgical need, or had cognitive or language limitations and were incapable of completing the survey.
Variables and Measures Demographic Variables
Recovery Expectation Measures
Recovery expectations were measured prior to surgery using the Hospital for Special Lumbar Spine Surgery Expectations Survey (See Appendix 2). Permission to use this survey was obtained from email correspondence with Dr. Carol A Mancuso, one of the authors (See Appendix 3). The survey consisted of 21 questions measuring a patient’s expectations of improvements following their lumbar spine surgery (Mancuso et al., 2013). All items were scored from 1 to 5. A score of one meant that the patient expected to return to normal or expected complete improvement. A score of 2 meant not back to normal but expected a lot of improvement. A score of 3 meant not back to normal but expected a moderate amount of improvement. A score of 4 meant not back to normal but a little improvement is expected and a score of 5 meant that the patient had no expectations or that that item did not apply. Specific expectation questions included relief of pain, relief of symptoms that interfered with sleep, regain strength in legs, improve ability to walk more than several blocks, remove need for pain medications, improve ability to work or go back to work. For example, “ How much improvement do you expect in the relief of pain as a result of your spine surgery?”
Responses were recorded in reverse order, for example a score of 4 meant back to normal or complete improvement and a score of 3 meant not back to normal but a lot of improvement. Only 20 of the responses were summarized to obtain a raw score as the two items about employment were mutually exclusive. Raw scores ranged from zero to 80. A transformed score was reported by dividing the raw score by 80 then multiplying by 100. The transformed overall score range was 0-100. Higher scores indicated greater
(Mancuso et al., 2013). The survey was administered before and after the educational intervention.
Patient Satisfaction Measures
Patient satisfaction with provider consultation and education was determined by the MISS-21(See Appendix 4). Permission to use this survey was obtained from the publishing journal, Family Practice and one of the co-authors, Professor John Weinman (See Appendix 5 and Appendix 6). Patients were asked to indicate their level of agreement with 21
questions based upon a 7-point Likert scale (Meakin & Weinman, 2002). For example, “The doctor told me just what my trouble is”; and “The doctor seemed to take my problems seriously.” A score of 1 on an item means they very strongly disagreed with the question. A score of 7 means very strong agreement with the question. Scores can range from 21 to 147. A maximum score of 147 indicates highest satisfaction. The scale also included four
disagree raw score would be a 1 but by applying reverse scoring principles will equal a score of 7. Question 19 is positively worded and should be not be reverse scored.
Patient satisfaction was measured to determine the patient’s degree of satisfaction within these four sub scales and overall satisfaction with the provider performance to
determine the discrete aspects of patient satisfaction. An overall mean satisfaction score was calculated by dividing the total satisfaction score by the total number of answered questions. The discrete dimensions of satisfaction were scored by summing the scores for each subscale and dividing by the number of responses per subscale.
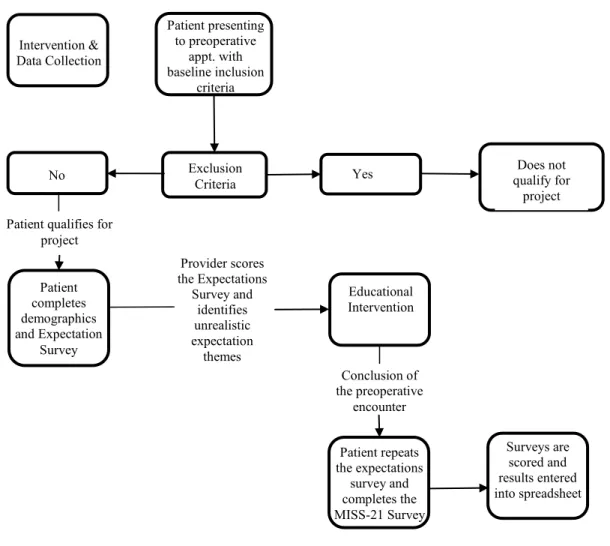
The Education Intervention and Data Collection
Those who met the inclusion criteria and agreed to participate in the project were assigned a study number (See Figure 1). In accordance with Health Insurance Portability and Accountability Act (HIPAA), all data was entered onto an excel spreadsheet that was
clinical encounter. Counseling included the nurse practitioner’s expert knowledge on
postoperative recovery, evidence based information and educational material provided during the session.
Figure 1. Process Diagram
The individual responses provided insight into the patient’s own treatment expectations. These responses directed education focused on what mattered most to the patient. Patient responses enhanced communication so that the nurse practitioner could clarify and modify expectations to align patient-provider surgical goals so that the patient could have more appropriate expectations of recovery. Through mutual understanding and shared decision-making, as highlighted by Peplau (Merritt & Procter, 2010), patients could
CHAPTER 3: RESULTS Data Analysis
Data were analyzed using R statistical computing (R Core Team, 2015). Descriptive statistics (i.e., means, standard deviations, frequencies, percentages, and ranges) were used to describe the sample, the distribution of the demographic data, the Hospital for Special
Surgery Lumbar Spine Surgery Expectations Survey scores, the MISS-21 satisfaction scores and its subscales. A paired t-test was conducted to assess for any changes in mean scores on the Hospital for Special Surgery Lumbar Spine Surgery Expectations Survey pre and post visit. Mean imputation method was used to account for missing values.
Demographic Data
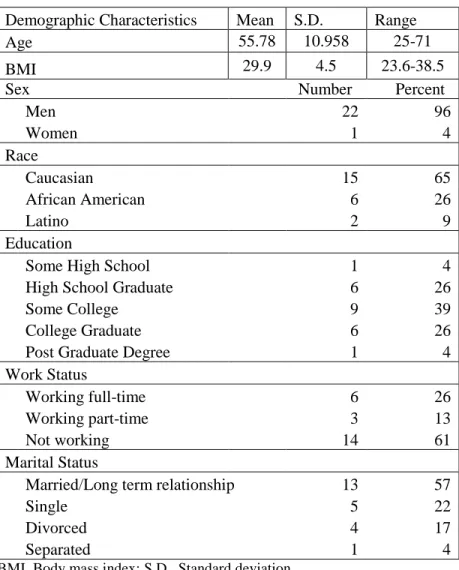
Five (22%) were single, four (17%) divorced and 1 (4%) was separated. In terms of working status, 14 (61%) of the patients were not working, six (26.%) worked full-time and three (13%) worked part-time. The demographic data is represented in Table 1.
Table 1. Patients Demographics (n=23)
Demographic Characteristics Mean S.D. Range
Age 55.78 10.958 25-71
BMI 29.9 4.5 23.6-38.5
Sex Number Percent
Men 22 96
Women 1 4
Race
Caucasian 15 65
African American 6 26
Latino 2 9
Education
Some High School 1 4
High School Graduate 6 26
Some College 9 39
College Graduate 6 26
Post Graduate Degree 1 4
Work Status
Working full-time 6 26
Working part-time 3 13
Not working 14 61
Marital Status
Married/Long term relationship 13 57
Single 5 22
Divorced 4 17
Separated 1 4
BMI, Body mass index; S.D., Standard deviation
Therapies, Diagnosis and Type of Surgery Data
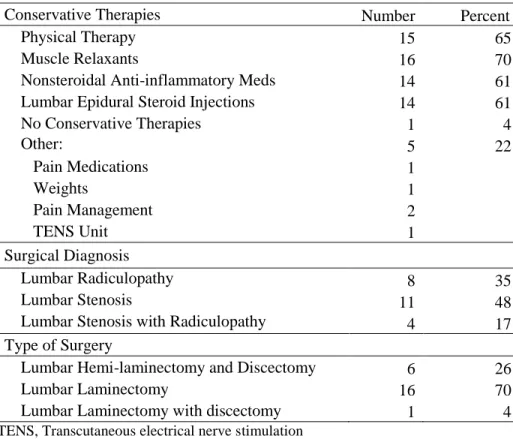
Over half of the patients had tried conservative medical therapies before surgery. These prior treatments were physical therapy, muscle relaxants, non-steroidal
non-steroidal anti-inflammatory medication and 14 (61%) lumbar epidural steroid injections. Patients were prompted to list other therapies attempted in free text. Responses revealed that one patient had tried weights, two pain management, one a transcutaneous electrical nerve stimulation (TENS) unit and one pain medications. These additional management strategies were used by 22% of the sample. One patient (4%) had not tried any other management strategies.
Patient chart analysis revealed that 11 (48%) patients had a diagnosis of lumbar stenosis, 8 (35%) had the diagnosis of lumbar radiculopathy and 4 (17%) had co-existing lumbar stenosis with lumbar radiculopathy. The majority of the patients were scheduled for a lumbar laminectomy (16; 70%). The remainders were scheduled for a lumbar hemi-laminectomy and discectomy (6; 26%) and one was scheduled for both a lumbar
laminectomy and discectomy (4%). Table 2 gives the frequency and percentage of therapies, diagnosis and type of surgery of patient respondents
Table 2. Therapies, Diagnosis and Type of Surgery
Conservative Therapies Number Percent
Physical Therapy 15 65
Muscle Relaxants 16 70
Nonsteroidal Anti-inflammatory Meds 14 61
Lumbar Epidural Steroid Injections 14 61
No Conservative Therapies 1 4
Other: 5 22
Pain Medications 1
Weights 1
Pain Management 2
TENS Unit 1
Surgical Diagnosis
Lumbar Radiculopathy 8 35
Lumbar Stenosis 11 48
Lumbar Stenosis with Radiculopathy 4 17
Type of Surgery
Lumbar Hemi-laminectomy and Discectomy 6 26
Lumbar Laminectomy 16 70
Lumbar Laminectomy with discectomy 1 4
TENS, Transcutaneous electrical nerve stimulation
Recovery Expectation Analysis
A paired t test was used to compare the two population means before and after the educational intervention using the pre and post- test survey expectation scores from the Hospital for Special Surgery Lumbar Spine Surgery Expectations Survey. The p value was equal to 0.1021, which meant that the differences in the sample means (pre and post
intervention) were not statistically significant and thus no significant changes occurred when comparing the means of the sample’s pre and post survey scores.
method replaced these values with the arithmetic average of the observed data for that variable. For example if we have 1, 2, 3, 4, NA, then would substitute 2.5 for NA, which is the mean of 1, 2, 3, and 4.
The two questions (Q17 and Q18) regarding employment were mutually exclusive meaning you only scored once based upon if you worked or were not working. Five of the respondents answered both questions as if they were working and not working. For this discrepancy, a comparison was made based upon how the patient responded to working status in the social demographics survey. If the patient answered “not working” for Q6 in the social demographics but answered both Q17 and Q18 then the response for Q18 was scored and Q17 response omitted.
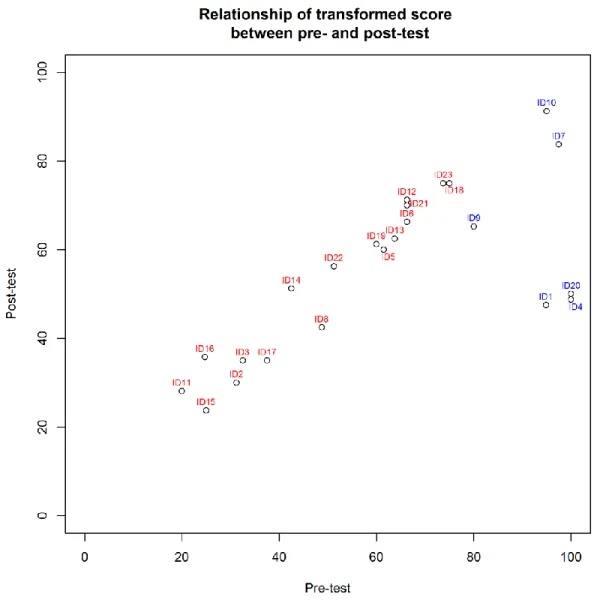
The pre-test expectation survey transformed scores ranged from 20 to 100. The mean pre-test score was 61.45 with a standard deviation of 25.77. The post-test expectation scores ranged from 23.75 to 91.25. The mean post-test score was 55.01 with a standard deviation of 18.54. A comparison of the pre and post-test ranges reveal that there was an increase from the lower scores and a decrease in the higher scores after the educational intervention. The post- test results showed an 8.75 -point decrease in the highest value and a 3.75- point increase in the lowest values after the educational intervention. Figure 2 depicts the pre and posttest transformed score ranges.
PRE-TEST
POST-TEST
20 -100
23.75 – 91.25
Figure 3. Scatter Plot Graph of the Relationship of Pre- and Post-test Expectation Scores
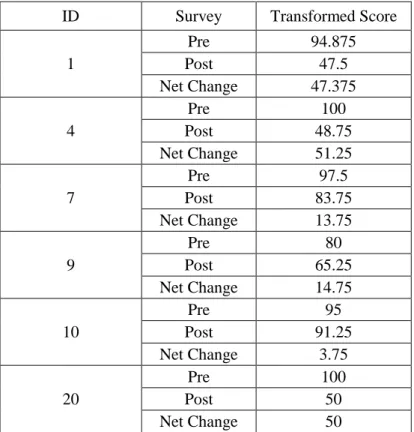
All six of these respondents with the highest expectations had a net change or decrease in their post-test expectation survey scores that ranged from 3.75 to 51.75 points after the educational intervention. For example, patient #9 whose pre-test score was 80 had a 14.75 point decrease in post survey score after the intervention and patient #4 had a 51.25 decrease in post survey scores. Table 3 shows the net change in the scores of patients with high expectations.
Table 3. Net Change in Patients with High Expectations
ID Survey Transformed Score
1
Pre 94.875
Post 47.5
Net Change 47.375
4
Pre 100
Post 48.75
Net Change 51.25
7
Pre 97.5
Post 83.75
Net Change 13.75
9
Pre 80
Post 65.25
Net Change 14.75
10
Pre 95
Post 91.25
Net Change 3.75
20
Pre 100
Post 50
Net Change 50
ID, Patient identification number
The total sample’s pre and post test scores and net change are outlined in Appendix G. All of the patients except two had a net change whether positive or negative after the education program.
Their post-test scores decreased respectively: # 1 from 94.875 to 47.5; # 4 from 100 to 48.75 and # 20 from 100 to 50. The net change or decrease in post-survey scores ranged from 47.5 to 50. These patients benefited the most from the education they received as their
expectations clearly decreased the most. The three other patients (#7, #9 and #10) had a net decrease in scores that ranged from 3.75 to 14.75. These patients self-reported that even after the educational intervention, they remained hopeful as a reason that they minimally changed their post expectation survey scores.
The sample also showed a positive net change in pre-test expectation scores ranging from 20 (the lowest score) to 73.75 in eight patients (#11, # 12, # 14, # 16, # 19, # 21, # 22 and # 23). These patients had low to moderate pre-test expectations whose post-test expectations increased after education. These patients can be visualized on the scatter plot graph as having persistent low to moderate expectations regardless of the education. These patients had an increase in post-survey scores that ranged from 1.25 to 11 points. The education improved expectations but did not increase them unrealistically. The educational intervention did not have any effect on two of the respondents (# 6 and # 18). Their pre and post survey scores had a net change of zero.
Questions 2, 5, 6, 7, 8, 16 and 21 were the most frequently endorsed by respondents as high expectation concepts. These were endorsed by eight (35%) of the 23 patients by responding with a transformed score of 4. These respondents expected complete
Patient Satisfaction Analysis
The MISS-21 revealed an overall satisfaction with provider and educational
Table 4. MISS-21 Total Survey Scores and Mean per ID
ID MISS-21 overall survey score (21) MISS-21 Mean
1 125 5.95
2 147 7
3 131 6.24
4 116 5.52
5 140 6.66
6 135 6.43
7 139 6.62
8 137 6.52
9 124 5.9
10 125 5.95
11 130 6.19
12 136 6.48
13 138 6.57
14 129 6.14
15 147 7
16 134 6.38
17 138 6.6
18 147 7
19 140 6.66
20 123 5.86
21 143 6.81
22 128 6.1
23 147 7
Average 134 (S.D.= 8.74) 6.42 (S.D. =0.42)
ID, Patient identification number; MISS-2, Medical Interview Satisfaction Scale-21; S.D., Standard deviation
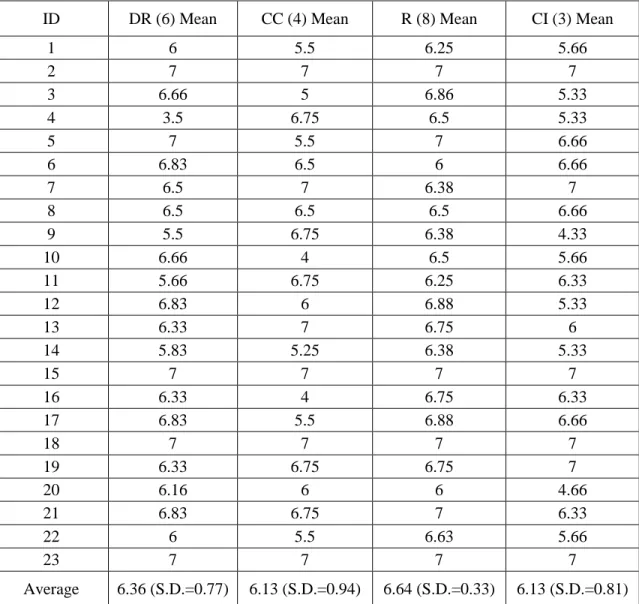
satisfied with the information given and expressed intent to follow directions. See Table 5 for subscale analysis.
Table 5. MISS-21 Survey Subscale Mean and Overall Mean Analysis by Patient Identification Number
ID DR (6) Mean CC (4) Mean R (8) Mean CI (3) Mean
1 6 5.5 6.25 5.66
2 7 7 7 7
3 6.66 5 6.86 5.33
4 3.5 6.75 6.5 5.33
5 7 5.5 7 6.66
6 6.83 6.5 6 6.66
7 6.5 7 6.38 7
8 6.5 6.5 6.5 6.66
9 5.5 6.75 6.38 4.33
10 6.66 4 6.5 5.66
11 5.66 6.75 6.25 6.33
12 6.83 6 6.88 5.33
13 6.33 7 6.75 6
14 5.83 5.25 6.38 5.33
15 7 7 7 7
16 6.33 4 6.75 6.33
17 6.83 5.5 6.88 6.66
18 7 7 7 7
19 6.33 6.75 6.75 7
20 6.16 6 6 4.66
21 6.83 6.75 7 6.33
22 6 5.5 6.63 5.66
23 7 7 7 7
Average 6.36 (S.D.=0.77) 6.13 (S.D.=0.94) 6.64 (S.D.=0.33) 6.13 (S.D.=0.81)
CC, Communication comfort; CI, Compliance intent; DR, Distress relief; ID, Patient identification number; MISS-2, Medical Interview Satisfaction Scale-21; R, Rapport; S.D., Standard deviation
CHAPTER 4: DISCUSSION
This project sought to determine whether the use of the Expectation Survey in the preoperative setting could identify patients with high expectations that could be modified to be more realistic following education targeting knowledge deficits about recovery. The project also evaluated whether patients’ were overall satisfied with the provider consultation and the education received. Results demonstrated that expectations can vary among patients but that formally measuring expectations in the preoperative setting allowed the provider to understand individual patient expectations and target education that positively affected patient satisfaction with their planned surgical experience.
Findings from the project indicated that there was no significant change in patient expectation scores before and after the educational intervention; however a descriptive analysis of the pre and post survey data revealed much relevant information that has clinical significance. For example, the scatter plot revealed that most of the sample had moderate to low expectations pre and post survey and that they were minimally impacted by the
education received. Pre and post- test range results revealed a net change or decrease in expectations by 8.75 points after the intervention. Specifically this showed that the
educational intervention did decrease the expectations of the patients with the largest scores from 100 to 91.25.
Overall the expectations survey did identify six patients with the highest
the highest expectations. This trend infers that the educational intervention did have a clinical impact although it was not statistically significant. The net change analysis showed that all six of the patients with the highest expectation scores did benefit from the
intervention, meaning that the education did moderate their expectations. More importantly, the project identified three patients with high expectations whose expectations were modified at least by a score differential of 47.375. This is relevant as it shows that the educational intervention had a positive effect as the education received did decrease the patient’s
expectations with the highest scores. This implies that education and counseling did impact these individual patient’s pre-surgical expectations.
Most of the sample had moderate expectations to begin with. These are the patients that already have reasonable expectations. This may be because their expectations were reflective of education already received. Positioning of the data, meaning if the pretest was given during their initial neurosurgical consultation, may be more reflective of unreasonably high expectations and would show a more significant effect. These patients may perceive the most benefit from the education they receive. The expectations survey was given during the preoperative encounter. All patients had likely already received education, during their initial neurosurgical consultation, regarding their diagnosis, prognosis and the benefits of surgery. The education already received may have helped to more realistically align expectations prior to this project.
impact satisfaction and outcomes (Carr et al, 2011). Imparting optimism in patients with low expectations is as essential as moderating patients with high expectations.
Overall patients reported that they agreed that the educational program and provider consultation was beneficial. Expectation fulfillment is associated with improved patient satisfaction in prior literature (Hageman et al., 2014; Soroceau et al., 2012; Waljee et al., 2014). The expectations assessment enhanced communication between the patient and provider during the preoperative setting and provided an opportunity to mutually clarify and modify expectations. This project highlights that although patient and provider recovery expectations may be initially discordant, conversations that impart knowledge and
understanding of recovery after lumbar spine surgery can moderate high expectations and improve patient satisfaction with their surgical experience to ultimately fulfill their expectations.
The pre-test survey identified seven common concepts endorsed by 35% of the sample and associated with high expectations. These concepts are: (1) relief of pain; (2) ability to stand for more than half an hour; (3) regain leg strength; (4) balance; (5) ability to go up and down stairs; (6) remove need to restrict activities; and (7) remove the control their spine had on their lives. These are the target areas of education that may impact future patient satisfaction with outcomes.
Limitations
so results were based solely on a description of ranges, averages, frequencies and trends. Third, only six patients were identified with higher expectations. Administering the
expectation assessment along with surgical education at the initial consultation may provide more significant findings in the future. Fourth, patients may have had difficulty quantifying expectations. For example, some respondent’s spoke of hope. Guidelines for use of the expectations tool, as described by Mancuso et al. (2013) were to have respondents focus on actual treatment expectations versus what they hope will result. This was a limitation of the study as it is difficult to measure how hope impacts expectations and this concept is difficult to quantify or modify with education. Prior research has described the effects of optimism and how its effect may positively impact outcomes regardless of expectations (Carr et al., 2011).
Implications for Practice and Future Work
This project highlights that preoperative counseling and effective communication are essential to improve satisfaction within the veteran population, as it ultimately will impact health outcomes. Although not studied, this expectation assessment may be a useful tool to screen patients who may or may not benefit from surgery. Patients and providers may realize that the patient’s expectations of surgery will not be met so they may decide to cancel or postpone surgery. Cancelling surgery ultimately prevents a poor surgical outcome that otherwise would have led to a dissatisfied patient.
highlights the need for providers to have conversations with their patients before surgery to clarify their goals so that expectations may be modified to more realistic. The project also emphasizes the need for providers and patients to have conversations which is consistent with Peplau’s theory (O’Toole & Well, 1989) as the relationship between provider and patient did influence learning and affect expectation change. This expectations assessment has been shown to be an effective instrument to affect change and can incorporated as a shared decision making model in the neurosurgery clinical setting.
Conclusion
APPENDIX A: SOCIAL DEMOGRAPHICS SURVEY Social Demographics Survey
1. Please identify your gender. ☐ Male
☐ Female
2. What is your age? ______________
3. What is the highest level of education that you have completed? ☐ some high school
☐ high school graduate ☐ some college
☐ college graduate
☐ some post graduate work ☐ post graduate degree
4. How would you classify yourself? ☐ Caucasion
☐ African
☐ African American ☐ Latino
☐ Hispanic ☐ Multiracial ☐ Asian
Social Demographics Survey
5. What is your current marital status? ☐ Married/Long-term Relationship ☐ Single
☐ Divorced ☐ Separated ☐ Widowed
☐ Would rather not say
6. What is your current working status? ☐ Working full time
☐ Working part time ☐ Not working
What prior treatments have your tried? ☐ Physical therapy
☐ Muscle relaxants
☐ Nonsteroidal anti-inflammatory medications ☐ Lumbar epidural steroid injections
☐Other ____________________________________________________ 7. What is your weight?
Social Demographics Survey
To be completed by the nurse practitioner: 1. Surgical Diagnosis
☐ Lumbar Radiculopathy ☐ Lumbar Stenosis
2. Type of Lumbar Spine Surgery
☐ Lumbar Hemi-laminectomy and Discectomy ☐ Lumbar Laminectomy
APPENDIX G: EXPECTATION SURVEY PRE- AND POST- TEST RESULTS AND NET CHANGE
ID Survey Transformed
score ID Survey
Transformed score 1
Pre 94.875
13
Pre 63.75
Post 47.5 Post 62.5
Net Change 47.375 Net Change 1.25
2
Pre 31.25
14
Pre 42.5
Post 30 Post 51.25
Net Change 1.25 Net Change -8.75
3
Pre 32.5
15
Pre 25
Post 35 Post 23.75
Net Change -2.5 Net Change 1.25
4
Pre 100
16
Pre 24.75
Post 48.75 Post 35.75
Net Change 51.25 Net Change -11
5
Pre 61.5
17
Pre 37.5
Post 60 Post 35
Net Change 1.5 Net Change 2.5
6
Pre 66.25
18
Pre 75
Post 66.25 Post 75
Net Change 0 Net Change 0
7
Pre 97.5
19
Pre 60
Post 83.75 Post 61.25
Net Change 13.75 Net Change -1.25
8
Pre 48.75
20
Pre 100
Post 42.5 Post 50
Net Change 6.25 Net Change 50
9
Pre 80
21
Pre 66.25
Post 65.25 Post 70
Net Change 14.75 Net Change -3.75
10
Pre 95
22
Pre 51.25
Post 91.25 Post 56.25
Net Change 3.75 Net Change -5
11
Pre 20
23
Pre 73.75
Post 28.125 Post 75
Net Change -8.125 Net Change -1.25
12
Pre 66.25
Post 71.25
REFERENCES
American Academy of Orthopaedic Surgeons. (2011). Lumbar spinal stenosis: the growing epidemic. Retrieved October 18, 2014, from
https://www.aaos.org/news/aaosnow/may11/clinical10.asp
Athivirham, A., Wali, Z.A., & Yen, D. (2011). Predictive factors influencing clinical outcome with operative management of lumbar spinal stenosis. The Spine Journal, 11(2011), 613-617. doi: 101016/j.spinee.2011.03.008
Braungart, M.M., & Braungart, R.G. (2015). Philosophies and theories for advanced nursing practice. (2nd ed.). Burlington, MA: Jones & Bartlett Learning.
Carr, F.A., Healy, K.M., Villavicencio, A.T., Nelson, E.L., Mason, A., Burneikiene, S., et al. (2011). Effect on clinical outcomes of patient pain expectations and
preoperative mental component summary scores from the 36-item short form health survey following anterior cervical discectomy and fusion. Journal of Neurosurgery Spine, 15(5), 486-490. doi: 10.3171/2011.6.SPINE11114[doi] Collins, E.C., Percy, E.J., Smith, E.R., & Kruschke, J.K. (2011). Integrating advice and
experience: learning and decision making with social and nonsocial cues. Journal of Personality and Social Psychology, 100(6), 967-982. doi: 10.1037/a0022982 Godil, S.S., Parker, S.L, Zuckerman, S.L., Mendenhall, S.K., Devin, C.J., Asher, A.L., &
McGirt, M.J. (2013). Determining the quality and effectiveness of surgical spine care: patient satisfaction is not a valid proxy. The Spine Journal, 13(2013), 1006- 1012. doi: 10.1016/j.spinee.2013.04.008
Grider, C. (1993). Foundations of cognitive theory: a concise review. Retrieved September 22, 2014 from http://files.eric.ed.gov/fulltext/ED372324.pdf Institute of Medicine. (2001). Crossing the chasm: a new health system for the 21st
century. Retrieved October 18, 2014, from
https://www.iom.edu/~/media/Files/Report%20Files/2001/Crossing-the-Quality-Chasm/Quality%20Chasm%202001%20%report%20brief.pdf
Jinn, J.H.; & Sedranski, J. (1989). Effect on secondary data analysis of common imputation methods. Sociological Methodology, 19, 213-241.
Kutley-Lee, A., McHugh, M.D., Sloane, D.M., Cimiotti, J.P., Flynn, L., Neff, D. F., & Aiken, L.H. (2009). Nursing: a key to patient satisfaction. Health Affairs, 28(4), 669-677. doi: 10.1377/hlthaff.28.4.w669
Mancuso, C.A., Cammisa, F.P., Sama, A.A., Hughes, A.P., & Girardi, F.P. (2013). Development of an expectations survey for patients undergoing cervical spine surgery. Spine, 38(9), 718-725. doi: 10.1097/BRS.0b013e31827bf204[doi] Mancuso, C.A., Duculan, R., Stal, M., & Girardi, F.P. (2014). Patients expectations of
cervical spine surgery. Spine, 39(14), 1157-1162. Doi: 10.1097/BRS.0000000000000349[doi]
Mann, K.V. (2011). Theoretical perspectives in medical education: past experience and future possibilities. Medical Education, 45(2011), 60-68. doi: 10.1111/j.1365- 2923.2010.03757.x
McCamant, K.L. (2006). Humanistic nursing, interpersonal relations theory, and the empathy-altruism hypothesis. Nursing Science Quarterly, 19(4), 334-338. doi: 10.1177/0894318406292823
McKillop, A.B., Carroll, L.J., & Battie, M.C. (2014). Depression a prognostic factor of lumbar spinal stenosis: as systematic review. The Spine Journal, 14(2014), 837- 846. doi: 10.1016/j.spinee.2013.09.052
Meakin, R., & Weinman, J. (2002). The ‘medical interview satisfaction scale’ (MISS-21) adapted for British general practice. Family Practice, 19(3), 257-263.
Merritt, M.K., & Procter, N. (2010). Conceptualizing the functional role of the mental health consultation-liaison nurse in multi-morbidity, using peplau’s nursing theory. Contemporary Nurse, 34(2), 158-166. doi: 10.5172/conu.2010.34.2.158 Miller, M.D. (2011). What college teachers should know about memory: a perspective
from cognitive psychology. College Teaching, 59(2011), 117-122. doi: 10.1080/87567555.2011.580636
Mondloch, M.V., Cole, D.C., & Frank, J.W. (2001). Does how you do depend on how you thing you’ll do? A systematic review of the evidence for a relation between patients’ recovery expectations and health outcomes. CMAJ: Canadian Medical Association Journal=Journal De l’Association Medicale Canadienne, 165(2), 174-179
O’Toole, A.W., & Welt, S.R. (1989). Interpersonal theory in nursing practice selected works by Hildegard E. Peplau. (1st ed) New York, NY: Springer Publishing Company, Inc.
Peplau, H. E. (1991). Interpersonal relations in nursing: a conceptual frame of reference for psychodynamic nursing. New York, NY: Springer Publishing
Plummer, M., & Molzahn. (2009). Quality of life in contemporary nursing theory. Nursing Science Quarterly, 22(2), 134-140.
doi: 101177/0894318409332807[doi]
R Core Team. (2015). R: A language and environment for statistical computing. Retrieved from http://www.R-project.org
Radtke, K. (2013). Improving patient satisfaction with nursing communication using bedside shift report. Clinical Nurse Specialist CNS, 27(1), 19-25.
doi: 10.1097/NUR.0b013e3182777011[doi]
Sheldon, L.K., & Lee, E. (2008). Application of a model of social information
processing to nursing theory: how nurses respond to patient. Journal of Advanced Nursing, 64(4), 388-398. doi: 10.1111/j.1365-2648.2008.04795.x
Soroceanu, A., Ching, A., Abdu, W., & McGuire, K. (2012). Relationship between preoperative expectations, satisfaction, and functional outcomes in patients undergoing lumbar and cervical spine surgery: a multicenter study. Spine, 37(2), E103-8. doi: 10.1097/BRS.0b013e3182245c1f[doi]
Statistical Solutions. (2014). Statistical solutions. Retrieved March 15, 2015, from http://www.statsols.com/products/nquery-advisor-nterim/
U.S. Department of Veteran Affairs. (2014). Department of veteran affairs fy 2014-2020 strategic plan. Retrieved December 11, 2014, from
http://www.va.gov/op3/docs/StrategicPlanning/VA2014-2020strategicPlan.PDF Vandermark, L.M. (2006). Awareness of self and expanding consciousness: using
nursing theories to prepare nurse-therapist. Mental Health Nursing, 27, 605-615. doi: 10.1080/01612840600642885
Waljee, J., McGlinn, E.P., Sears, E.D., & Chung, K.C. (2014). Patient expectations and patient reported outcomes in surgery: a systematic review. Surgery, 155(5), 799- 808 doi: 10.1016/j.surg.2013.12.015