Care Workers and Mobility: An Exploratory Analysis of the Effects of Job Changes on Wages
Vanesa Ribas
A thesis submitted to the faculty of the University of North Carolina at Chapel Hill in partial fulfillment of the requirements for the degree of Master of Arts in the Department of Sociology.
Chapel Hill 2006
Approved by: Ted Mouw Catherine Zimmer
ii
ABSTRACT
Vanesa Ribas: Care Workers and Mobility: An Exploratory Analysis of the Effects of Job Changes on Wages
(Under the direction of Ted Mouw)
iii
ACKNOWLEDGEMENTS
iv
TABLE OF CONTENTS
LIST OF TABLES……….………..v-vi Chapter
I. INTRODUCTION AND LITERATURE REVIEW………...1
Income Inequality and the Low-Wage Labor Market………6
Low-Wage Workers and Mobility……….………...13
Nurse Aides, Mobility, and Wages………...22
Who Are Frontline Healthcare Workers?...24
II. DATA, MEASUREMENT, AND ANALYSIS………37
III. RESULTS………..52
Multinomial Logistic Regression………..53
Fixed Effects Models……….59
IV. DISCUSSION………….………...82
V. CONCLUSION………..87
APPENDIX...………...91
v
LIST OF TABLES Table
1. Descriptive statistics for sample and variables………48
2. Occupational transitions……….…..49
3. Sample median wages by tenure as a nurse aide……….49
4. Median wages by occupational transition type………50
5. Mean wage growth by occupational transition type………50
6. Mean and median real wages and mean log wage growth by occupational groups………...51
7. Frequencies and percentages of nurse aide leavers………..53
8. Median wages and beginning nurse aide median wages of nurse aide leavers and stayers………...………53
9. Odds ratios from the regression of nurse aide transitions on selected independent variables……….………..58 10.1. Coefficients for Fixed Effects Regression Models of Log Hourly
Wages on Selected Variables………..68-69 10.2. Coefficients for Fixed Effects Regression Models of Log Hourly
Wages on Selected Variables (women only)……….……..71-72 10.3. Coefficients for Fixed Effects Regression Models of Log Hourly
Wages on Selected Variables (forward-looking)…….………74-75 10.4. Coefficients for Fixed Effects Regression Models of Log Hourly
vi
Race/Ethnicity……….……….70 11.2. Coefficients for Effects of Occupational Group Conditional on
Race/Ethnicity (women only)……...………...73 11.3. Coefficients for Effects of Occupational Group Conditional on
Race/Ethnicity (forward-looking)………...……….76 11.4. Coefficients for Effects of Occupational Group Conditional on
Race/Ethnicity (forward-looking, women only)………...………...79 12.1. Coefficients for Effects of Race/Ethnicity Conditional on Occupational
Group………...70 12.2. Coefficients for Effects of Race/Ethnicity Conditional on Occupational
Group (women only)……….………..73 12.3. Coefficients for Effects of Race/Ethnicity Conditional on Occupational
Group (forward-looking)……….76 12.4. Coefficients for Effects of Race/Ethnicity Conditional on Occupational
Group (forward-looking, women only)………...79 13. Mean wages by race/ethnicity and occupational group………...79
14.Frequencies of blacks and whites by occupation in NA-Professional
CHAPTER I
INTRODUCTION AND LITERATURE REVIEW
2
the findings and questions raised by general labor market analyses has been widely cited in the recent literature.
The transformation of much unpaid caregiving responsibilities into paid carework and its relocation into the market sphere has had ramifications for women at both the supply and demand side of the labor market, by contributing to the availability of women who can work outside the home and by generating growing demand for workers who get paid to provide care, the majority of whom are women. A subset of occupations comprising the frontline workforce of the health care industry present a unique occasion to examine the elaboration of a stratified system, one that involves both marked segregation by sex and a racialized structure, and is evolving in the context of vast expansion in demand and shortages in labor. Its proximity to vulnerable populations held dearly (if often at some distance) and to costly health care concerns for government and individuals and families alike has generated policy attention not just regarding the definition and measurement of “quality care” but also, yet often derivatively, regarding the status of the people employed to do this work.
3
4
requirements or through lack of formal recognition and reward of skills that are instead presumed to be inherent and unremarkable qualities of the workers who perform these jobs. In fact, status struggles in the healthcare field, as in others, often hinge on shifting and contested definitions of skill, as well as the determination of who is allowed to possess them and who is not, and what value is to be assigned to those skills.
5
other jobs, either within or outside of these occupations, that may also serve to draw workers. The literature on mobility of low-wage workers suggests that the relationship between job turnover and wages is bidirectional and that job changing affects wages in differing ways, depending especially on the timing of the move in relation to the individual’s full work history and the industries and firms they end up at. Not surprisingly, workers do better when they move from lower-wage industries into higher-wage industries. Yet, this seemingly uncontroversial finding illustrates the tension between policy literature that focuses on retention of workers in such notoriously low-wage industries as long-term care and labor market research that gives a picture of the character and consequences of low-wage workers’ job mobility. Because the latter has infrequently applied analysis of mobility at the occupational-level, we know little about how specific types of low-wage workers behave in the labor market, the linkages between particular industries or occupations, and the relationship of changes to wages over time, as well as how these trends might vary for different demographic groups.
6
respondents for four years and includes occupation, industry, wage, and other work-related and demographic information.
Income Inequality and the Low-Wage Labor Market
Researchers have studied the rise in income inequality in the U.S. from the early 1970s through the 1990s - a trend that has been accompanied by the failure of poverty declines in periods of expansion to counterbalance increases during recessions (Gottschalk 1997) - in order to uncover the factors responsible for changes in the employment situation of workers and in their material well-being. While some research focuses on the changing characteristics of jobs, such as their stability, wage growth patterns, demand for skills, and opportunities for career advancement, other research situates these changes in the structural transformations of the U.S. economic geography. Moreover, patterns of mobility, if these have changed for workers detrimentally since the 1960s, can be seen to compound the significance of observed trends in the income distribution.
7
inequality for men and women, which represented 50 and 23 percent of the total increase in inequality respectively, might be accounted for by a rise in job instability. What is especially interesting is that this growth in inequality occurred during periods when unemployment rates were both rising and declining. Bernhardt et al (2001) show that job instability has risen across all educational levels, strongly affecting workers in their peak earning years (thirties), and that one-fourth of this increase is accounted for by the shift to services, where some particularly unstable and low-wage industries are concentrated, findings that are especially troubling given that the “penalties” for instability are now more pronounced (Bernhardt et al 2001, 175-176). Tilly and Tilly (1998) cite Rose (1994) who suggests that the greater likelihood of both men and women to experience downward mobility in hourly wages in the 1980s compared to the 1970s is due to job instability, while Chauvin (1994) and Marcotte (1994) show that the returns to job stability decreased significantly during the 1980s as well. In their study of nonstandard employment, Kalleberg et al (2000) find that these kinds of employment relationships are more likely to be associated with “bad” job characteristics because employment security is less likely in these jobs.
8
such as interaction with customers and ability to perform team-work, may have given women a “comparative advantage” vis-à-vis men “due to gender-specific socialization processes” and the fact that they have long held service jobs (p. 47). But if job instability, which has affected men more than twice as severely as women, is an important contributor to the observed trends, then this optimistic view of the “comparative advantage” of jobs traditionally held by women, and the features that lead them to be female-dominated, is not so certain. Indeed, some caution that while the stated importance of “soft” skills in the labor market has become more prevalent, employers’ overemphasis of these requisites might euphemistically connote jobs that are not good (Osterman 2001).
9
to pursue) specializations and occupational redefinitions that better conform to gender expectations. If this is a plausible mechanism, it still might apply inconsistently to different groups of men (Evans 1997). Also, England et al find little evidence that female-dominated occupations offer women the “advantage” of lower returns to experience that would suggest lower penalties for periods of nonemployment – the only exception is white women, but low returns to experience and penalties for periods of nonemployment cannot be separated out in the data. In addition, they find that, controlling for human capital characteristics, female-dominated jobs offer lower starting wages than their male counterparts. Their findings, by and large, refute the claims of neoclassical theories of occupational segregation, which advance the argument that women self-select into occupations that offer higher starting wages and lower returns to experience (on the premise that this conveys less severe penalties for periods of nonemployment) (England et al 1988, 552-553). Instead, their findings bolster the claim that wage discrimination against female-typed occupations has remained an obstinate feature of the segmented labor market.
10
are themselves fraught with ambiguity and contention – some researchers have documented trends that run counter to the skill-biased technology explanation (DiPrete 2005; Card & DiNardo 2002).
First, the college premium was declining during the 1970s at the same time that inequality was rising, and in the subsequent decade and a half, gains in the college premium were relative, in large measure the result of the drastic deterioration in the wages of high school graduates (5% increase in wages of college graduates versus 20% decrease in wages of high school graduates) (Gottschalk 1997). Based on their study of two cohorts of young men from the National Longitudinal Surveys, Bernhardt et al (2001) found that the “education story” accounts for only one-third of the total increase in inequality and that 65% of college graduates experienced lower wage gains in the economy of the 1980s and 1990s than they could have expected to receive in the 1960s and 1970s. Further, they found that workers with some college training (i.e. associate’s degrees, certificates and occupation-specific training) experienced strong wage declines in the 1980s and 1990s, faring only slightly better than high school graduates (Bernhardt et al, 175-176).
11
contradictory effects on the relative skills of workers (Bernhardt, 7-8; and see Fernandez 2001 on the effects of firms’ human resources interventions in the application of technological change). Perhaps skill-bias arguments’ biggest credibility problem is their claim that technological change has been powerful enough to generate growing income polarization after decades of the contrary trend despite the fact that “[p]roductivity has stagnated over the period that technological change is supposed to have led to a skill-intensive workplace” (Morris & Western 1999, p. 635).
12
that are a function of markets (Myles and Quadagno 2002, p. 41). A decontextualized view misses the likely, and potentially weighty, significance of cultural expectations and levels of tolerance for inequality and attitudes towards redistributive policies that vary across settings (Bullock; McCall 2005; DiPrete 2005). Additionally, Osterman (2001) points out the conceptual and practical complications that arise in defining the low-wage/low-skill labor market, since some occupational categories in typically low-wage industries may contain bifurcated earnings groups, especially in niche markets, and some high-wage industries include significant numbers of low-wage jobs.
13
for qualitative improvements, and efficiency increases may even be in conflict. In a field such as health care, productivity (at least through rationalization) as chief priority is a source of much friction (Stone 2003, p. 216) and cannot unequivocally be the basis for pay determinations.
Low-Wage Workers and Mobility
14
counterparts, and institutional factors such as welfare state resource redistribution appear as compensating conditions (DiPrete 2005).
In the broad sense, economic mobility – the rate of mobility out of designated earnings categories – is distinct from, and not a causal factor in, the distribution of income in a given country (Gottschalk 1997). But job mobility and earnings are closely yet intricately linked. In a study of the 1983-1993 panels of the Survey of Income and Program Participation, Gottschalk (2001) found that men and women reap greater wage growth when moving directly into a new job than the yearly wage growth experienced with the same employer, with men enjoying higher returns, while the penalty for periods of intervening nonemployment are more severe for women than men. Within-job wage growth is especially low for women with less than a high school education, 1 percent compared to 7.5 percent for women college graduates. An interesting finding is the immense variability of the wage growth distribution within educational groups, and that the median real change in wages for each group is negative. Almost two-thirds of jobs held by workers with less than a high school education had negative real wage growth. (Gottschalk 2001)
15
non-family related quits and family-related quits – and two forms of search behavior, men and women experience comparable returns when the same type of mobility and search behavior are assumed. However, women seem much more likely than men to change jobs for family-related reasons, and this type of mobility is associated with lower returns to wage growth. Men, on the other hand, appear to perform employed job search more than women, and this search behavior is associated with higher returns to wage growth. Thus, the authors find that the highest returns go to those who claimed to have searched for another job while employed and quit for a non-family related reason. Women’s wages are lower, Keith and McWilliams argue, because they are more likely than men to exhibit the opposite behaviors. However, Keith and McWilliams do not control for occupational characteristics, and so their findings on the returns to wage growth of different types of voluntary mobility and job search behavior might be seriously compromised by the introduction of these factors. Moreover, because the form of job search is not specified in the data, there is little information about what constitutes “looking for other work” and whether different search methods, and different frequencies with which men and women draw on these, might yield uneven returns.
16
that the rate of turnover decreases with age and with job tenure (Andersson et al 2005). The potential advantages to be gained by low-wage workers through job mobility are clear, since the scant opportunities for income growth or advancement in many low-wage jobs are well-understood. Andersson et al (2005) undertake an analysis of the mobility processes and contexts that lead to better and worse earnings outcomes for workers with low earnings at the outset, using the U.S. Census Bureau’s Longitudinal Employer-Household Dynamics data for the 1990s on five states that includes data on both workers and firms.
17
“high-quality” jobs, which is geographically determined at least to some degree. Nevertheless, Andersson et al’s discussion of the gender-industry intersection is insufficiently developed and they maintain a strong assumption about white female preferences for part-time work in explaining their greater likelihood to be found in firms with very low wage premia. Moreover, because they only use available quarterly earnings data, some of the transitions to higher earnings are likely explained by part-time to full-time transitions. The authors suggest that their findings give some support to welfare reform-related work-first policies, when others have pointed out that there may in fact be greater structuring of individuals’ career histories than previously thought (through a sort of clustering of occupational groupings that co-occur in the work histories of individuals), and that occupation-specific human capital might affect “productivity and wages in a certain occupation or subset of occupations, while having little effect on overall productivity” (Mouw and Kalleberg 2006 draft). Work-first policies rarely take into account these path-dependent processes, and a some-work-experience-is-better-than-no-work-experience hypothesis does not help shed light on how particular sets of workers’ opportunities for advancement are structured by their labor market context and by their occupational trajectories. In the end, Andersson et al propose that industry- and labor market-specific analyses are needed to assess the real-world implications of their results.
18
data, they find that more workers in all wage groups begin working in low-wage sector jobs. More importantly, long-term wage growth has declined for most workers and the authors attribute much of this to a rise in job instability that most strongly affects low-wage workers. In turn, the 14 percent rise in job instability across all educational levels in the 1980s cohort is to a considerable extent due to the shift to services, in which low-wage “unstable” industries thrive. As mentioned earlier, the deterioration in chances of upward mobility extends to college graduates, who fare notably worse in the new economy than before, but is especially evident for workers without a college degree for whom “the low wage career trap has expanded its grip” (Bernhardt et al p. 176). The authors are critical of the skills-biased argument, noting that workers with some college, diplomas, and certificates fared worse in the labor market of the 1980s than of the 1960s. Yet, unanswered questions remain since Bernhardt et al only look at cohorts of white men. Even though they purport to seek an understanding of low-wage workers and their “careers” in the “work-first” welfare reform climate, the inability to apply the analysis to women and across racial/ethnic groups is an unfortunate limitation to their study. Still, they cite this limitation to suggest that the wage trends and correlates they observe might be more pronounced for other groups. But whether these patterns vary across groups only in magnitude is an empirical question.
19
and Kalleberg), and the embattled question of whether to define it as a dead-end job. On this last point there is much ambivalence, as some researchers see few, if any, promising prospects for low-wage workers in the healthcare industry while others insist on the potential for crafting channels for growth and mobility for these workers. These contrasting outlooks pit the current status of these workers as against one possible, and hopeful, future one. The authors of Moving Up, Moving On provide a detailed analysis of the health services industry (and the temporary help services) because it is “both an important employer of low-wage workers and one of the few industries that successfully transition workers out of low-wage work” (Andersson 2005, p. 106). Andersson and others find broad variation in the percent of low-wage workers hired by firms in the industry. Only a small fraction of firms account for a significant percent of the escapes from low-wage earnings observed in their data. For instance, they cite that in Florida, only 6,000 health services firms out of 22,326 hired any low-wage workers, and that out of these, 20 firms accounted for 10 percent of low earnings escapes. They find that firm size (larger), (low) turnover, and past hiring and escape rates of low-wage workers are positively associated with future escape rates for low earners, and argue that some firms choose a “high road” to production while others – apparently most - do not.
20
21
22
Nurse Aides, Mobility, and Wages
A report by the Institute on Aging, commissioned by the North Carolina Department of Health and Human Services, holds some insights regarding the labor market context of nurse aides (cite IOA DOL report). Linking data from the Unemployment Insurance tax record and the North Carolina Nurse Aide Registry, information on wages and industry was compiled and analyzed for individuals who are currently registered as nurse aides, individuals who have been registered in the past but are currently inactive as nurse aides, and individuals who have been continuously certified as nurse aides for ten years.
23
services sector altogether, suggesting high levels of mobility across industries in a relatively short period of time, since the registry spans two-year certification periods. Individuals who were continuously registered as nurse aides from 1994 to 2004 and working in either long-term care or non-long-term care health services experienced a general wage trend that was positive (except home health/home care), albeit modest (no sector saw more than $5,000 increase in median wages over the ten-year period), until 2000 when wages began to stagnate for workers in skilled nursing and declining for workers in residential care facilities. Median real wages of workers in all health services industries have declined since 2003, and the wage profile of continuously registered home health/home care workers is especially dismal. These wage trends are especially troubling given that the unemployment rate in North Carolina, which had risen dramatically between 2000 and 2002, has been falling since 2003 and in 2004 was 5.5%, the same as the national unemployment rate (http://www.bls.gov/cps/prev_yrs.htm retrieved 9/13/06). The limitations of this data stem from the fact that individuals are not uniquely identified in the data and thus cannot be tracked over time, nor can the characteristics of workers be distinguished and taken into account.
24
to be a significant incidence of employment in other low-wage industries, such as wholesale and retail trade. Whether individuals abandon the occupation in definite terms, or whether there is mobility into and out of the occupation over time is not known. The data show, however, that individuals who are no longer active as nurse aides have higher median wages than those who are active, and that individuals who are career nurse aides enjoy some wage growth over time (except for home health/home care), but this has been modest and the positive trend appears more uncertain in recent years.
Who Are Frontline Healthcare Workers?
25
women” (Nakano Glenn 1996, p. 140). The Omnibus Budget Reconciliation Act of 1987 introduced certification requirements for nursing aides working in Medicaid-approved skilled nursing facilities, and starting in 1990 required competency exams and/or training for home health aides working at Medicare-certified home health agencies. That is, while workers hired in nursing care facilities must complete 75 hours of training and pass a competency exam within four months in order to receive certification, federal guidelines mandate that home health aides pass a 12-area competency test and may receive a recommended 75 hours of training that meets the standards of the Center for Medicare and Medicaid Services. There are no federal guidelines for personal and home care aides, and some states do not require any formal training. Although non-Medicare home care agencies are not subject to federal certification requirements, comparable industry standards have been established, and The National Association for Home Care offers voluntary national certification for home health aides as well as personal and home care aides (Bureau of Labor Statistics).
26
aides and personal care aides) vary in terms of the characteristics of workers as well as in the typical level of remuneration offered. Demographic differences between these occupations involve the average age, racial composition, sex, income, and educational attainment of workers, as well as their level of immigrant labor, type of employment, labor participation rates, and workforce size.
27
ethnic composition varies geographically (Stone & Weiner 2001), there are proportionally more Latina(o)s and non-U.S. citizens in the home care industry (Montgomery et al 2005). Stone and Weiner (2001) estimate that 35% of nurse aides are Black. Montgomery et al (2005) find some heterogeneity in the level of education attainment among workers in these occupations. While a majority of workers in all three occupations have completed high school, a significant minority has not – 20% of hospital aides and one third of nursing home aides and home care aides have not finished high school. Furthermore, 30% of home care aides have some college education, suggesting variation in the pools of workers drawn into this occupation. Although a majority of workers in all three groups are employed in the for-profit sector, hospital workers were more likely to be employed by a government agency or nonprofit than either home care aides or nursing home aides. In addition, a much higher percentage of home care aides (16.8%) were self-employed. In terms of their rates of labor force participation, half of all hospital aides and nursing home aides worked full-time, year round, while only 34.3% of home care aides did so.
28
hierarchy – hospital aides at the “top” and home care aides at the bottom – still holds. This is because the sample identified in their study includes a much higher percentage of self-employed home care aides (some of whom may be owners of the company as the authors acknowledge) and temporary or part-time workers, whose wages may represent total compensation in lieu of employment benefits (Montgomery et all 2005).
29
employment services, $8.91 for those in specialized services such as mental retardation and substance abuse facilities, $8.46 for workers in home health care services, $8.36 for those in community care facilities for the elderly, and $8.20 for those in individual and family services. The bottom 10% of all workers in home health aide earned less than $6.56 per hour. It is important to note, however, that variability in earnings estimated by different studies reflect the inconsistency of samples drawn due to a lack of consensus on which occupations to include in definitions of the workforce (Montgomery et al 2005). Studies have also focused on the widespread lack of health care coverage for these workers, estimating that one third of nursing aides and one-fourth of home health aides have no insurance (Center on Wisconsin Strategy 2003), while others invert these figures (Mathematica 2005). In 1998, the Bureau of Labor Statistics estimated that personal and home care assistance would be the fourth-fastest growing occupation by 2006, projecting an 84.7% expected growth rate. In addition, the number of home health aides was expected to increase by 74.6% and the number of nursing aides by 25.4%. Thus, in the span of a decade, 325,000 more nursing aide jobs and 433,000 more personal care and home health aide jobs were anticipated (cited in Stone and Weiner 2001). Updated projections by the BLS for 2002 through 2012 are that nursing, psychiatric, and home health aide jobs, as well as personal and home care aide jobs will grow much faster than the average for all occupations.
30
31
32 and Wiener 2001).
33
supervisory pressures.” His claims that the “hospital and educational services industry may have more in common with the regular activities of many welfare recipients” and that these industries “may have less pressure for dealing with customers” are troubling at best.
34
exaggerated emphasis on the consequences of certification and training requirements. Thus, if more certified nurse aides in North Carolina are inactive than active, and little more than half of Florida’s nurse aides are employed anywhere in the health care industry, where have these workers moved on to?
35
In a less policy-prescriptive vein, there is broad agreement that the occupations of frontline workers are perceived as low-status jobs, even referred to as “butt-wiping” (Stone and Weiner 2001). The challenge of confronting this perception in an effort to “upgrade” the occupations is made more formidable by the fact that the negative views reflect not only (mis)perceptions about the jobs themselves, but a disparaging view of the elderly in American society. Surely, the fact that these jobs are so poorly regarded in every “measurable” way does not sit well with the fact that they are physically and emotionally demanding. Yet, a supply of cheap labor, however short-lasting, “has made it possible for employers to expand many businesses that would have been unprofitable at a higher prevailing wage” (Burtless 2000, p. 8). Efforts to enhance the image of these occupations in light of a chronic turnover problem and expanding demand are focusing on opportunities for specialization given hospital restructuring and diversification, advancements in the treatment of injuries and disease, and an aging population (Pindus et al 1995), in addition to broader campaigns to redefine perceptions of frontline healthcare work.
36
CHAPTER II
DATA, MEASUREMENT, AND ANALYSIS
38
and immigrant populations than other surveys (McKernan and Ratcliffe 2002, Urban Institute for U.S. DHHS), and its unique identification of respondents’ employers. SIPP weaknesses relate to the attrition bias resulting from its longitudinal character, which is of particular concern given that poorer persons might be more likely to leave the sample before the panel ends (Citro and Michael 1995, p. 391). Additionally, for the purposes of this analysis an even longer time span would improve our understanding of the dynamics of mobility in the low-wage labor market.
Multinomial Logistic Regression Analysis
39
occupational transitions, that is, what characteristics are associated with a greater or lesser likelihood of leaving a job as a nurse aide for a nurse aide job with a different employer or for another occupation altogether. Only 5.4 percent of the individuals in this sample had twelve waves of data and the median was six waves, or two years. Eight percent of respondents were nurse aides throughout the four years of the survey, while the median was three waves, or one year.
Fixed Effects Models
For the fixed effects models I exclude only individuals who had just one survey observation and Native Americans. This yields a sample of 1,715 individuals consisting of 16,370 observations representing person-waves. After deleting cases with missing data, the full analytic sample is made up of 1,701 individuals totaling 11,744 cases (4,626 cases had missing data on tenure or wages but this eliminated only 14 individuals who had no values for these variables). I also include three supplementary analyses in the results section but concentrate on the original fixed effects models in my discussion and conclusion. The first supplementary analysis restricts the original sample to women (1,485 women, 10,143 cases); the second runs a model that is forward-looking, that is, includes cases for individuals beginning when they are observed working as nurse aides and excludes observations prior to this point (1,611 individuals and 9,234 cases); and the third limits the forward-looking model to women (1,404 women and 7,982 cases).
40 Dependent Variables
Multinomial Logistic Regression
In the first part of the analysis, I restrict observations to those in which an individual is found working as a nurse aide with a specific employer and their subsequent transition. In other words, what are the immediate patterns of mobility for individuals when they are observed working as nurse aides? This is a truncated analysis, but it serves the purpose of illustrating the characteristics associated with the immediate occupational and job mobility outcomes of nurse aide turnover. The dependent variable is a multinomial categorical variable with ten outcomes representing specific occupational transition types: remain a nurse aide with the same employer, remain a nurse aide but change employer, move to another healthcare occupation (excluding registered nurses), move to a production, repair, or construction occupation, move to a personal care and services occupation, move to a sales or food preparation and services occupation, move to an office or administrative support occupation, move to a “professional” occupation, move to an “other” category, and move to “not employed.” Registered nurses are included in the professional group. The “other” category is not of interest here. The reference category is to remain a nurse aide with the same employer. A list of the occupational groups and the individual occupations included in each is available in the appendix.
Fixed Effects Models
41
wages. Coefficients can be interpreted approximately as a percentage difference in wages. In each section, a number of independent and control variables will be included in the regression analyses in order to illuminate the effects of different types of occupational mobility on workers’ wages relative to their nurse aide wages.
Independent Variables
Multinomial Logistic Regression
42
high school or less is the reference category for the third model. Using the FIPS state codes, I created a variable for region with four categories: Northeast, Midwest, South, and West. South is the reference category. In addition to the demographic variables described above, I will also include work-specific variables. I include within-occupation tenure with an employer (during the survey). Also, I control for prior wages, using the log of wages. I control for hours worked with a dummy variable coded one if part-time (less than 35 hours), with full-time being the reference category. Finally, I include a dummy variable for whether the job is in the long-term care industry long, coded one if the industry is SIC codes 832, 840, or 870.
Fixed Effects Models
In the fixed effects models, I include an eight-category occupational group variable (nurse aide, other healthcare, production, repair and construction, personal care and services, sales and food preparation and services, office and administrative support, professional, and other. Three tenure and experience variables will be included: within-occupation tenure with an employer, occupational experience, and all employment experience. I include a variable for total number of within-occupation employer changes. Also, I include interaction terms for race/ethnicity by occupational group, and I control for level of education.
Analysis
43
In the first part of this analysis, I will examine occupational transitions indicating specific occupational transition types as the dependent variable. I will use multinomial logistic regression to examine the relationship between a number of demographic and work-related variables and patterns of job and occupational mobility among nurse aides. All independent variables included in the analysis are lagged, except of course race/ethnicity, sex, region, and age.
Fixed Effects Models
44
transitions are the key variables of interest. Fixed effects models control for unobserved heterogeneity (individual-level stable characteristics) by subtracting out the person-level means. These analyses will attempt to show the importance of charting occupation-specific mobility patterns in understanding the wage trajectories of low wage workers.
Hypotheses
H1: Individuals are more likely to leave the nurse aide occupation than to remain
nurse aides.
H2: Individuals who leave the nurse aide occupation are more likely to earn higher
wages than those who stay.
45
to the premises of that report which found that “inactive” nurse aides (formerly active in the registry, excluding individuals who become registered nurses) earn higher wages than active nurse aides. Hypotheses 1 and 2 are principally descriptive in nature.
H3: I expect that racial/ethnic minorities working as nurse aides are less likely than
whites to transition into professional or white-collar occupations and more likely than whites to transition into food service & preparation and retail, and personal care and services occupations.
Hypothesis 3 tests whether minority nurse aides are more likely than whites to make certain kinds of transitions that may impact their wage outlook.
H4: Working in food service & preparation and retail, and personal care and services
occupations results in lower wages than working as a nurse aide.
46
H5: Working in professional or white-collar occupations or other health care
occupations results in higher wages than working as a nurse aide.
Hypothesis 5 is intended to capture the wage effects of professional or white collar work or work in better paid health care occupations; aside from these groups, I do not have a clear hypothesis of which transitions result in higher wages relative to nurse aide wages, except that confirmation of Hypothesis 4 should demonstrate that food service & preparation and retail, and personal care and services occupations do not.
H6: Total number of within-occupation employer changes has a positive effect on
wages.
Hypothesis 6 is intended to test whether individuals in this sample of low-wage workers attain better wages by changing employers within an occupation. Confirmation of this hypothesis might suggest (though not demonstrate since I do not directly test the effect of total number of employer changes conditional on being a nurse aide) that from the perspective of nurse aides, turnover can be a beneficial and strategic move.
47
H7b: Total work experience has a positive effect on wages.
H7c: Occupational experience has a negative or nonsignificant effect on wages.
Hypothesis 7a, 7b, and 7c control for the effect of different kinds of work experience
on wages. Tenure should have a positive effect on wages because employers may have wage scales that depend on tenure, or because workers may move into better occupations without changing employers. In general, more work experience can be expected to lead to higher wages, while occupational experience may not given the kinds of low-wage jobs these individuals often work in. For example, it is doubtful whether employers in retail reward workers with more experience as cashiers.
I do not have specific directional hypotheses with regards to the other variables included in the multinomial logistic regression model aside from race/ethnicity (H3).
48
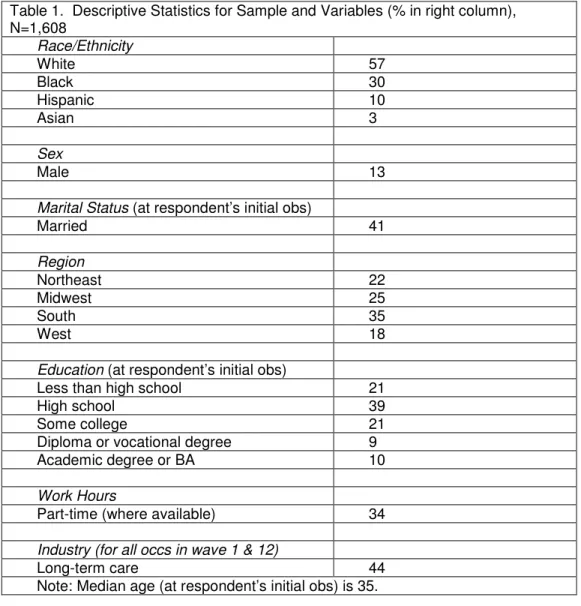
Table 1. Descriptive Statistics for Sample and Variables (% in right column), N=1,608
Race/Ethnicity
White 57
Black 30
Hispanic 10
Asian 3
Sex
Male 13
Marital Status (at respondent’s initial obs)
Married 41
Region
Northeast 22
Midwest 25
South 35
West 18
Education (at respondent’s initial obs)
Less than high school 21
High school 39
Some college 21
Diploma or vocational degree 9
Academic degree or BA 10
Work Hours
Part-time (where available) 34
Industry (for all occs in wave 1 & 12)
Long-term care 44
49
Table 2. Occupational Transitions, N=6,063
Transition Type Frequency Percent Individuals
NA-NA w/ same employer
4,621 76.22 1,166
NA-NA w/ different employer
368 6.07
other healthcare 67 1.11 65
production, repair, construction
61 1.01 61
personal care/services
107 1.76 102
sales & food 107 1.76 107
office admin 94 1.55 92
Professional 126 2.08 124
Other 46 .76 44
not employed 466 7.69 446
Total 6,063 100.00
Note: These figures do not include observations subsequent to transitions out of being a nurse aide with the same employer. These figures pertain to the truncated sample – when individuals are observed as nurse aides and their immediate transitions.
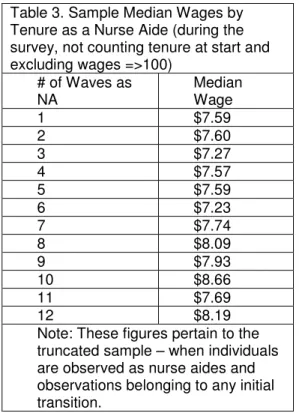
Table 3. Sample Median Wages by Tenure as a Nurse Aide (during the survey, not counting tenure at start and excluding wages =>100)
# of Waves as NA
Median Wage
1 $7.59
2 $7.60
3 $7.27
4 $7.57
5 $7.59
6 $7.23
7 $7.74
8 $8.09
9 $7.93
10 $8.66
11 $7.69
12 $8.19
50
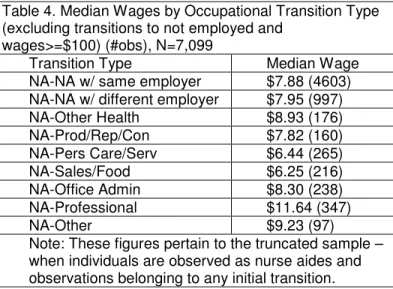
Table 4. Median Wages by Occupational Transition Type (excluding transitions to not employed and
wages>=$100) (#obs), N=7,099
Transition Type Median Wage
NA-NA w/ same employer $7.88 (4603) NA-NA w/ different employer $7.95 (997) NA-Other Health $8.93 (176) NA-Prod/Rep/Con $7.82 (160) NA-Pers Care/Serv $6.44 (265)
NA-Sales/Food $6.25 (216)
NA-Office Admin $8.30 (238) NA-Professional $11.64 (347)
NA-Other $9.23 (97)
Note: These figures pertain to the truncated sample – when individuals are observed as nurse aides and observations belonging to any initial transition.
Table 5. Mean Wage Growth by Occupational Transition Type (excluding transitions to “not employed” and wages over $100.00) , N=7,056
Transition Type Mean Wage Growth (s.d., obs)
NA-NA w/ same employer .018 (3.16, 4588) NA-NA w/ different employer .150 (3.62, 991) NA-Other Health .356 (3.35, 176) NA-Prod/Rep/Con .449 (2.73, 158) NA-Pers Care/Serv -.171 (5.74, 263) NA-Sales/Food .397 (5.62, 209) NA-Office Admin .317 (3.89, 235) NA-Professional 1.035 (6.33, 342)
NA-Other .374 (11.71, 94)
51
Occupational Groups Mean Wages Median Wages
Nurse Aides 9.10 (6832) 7.70
Other Health Care 10.55 (445) 9.65
Prod, Cons, Rep 8.55 (565) 7.40
Pers Care/Services 7.27 (930) 6.20
Sales & Food 7.24 (899) 6.00
Office/Admin 8.86 (691) 7.81
Professional 14.17 (1083) 12.49
Other 11.06 (299) 7.69
TOTAL 9.35 (11744) 7.63
.034 (371) .032 (450)
.032 (240) 0.020 (9556) -.005 (729) .016 (651) .035 (577) .067 (919)
Mean ln Wage Growth .011 (5619)
CHAPTER III RESULTS
Hypotheses 1 and 2 posited that individuals are more likely to leave the nurse aide occupation than to remain nurse aides and that those who leave the nurse aide occupation are more likely to earn higher wages than those who stay. Table 7 presents the frequencies and percentages of leavers and Table 8 presents the median wages of nurse aide leavers and stayers, as well as their beginning NA wages. When individuals who ever became unemployed are included, over 61 percent of nurse aides leave that occupation and the figure is still close to 47 percent when these individuals are excluded. The corresponding figures for nurse aides who ever left their job (as a nurse aide with a specific employer) are 70 percent and 58.5 percent. Though these figures do not conclusively confirm the findings cited earlier for North Carolina and Florida, they are certainly indicative of substantial mobility both out of this frontline healthcare occupation and within it as well.
53
are excluded, both the median wage of leavers and their beginning nurse aide wages are lower than the corresponding wages of individuals who never leave nurse aide work.
Table 7. Frequencies and Percentages of Nurse Aide Leavers Frequenc
ies
Percent
Ever Left NA Occupation 988 61.4%
Ever Left NA Job 1,126 70.0%
Ever Left NA Occupation Excluding Transitions to “Not Employed”
542 46.6%
Ever Left NA Job Excluding Transitions to “Not Employed”
680 58.5%
Note: These figures pertain to the truncated sample – when individuals are observed as nurse aides (N=1,608).
Table 8. Median Wages and Beginning Nurse Aide Median Wages of Nurse Aide Leavers and Stayers
Median Wage Beginning NA Median Wage Ever Left NA Occupation $8.10 $7.08 Never Left NA
Occupation
$8.06 $7.56
Ever Left NA Occupation Excluding Registered Nurses
$7.79 $6.92
Ever Left NA Occupation Excluding Transitions to “Not Employed”
$8.11 $7.35
Note: These figures pertain to the truncated sample – when individuals are observed as nurse aides and observations belonging to any initial transition.
Multinomial Logistic Regression of Transitions on Selected Independent Variables
54
Recall that this analysis uses the truncated sample – when individuals are observed working as nurse aides and any observations belonging to a first transition if the individual leaves their nurse aide job. All of the independent variables included in the model were lagged. Results are listed in Table 9. Blacks are 56 percent more likely than whites to change employers while remaining nurse aides than to remain nurse aides with the same employer. Regional location is also significantly related to these kinds of transitions, with those living in the West being 47 percent more likely than those living in the South to change employers while continuing to work as nurse aides. Age is inversely associated with employer-changing as opposed to continuing to work as a nurse aide with the same employer. Nurse aides employed in the long-term care industry are 44 percent more likely than non-LTC workers to change employers while continuing to work as nurse aides than to stay with same employer. Tenure is inversely related to changing employers while interestingly, prior wages (logged) is not a significant predictor of nurse aide transitions to different employers. Transitions to other healthcare occupations (excluding registered nurse, which was included in the professional category) are only significantly related to education and age. Nurse aides who have obtained a diploma or vocational degree are almost three times as likely as those who have only completed high school to move into other healthcare occupations than to remain nurse aides with the same employer. Again, age is inversely related to these kinds of transitions.
55
aides (or orderlies or attendants) with the same employer. Tenure is inversely related to transitions into production, repair, and construction occupations.
Transitions into personal care and services occupations are significantly associated with marital status, experience, and prior wages. Married nurse aides are 63 percent as likely as unmarried nurse aides to move into personal care and services occupations than to continue working as nurse aides with the same employer. Tenure and prior wages are both negatively related to the likelihood of transitioning into these kinds of occupations.
Regional location, age, tenure, and prior wages are significantly associated with transitions into sales and food service/preparation occupations. Those living in the Northeast are less than one third as likely as those living in the South to move into sales and food service/preparation occupations. In addition, tenure and prior wages are inversely related to transitions of this sort.
Moving into an office/administrative support occupation is significantly related to education and age. Those whose level of education is less than high school are only about 25 percent as likely as those who have obtained a high school diploma to make these kinds of transitions. Age is negatively associates with moving into office/administrative support occupations.
56
employer. This finding holds true even when registered nurses are excluded. Individuals with higher levels of education – those who have a diploma or vocational degree or who possess an academic or bachelor’s degree – are over three and six times as likely respectively as those who have a high school diploma to move into professional occupations. Those living in the West are 75 percent more likely than those living in the South to move into professional occupations. Nurse aides who work part-time are over 50 percent as likely as those working full-time to make these kinds of transitions.
Although it is not of particular interest in this analysis, transitions to other (unclassified) occupations are significantly related to sex, with males being over four times as likely as females to move into these occupations. Finally, transitions into the “Not Employed” category are significantly related to education, age, part-time status, experience, and prior wages. Nurse aides with a less than high school level of education are 52 percent more likely than those with a high school diploma to become “not employed” than to remain nurse aides with the same employer. Age is inversely related to the likelihood of making this transition. Nurse aides who work part-time are 71 percent more likely than those who work full-time to become “not employed.” Additionally, tenure and prior wages are both negatively related to the likelihood of transitioning to “not employed.”
57
58
Race/Ethnicity
NA w/ diff emp
Other Healthcare
Prod, Rep, Con
Pers
Care/Serv Sales & Food Office Admin Professional Other Not Employed Black 1.56** (.199) 0.67 (.218) 1.35 (.429) 0.81 (.204) 0.84 (.211) 0.74 (.196) 2.15** (.480) 0.56 (.267) 1.20 (.140) Hispanic 0.98 (.200) 0.81 (.396) 1.43 (.605) 0.65 (.254) 0.59 (.245) 0.57 (.274) 1.10 (.418) 0.68 (.380) 0.82 (.148) Asian 1.66 (.485) 1.11 (.725) 1.41 (1.09) 2.12 (.909) 0.37 (.387) 0.41 (.426) 0.51 (.277) 0.48 (.501) 0.75 (.276) Sex (male) 1.34 (.224) 0.63 (.280) 4.50***(1.37) 0.82 (.278) 1.65 (.478) 0.67 (.260) 1.21 (.314) 4.86***(1.78) 1.18 (.191) Education
Less HS 1.10 (.178) 0.70 (.357) 1.06 (.410) 1.55 (.451) 1.44 (.415) 0.27* (.145) 0.53 (.266) 1.00 (.535) 1.52** (.202) Some Coll 1.09 (.158) 1.53 (.528) 0.75 (.269) 1.57 (.421) 1.05 (.292) 1.23 (.325) 1.58 (.463) 1.13 (.460) 0.84 (.119) Dip/Voc Deg 1.09 (.209) 2.99** (1.03) 0.56 (.306) 1.17 (.436) 0.71 (.301) 1.26 (.421) 3.30***(.991) 0.69 (.448) 0.87 (.165) Aca Deg/BA 0.64 (.163) 1.92 (.833) 0.47 (.268) 1.84 (.655) 1.48 (.545) 1.09 (.451) 6.42***(1.82) 0.42 (.279) 0.80 (.173) Region
Northeast 1.07 (.164) 0.99 (.340) 0.43 (.207) 1.36 (.393) 0.31** (.117) 0.72 (.226) 0.51* (.158) .91 (.472) 0.86 (.120) Midwest 1.02 (.158) 0.88 (.293) 1.58 (.537) 1.26 (.356) 1.01 (.251) 0.96 (.262) 0.95 (.244) 1.10 (.554) 0.87 (.119) West 1.47* (.261) 0.81 (.339) 1.40 (.555) 1.56 (.487) 0.68 (.232) 0.77 (.287) 1.77* (.471) 2.54 (1.16) 1.05 (.170) Marital Status (married) 1.01 (.119) 1.34 (.359) 0.95 (.280) 0.65* (.144) 0.84 (.193) 0.77 (.182) 1.24 (.254) 1.30 (.453) 0.90 (.097) Age 0.99* (.005) 0.98* (.011) 0.98 (.012) .99 (.008) 0.97***(.009) 0.97** (.010) 0.98 (.008) 1.00 (.014) 0.98***(.004) LTC Industry Status 1.44** (.182) 0.74 (.191) 0.87 (.249) 0.83 (.176) 0.85 (.190) 0.79 (.181) 0.83 (.167) 0.66 (.227) 0.90 (.099) Part-time Status 1.29* (.154) 0.72 (.209) 0.81 (.252) 1.18 (.251) 1.42 (.311) 1.37 (.315) 1.52* (.312) 1.28 (.455) 1.71***(.181) Tenure 0.96** (.014) 0.97 (.031) 0.88* (.050) 0.91* (.033) 0.92* (.037) 0.94 (.036) 0.95 (.026) 0.89 (.054) 0.94***(.014) Prior Wages 0.82 (.124) 0.69 (.208) 0.52 (.180) 0.41***(.092) 0.45** (.118) 0.61 (.170) 1.27 (.256) 0.89 (.349) 0.50***(.066) Table 9. Odds Ratios from the Regression of Nurse Aide Transitions on Selected Independent Variables: SIPP, 1996 Panel, N=5,975
Note: Numbers in parenthesis are standard errors. Log Likelihood=-5470.2717, Pseudo R2=.059. Reference categories are "stay nurse aide with the same
employer" for transition type, "white" for race/ethnicity, "high school diploma" for education, "South" for region, "Not Married" for marital status, "Not Long-Term Care Industry" for LTC Industry Status, and "Full-time" for Part-time Status.
59
Fixed Effects Regression of Log Hourly Wages on Occupational Groups and Selected Independent Variables
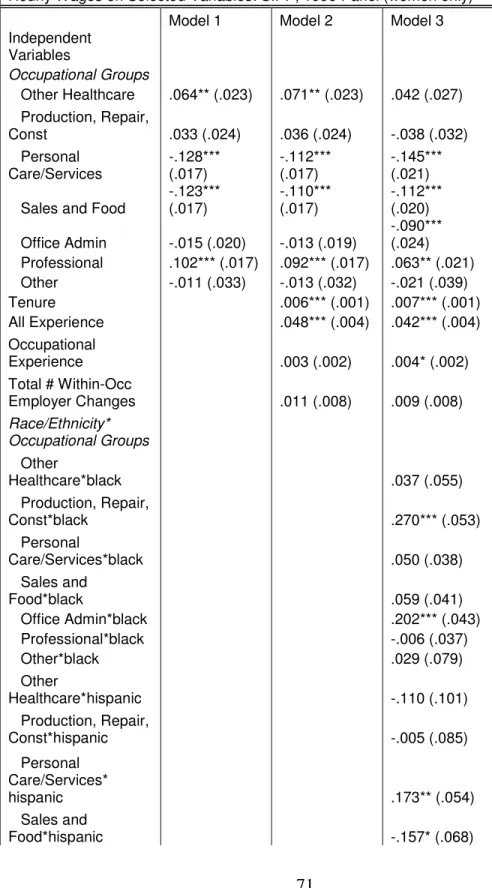
Results of the fixed effects regression of log hourly wages on occupational groups and selected independent variables are shown in Table 10.1. I ran three nested models: Model 1 includes only occupational groups, Model 2 adds tenure, all work experience, occupational experience, and total number of within-occupation employer changes, and Model 3 adds interactions for race/ethnicity and occupational groups, and education. In Models 1, 2, and 3, “nurse aide” is the reference category for occupational group, “white” is the reference category for the race/ethnicity by occupational group interaction terms in Model 3, and “high school” is the reference category for education in Model 3.
60
sales and food services and personal care and services occupations depress workers’ wages relative to their nurse aide wages and that professional, white-collar, or other healthcare occupations improve them.
Model 2 adds three experience variables and a continuous variable for total number of within-occupation employer changes. Once these factors are taken into account, the coefficient for other healthcare becomes slightly stronger – working in other healthcare occupations boosts workers’ wages by 5.3%. The wage effect of working in production, repair, and construction occupations remains significant, and individuals earn over 4% higher wages when they work in these jobs than when they work as nurse aides. The coefficients for personal care and services and sales and food services are still significant but the strength of the effect is slightly reduced. Controlling for experience measures and within-occupation employer changes, individuals earn 10.5% lower wages when they work in personal care and services occupations compared to their nurse aide wages, and 10.4% lower wages when they work in sales and food service occupations. Tenure with an employer has a positive effect as predicted, with every unit increase resulting in about a 1% increase in wages. Total work experience has an even stronger effect, with every unit increase resulting in a 4.5% increase in hourly wages. Neither occupational experience nor total number of within-occupation employer changes is significant, although the direction of the effect is positive for both. These findings largely replicate the results from the baseline model as to hypotheses 4 and 5, and lend support for 7a, and 7b, while H6 and
61
62
earn about 18% lower wages in sales and food occupations and over 10% higher wages in professional occupations compared to their wages as nurse aides. Asians earn 36% higher wages in other healthcare occupations, over 13% lower wages in personal care and services occupations, over 14% lower wages in sales or food occupations, 22.5% higher wages in office and administrative occupations, and about 8% higher wages in professional occupations, compared to their wages when working as nurse aides.
Referring to Table 12.1, it appears that among workers in production, construction, and repair, blacks earn wages 17% higher than the wages of whites, and among workers in office and administrative occupations, blacks earn wages over 19% higher than the wages of whites. Both of these findings are somewhat surprising. Hispanics in personal care and services occupations earn 16% higher wages than the wages of whites in these occupations, and in office and administrative occupations Hispanics earn wages over 9% higher than whites, but earn wages that are about 9% lower than whites’ in sales and food preparation and service occupations. Asians in other healthcare occupations earn wages almost 34% higher than the wages of whites in these occupations, and in office and administrative occupations they earn 31.5% higher wages than whites. However, in production, construction, and repair occupations, Asians’ wages are over 13% lower than whites’ wages.
63
in total work experience results in about a 4% increase in wages. The effects of occupational experience and total number of within-occupation employer changes are nonsignificant still. As for the effects of education on wages, workers earn about 13% lower wages when their level of education is less than high school compared to high school, and interestingly, they earn slightly over 6% lower wages when they have some college education compared to a high school diploma. The effects of having a diploma or vocational degree as opposed to only a high school diploma are strong, increasing wages by about 28%, and the effects of having an academic degree or bachelor’s degree as opposed to only a high school degree are even higher, increasing wages by 28.5%.
64
1 and 2, the race by occupation group interactions in Model 3 show that blacks are the only group for whom wages are higher – and markedly so – in these occupations. Finally, office and administrative support occupations had no significant wage effect in Models 1 and 2, but Model 3 suggests that the nonsignificance was due to differential effects for race/ethnic groups: the negative effect for whites and the positive effect for blacks and Asians likely canceled each other out. Furthermore, the interaction allows us to see whether minority groups have a wage advantage or wage disadvantage relative to whites in any of these occupational categories. For example, it appears that blacks in production, construction, and repair occupations have a wage advantage of 17% over whites, and a 19% wage advantage over whites in office and administrative support occupations. Finally, Model 3 continues to lend support for hypotheses 7a, and 7b, while H6 and 7c are not confirmed.
Supplementary Analyses
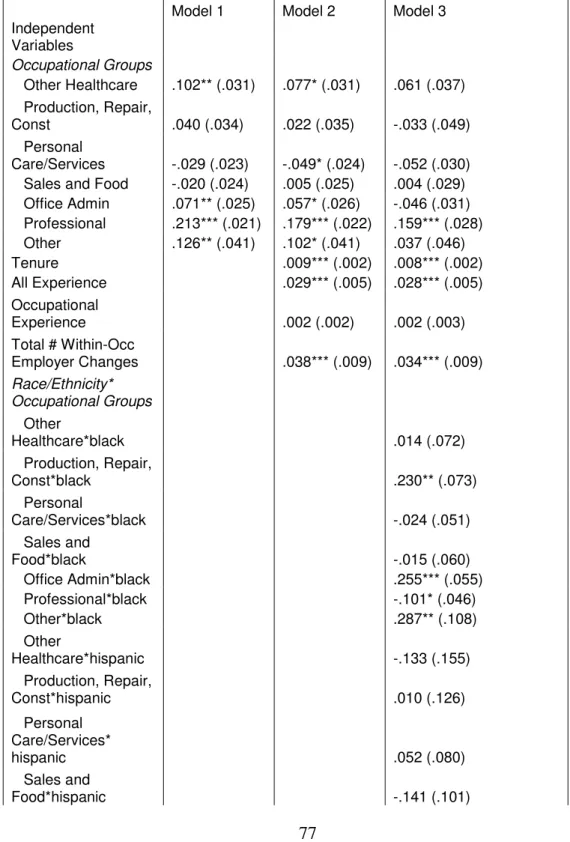
I redid the analysis above restricting the sample to women. As can be seen in Table 10.2, the results are substantively very similar, with only slight changes in the size of coefficients. Although production, repair, and construction is not significant in Models 1 and 2 of this analysis, the F-test for the inclusion of the interaction terms is significant, and the resulting conditional effects are very similar (Tables 11.2 and 12.2). In this women-only analysis, occupational experience has a very small (.4%) positive effect on wages in Model 3.
65
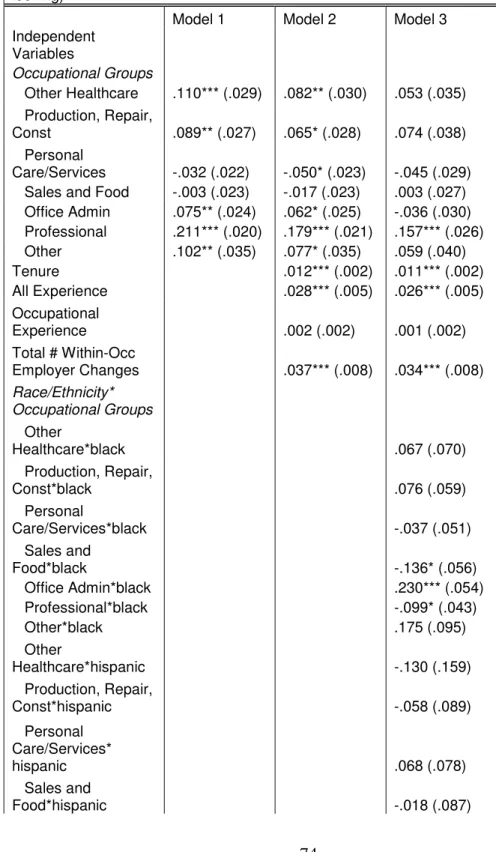
those beginning when an individual (female or male) is observed working as a nurse aide and all subsequent cases for that individual in the data. The results of this analysis appear in Table 10.3. The results are interesting and substantively different from the models with unrestricted cases (from Tables 10.1 and 10.2). Model 1 shows that the coefficients for other healthcare and production, repair, and construction occupations are over twice as large. Individuals earn 11% higher wages when they move on to other healthcare occupations compared to their nurse aide wages, and almost 9% higher wages in production, repair, or construction occupations. Now, office and administrative support work is significant, and workers earn 7.5% higher wages in these jobs compared to their nurse aide wages. Workers who move on to professional occupations earn wages that are 21% higher than their nurse aide wages. Personal care and services and sales and food preparation and services are not
66
employer accounts for a 1.2% increase in wages per tenure unit increase and total work experience increases wages by about 3%. In this analysis, total number of within-occupation employer changes is positive and significant, accounting for a nearly 4% increase in wages for every employer change within a given occupation.
67
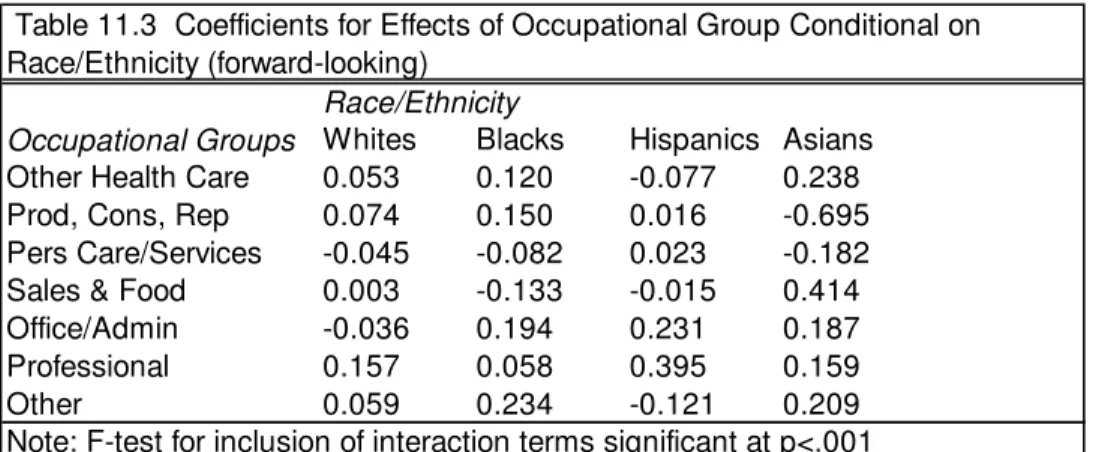
occupations. Asians appear to earn especially high wages when they move on to other health care jobs, office work, and professional occupations, and very low wages in production, repair, or construction occupations and personal care and services occupations.
68
Table 10.1 Coefficients for Fixed Effects Regression Models of Log Hourly Wages on Selected Variables: SIPP, 1996 Panel
Model 1 Model 2 Model 3
Independent
Variables
Occupational Groups
Other Healthcare .049* (.022) .053* (.021) .022 (.025) Production, Repair,
Const .049* (.021) .043* (.020) -.002 (.028) Personal Care/Services -.120*** (.016) -.105*** (.016) -.131*** (.021)
Sales and Food
-.116*** (.016) -.104*** (.016) -.090*** (.019)
Office Admin -.016 (.019) -.014 (.018)
-.090*** (.023)
Professional .105*** (.015) .094*** (.016) .069*** (.019) Other -.002 (.027) -.003 (.027) .010 (.033) Tenure .009*** (.001) .009*** (.001) All Experience .045*** (.004) .040*** (.004) Occupational
Experience .003 (.002) .003 (.002)
Total # Within-Occ
Employer Changes .012 (.008) .010 (.008) Race/Ethnicity*
Occupational Groups
Other
Healthcare*black .063 (.052)
Production, Repair,
Const*black .172*** (.045)
Personal
Care/Services*black .039 (.038)
Sales and
Food*black -.025 (.040)
Office Admin*black .192*** (.041) Professional*black -.020 (.036)
Other*black -.010 (.068)
Other
Healthcare*hispanic -.054 (.099)
Production, Repair,
Const*hispanic -.033 (.066)
Personal Care/Services*
hispanic .161** (.050)
Sales and
69
Office
Admin*hispanic .094 (.079)
Professional*hispanic .035 (.078)
Other*hispanic -.227* (.109)
Other
Healthcare*asian .338** (.124)
Production, Repair,
Const*asian -.132 (.117)
Personal
Care/Services*asian -.013 (.075)
Sales and
Food*asian .099 (.117)
Office Admin*asian .315** (.110) Professional*asian .009 (.093)
Other*asian .118 (.121)
Education
Less than HS
-.133*** (.033)
Some College -.065* (.030)
Diploma or Voc Deg .278*** (.041)
Academic Deg/BA .285*** (.048)
Constant 2.1 1.84 1.83
N 11744 11744 11744
*p<.05 **p<.01 ***p<.001
70
Race/Ethnicity
Occupational Groups Whites Blacks Hispanics Asians
Other Health Care 0.022 0.085 -0.032 0.360
Prod, Cons, Rep -0.002 0.170 -0.035 -0.134
Pers Care/Services -0.131 -0.092 0.030 -0.144
Sales & Food -0.090 -0.115 -0.179 0.009
Office/Admin -0.090 0.102 0.004 0.225
Professional 0.069 0.049 0.104 0.078
Other 0.010 0.000 -0.217 0.128
Table 11.1 Coefficients for Effects of Occupational Group Conditional on Race/Ethnicity
Note: F-test for inclusion of interaction terms significant at p<.001
Occupational Groups Blacks Hispanics Asians
Other Healthcare 0.063 -0.054 0.338
Prod, Cons, Rep 0.172 -0.033 -0.132
Pers Care/Services 0.039 0.161 -0.013
Sales & Food -0.025 -0.089 0.099
Office/Admin 0.192 0.094 0.315
Professional -0.020 0.035 0.009
Other -0.010 -0.227 0.118
Note: F-test for inclusion of interaction terms significant at p<.001 Table 12.1 Coefficients for Effects of Race/Ethnicity Conditional on Occupational Group