The Evolution of 10-K Textual Disclosure:
Evidence from Latent Dirichlet Allocation
Travis Dyer†
Mark Lang†*
Lorien Stice-Lawrence†
October 2016
While characteristics of quantitative accounting data have received substantial attention in the academic literature, much less is known about the accompanying text. We document marked trends in 10-K disclosure over the period 1996-2013, with increases in length, boilerplate, stickiness, and redundancy and decreases in specificity, readability, and the relative amount of hard information. We use Latent Dirichlet Allocation (LDA) to examine specific topics and find that new FASB and SEC requirements explain most of the increase in length and that 3 of the 150 topics—fair value, internal controls, and risk factor disclosures—account for virtually all of the increase. These three disclosures also play a major role in explaining the trends in the remaining textual characteristics. Our results are potentially relevant to regulators in understanding trends in, and topical sources of textual characteristics amid concerns about increasingly onerous accounting disclosures.
† The University of North Carolina at Chapel Hill *
Corresponding author: Mark Lang, Kenan-Flagler Business School, the University of North Carolina, Chapel Hill, NC 27516-3490, [email protected]. We thank Beth Blankespoor for sharing code to measure the numeric content of disclosure. We thank workshop participants at University of Bristol, Cornell University, University of Exeter, Georgetown University, Indiana University, University of North Carolina, Stanford University, and University of Utah for helpful comments and
suggestions. An earlier version of this paper was circulated under the title “The Ever-Expanding 10-K: Why Are 10-Ks Getting So Much Longer (and Does It Matter)?” The Internet Appendix can be accessed at http://tinyurl.com/hrep57s.
The Evolution of 10-K Textual Disclosure:
Evidence from Latent Dirichlet Allocation
October 2016
While characteristics of quantitative accounting data have received substantial attention in the academic literature, much less is known about the accompanying text. We document marked trends in 10-K disclosure over the period 1996-2013, with increases in length, boilerplate, stickiness, and redundancy and decreases in specificity, readability, and the relative amount of hard information. We use Latent Dirichlet Allocation (LDA) to examine specific topics and find that new FASB and SEC requirements explain most of the increase in length and that 3 of the 150 topics—fair value, internal controls, and risk factor disclosures—account for virtually all of the increase. These three disclosures also play a major role in explaining the trends in the remaining textual characteristics. Our results are potentially relevant to regulators in understanding trends in, and topical sources of textual characteristics amid concerns about increasingly onerous accounting disclosures.
I. Introduction
Investors, preparers, regulators, and standard setters have become concerned that corporate disclosure has become longer, more redundant, less readable, less specific, and more boilerplate over time (Li, 2008; KPMG, 2011; SEC, 2013). However, the extent to which that is true, as well as the magnitude, economic determinants, specific content, and attributes of trends in textual disclosure have received relatively little attention in the academic literature. In 2013, the SEC began a comprehensive review of disclosure regulation with the intent of identifying excessive, unduly complex, and redundant disclosure (SEC, 2013). Similarly, the FASB has an ongoing agenda project, the Disclosure Framework, evaluating the effectiveness of textual disclosure (FASB, 2012). A variety of explanations have been offered for these trends including increases in litigation concerns, business complexity, globalization, regulation, and new
mandatory disclosures (KPMG, 2011; SEC, 2013; Monga and Chasan, 2015); however, there is relatively little systematic academic research evidence focusing on trends in textual disclosure.
While there is a substantial literature on trends in the characteristics of quantitative accounting data (particularly earnings and book value) over time,1 the relative lack of rigorous empirical evidence on disclosure is surprising given the many concerns expressed by regulators, preparers, users, and the business press. However, a challenge in assessing trends in the content of 10-K textual disclosure is in categorizing and quantifying disclosure for a large number of lengthy, complex documents, especially given that disclosure of a given topic often appears in multiple sections of the 10-K and any given passage often combines multiple topics.
In many ways, the issues in assessing 10-K content are similar to those faced in other literatures. For example, researchers in journalism have been interested in trends in coverage of
1 See, for example, Collins et al. (1997), Francis and Schipper (1999), Lev and Zarowin (1999), Givoly and Hayn
the New York Times (Blei, 2012), those in literature in understanding topical trends in poetry (Rhody, 2012), in politics understanding trends in Senate discourse (Grimmer, 2010), in history understanding historical trends using the content of State Department cables (Chaney et al., 2015), and in science understanding topical trends in journals such as Science (Blei and Lafferty, 2007). In all of these domains, the challenge is in analyzing trends in corpuses far too large for humans to manually review and to summarize them in a way that is easily interpretable.
Following that literature, we use a natural language processing technique, Latent Dirichlet Allocation (LDA), to understand the changing content of 10-Ks.2 LDA is a Bayesian computational linguistic technique that identifies the latent topics in a corpus of documents.3 It is well suited to understanding the text of the 10-K because it permits analysis of the topical
content of a large group of lengthy documents over time in an objective and replicable matter and relies on a very limited set of assumptions that are likely to be met in 10-K disclosure. Further, it is specifically designed to infer proportions of content for documents which contain multiple topics, even if the topics are entangled, which is important given that 10-Ks comprise a large number of interspersed topics.4 It permits the proportion of the 10-K related to each topic to vary across documents so it is well-suited to examining topical trends in textual disclosure. As a result, we can deconstruct the 10-K by topic irrespective of whether topics appear in, for
example, the footnotes, risk factors, or Management’s Discussion and Analysis (MD&A). We can then assess trends in the discussion of topics over time and relate them to changes in specific
2
LDA is also used commercially. For example, the New York Times uses LDA to recommend articles to subscribers by inferring topics from articles they have read and identifying articles with similar content (Spangher, 2015).
3 “Latent” refers to the fact that LDA is designed to infer the underlying topics in a document, “Dirichlet” refers to
the family of probability distributions used in the estimation, and “Allocation” refers to the fact that the estimation allocates words to topics.
4 For example, the discussion of pensions might include a discussion of foreign currencies and appear in MD&A as
disclosure requirements (e.g., new FASB standards, SEC requirements, and regulatory events such as SOX) and other events (e.g., changes in litigation risk, mergers and acquisitions, etc.).
Additionally, once the topic model is trained, it permits us to identify paragraphs by topic, so that we can track where specific topics occur within the 10-K. This allows us to identify the extent to which, for example, FASB requirements (e.g., footnotes) create redundancy with SEC requirements (e.g., risk factors and MD&A) by highlighting which topics tend to be redundant within the 10-K as well as across time and across firms. Similarly, by accumulating text within a topic, we can identify the topical sources of textual attributes that prior literature suggests may be problematic such as boilerplate, redundancy, stickiness, and lack of specificity.
In our empirical analysis, we examine the text of 10-Ks for 10,452 firms and 75,991 firm-years over the period 1996 to 2013. We begin by documenting trends in textual characteristics of disclosure over time. We focus on measures that have been identified by prior research, as well as regulators and investors, as affecting the accessibility and informativeness of disclosure. In particular, we consider length (Loughran and McDonald, 2014), readability (Miller, 2010), boilerplate (Lang and Stice-Lawrence, 2015), redundancy (Cazier and Pfeiffer, 2015b),
specificity (Hope et al., 2016), stickiness (Brown and Tucker, 2011), and the relative prevalence of informative numbers in the text or “hard” information(Blankespoor, 2016).
In line with commonly-voiced concerns about recent changes in disclosure, we document clear and consistent trends across all measures. Median text length doubled from 23,000 words in 1996 to nearly 50,000 in 2013, and attributes which prior research suggests tend to reduce
such as readability, specificity, and the relative mix of hard information of disclosure, showed clear decreases. Given these trends, we next turn to investigating their topical sources.
Prior literature (e.g., Cazier and Pfeiffer, 2015b) suggests that variables such as size, industry-composition, complexity, one-time events, litigation, and SEC oversight affect textual attributes such as length and readability in the cross section. Consistent with assertions by commentators such as Monga and Chasan (2015), it could be the case that those factors also change in the time series in ways that explain trends in textual attributes. We examine textual attributes after controlling for a wide variety of company-level variables suggested by the prior literature and for a constant sample of firms, but similar patterns persist. While those variables are significant cross-sectional determinants of textual attributes, including them in a regression framework does not explain the trend in disclosure characteristics over time.
Given that readily observable firm-level attributes do not explain the trends we observe, we use LDA to examine the topical content and characteristics of the additional disclosure. Our analysis suggests that the corpus of 10-Ks comprises 150 topics, which we aggregate into 13 broader categories for ease of discussion. The four categories which account for the bulk of 10-K length are Performance; Compliance with specific accounting and disclosure standards; Industry-Specific disclosure; and Employee-Related disclosure. However, only disclosure related to Compliance with specific accounting and disclosure standards increased substantially over time. Within this category, three topics explain the vast majority of the increase: fair value and
disclosure around the events that should have increased disclosure of these topics
(implementation of SFAS 157, Sarbanes-Oxley, and Item 1A). We document sharp increases in the length of these three topics in the years in which their associated standards were
implemented, consistent with the LDA topics effectively capturing disclosure in response to standards. Disclosure associated with these topics is not limited to a single section of the annual report but extends across all of the major sections.5 Similarly, the pattern in disclosure length for these three topics largely explains the increase in disclosure length for the 10-K as a whole.
In our third set of analyses, we link topical disclosure at the paragraph level, in particular that relating to the three major increasing topics, to other textual attributes of the 10-K. We demonstrate that fair value/impairment, risk factor, and internal control disclosure tend to have relatively high levels of redundancy, stickiness, and boilerplate, and low levels of readability, specificity, and hard information. Further analyses indicate that the increasing prevalence of these three topics contributed significantly to the overall increases in redundancy, stickiness, and boilerplate, and the decreases in readability, specificity, and the mix of hard information.
Finally, we examine cross-sectional variation in fair value, internal control, and risk factor disclosures. We document consistent patterns of increased length associated with these topics for disparate subsamples of firms suggesting that firms experienced significant increases in disclosure length even when the additional disclosure may not have been as relevant. Further, we find that firms for which the requirements were likely to be less relevant often responded by
5 Because the three major topics that we identify are linked to individual standards, it might be tempting to infer that
providing disclosure that was particularly high in boilerplate, redundancy, complexity, and stickiness, and lacking in hard information and specificity, although less so for fair value disclosure where firms appear to have more flexibility to tailor disclosure based on materiality.
Overall, our evidence identifies clear trends in textual attributes which prior research has linked to reductions in information content and suggests that a substantial portion of these trends can be explained by disclosure in response to recent regulatory changes and that the effect is particularly pronounced for subsamples of firms for which the disclosure may be less
informative. While the fact that disclosure associated with new requirements increased over time is not in and of itself surprising, we believe our results provide several important contributions.
First, we believe it is important to quantify the extent to which attributes of 10-K textual disclosure have, in fact, changed over time and attempt to distinguish among various
explanations. While the three primary disclosure topics that we identify are logical candidates to explain the increase in 10-K disclosure length over time, it is noteworthy that they explain such a large proportion of the overall increase in length, as well as in other attributes such as
complexity, redundancy, boilerplate, stickiness and lack of specificity. In contrast, economic factors from the prior literature (e.g., litigation risk, business complexity, and globalization) and the wide variety of other new requirements that were enacted during the sample period have limited ability to explain the disclosure trends that we document. While these disclosure responses may not have been intended by standard setters, a survey of financial executives by KPMG indicates that 70% of respondents believe that current standards do not permit preparers the discretion required to reduce the amount and complexity of disclosures (KPMG, 2011).6
6 The SEC is clearly concerned about the potential for new requirements to affect the informativeness of financial
Second, we develop and demonstrate the value of natural language processing techniques such as LDA in understanding trends in the underlying content of textual disclosure. To our knowledge, ours is the first research to focus directly on trends in 10-K content over time, and we believe that LDA has the potential to be a powerful tool for understanding trends in the content of financial text because it provides an approach for evaluating topical coverage for large samples of lengthy documents on a consistent and objective basis over time. While summary quantitative measures such as length, redundancy, and readability are useful in providing
aggregate characterizations of the accessibility and informativeness of documents, it is important to develop techniques that permit insight into the underlying content of disclosure in order to make these attributes interpretable. LDA permits the researcher to identify specific disclosure topics, highlight trends, isolate causes, and evaluate potential economic outcomes. Beyond 10-Ks, LDA has the potential to provide insight into trends in the content of other disclosures such as press releases, SEC speeches, conference calls, and articles in the business press.
Third, we use LDA to link specific topics to textual characteristics of annual reports that are likely to be of interest to regulators, standard setters, and investors, providing a mechanism to assess their topical content, and provide systematic evidence across a number of dimensions on the time series trends in these textual characteristics. This is especially important given that prior literature focuses on textual outcomes at an aggregate level and generally does not incorporate the fact that discussions of different topics will have different textual attributes. LDA provides the opportunity to reinterpret the existing literature on outcomes of these attributes factoring in the actual content of the discussion to which they relate.
research design section, we follow the prior computational linguistics literature in identifying the appropriate number of topics. In addition, we review the word lists and read representative paragraphs for each topic to ensure the content matches the label and investigate the timing of changes in major topics around regulatory changes to ensure they behave as expected. As a result, we are confident that our interpretations are reasonable and consistent with the behavior of the topics in our corpus.
Second, our results are descriptive and clearly do not allow us to draw normative conclusions.7 We believe that LDA (along with other textual analysis techniques) has the potential to structure the broader discussion on topics such as disclosure effectiveness and information overload. We focus on a set of textual attributes that academic research, regulators, and investors indicate might influence the informativeness of disclosure. However, we are careful to acknowledge the potential limitations of these textual measures to capture meaningful aspects of usefulness in the specific context of annual reports, especially for sophisticated financial statement users.Closely related, while the textual attributes we consider have been shown to reduce information content in prior research using aggregate 10-K text, it is possible that those results do not apply to the specific topics we consider.8
Acknowledging these caveats, our results suggest potential directions going forward. Given that our findings identify topics that drive substantial changes in attributes which prior
7
To some extent, the challenge here is analogous to the literature on trends in characteristics of net income over time in that the researcher cannot make normative statements given the variety of stakeholders and other sources of information. Rather, the literature relies on characteristics such as the ability of earnings to predict future cash flows or the association with returns which prior research or standard setters have suggested are likely to be desirable attributes. However, the results are innately descriptive and it is up to the standard setter to decide how to apply them in practice and up to future research to link the earnings characteristics to usefulness in particular settings.
8 For example, while Cazier and Pfeiffer (2015b) provide evidence that redundant disclosure is associated with less
evidence links to the informativeness of disclosure, our results suggest that a logical starting point would be to more closely examine disclosure on fair values, internal controls, and risk factors. Using LDA it is possible to identify specific documents and even paragraphs which are disproportionately characterized by a given textual attribute such as redundancy or boilerplate. This could then guide more formal analysis by regulators and researchers to examine whether, in specific contexts, text that is, say, redundant, boilerplate, or difficult to read is nevertheless appropriate because it conveys useful information that may not be possible to convey in a more simplistic way. This type of analysis could be especially useful if paired with more rigorous analysis of the implications of these textual measures, perhaps in an experimental setting with subjects who are experienced users of financial information. Additionally, LDA makes it relatively straightforward to identify sources of redundancies between disclosures required by the SEC and FASB, allowing regulators to focus on areas of overlap. While LDA does not replace the need to make difficult judgment calls and trade-offs, at a minimum it would focus efforts on aspects of disclosure where they are more likely to be fruitful.
II. Background and Related Research
last such review of disclosure requirements was performed in 1996, after which the Plain English Initiative was implemented. The purpose of the current initiative is to understand the trajectory of disclosure and make recommendations for future revisions in guidance. Chair of the SEC Mary Jo White said, “We should consider all sources that may be contributing to the length and complexity of disclosure” (White, 2013).
Despite the concern on the part of the SEC and others about annual report text, financial reporting research has traditionally focused on quantitative data, particularly summary statistics such as net income and shareholders’ equity, reflecting in large part the relative ease of assessing associations between quantitative data, coupled with an inherent assumption of unlimited
information-processing capacity on the part of investors (see, for example, the papers cited in Footnote 1). More recently, researchers have begun to explore determinants of textual attributes of the 10-K. For example, Li (2008) links Fog to poor performance, Cazier and Pfeiffer (2015a) link length to complexity, and Cazier and Pfeiffer (2015b) link redundancy to obfuscation. However, while prior studies focus on cross-sectional determinants of textual characteristics, our results suggest that those factors have limited ability to explain trends in reporting over time.
In our analysis we focus on a broad set of textual attributes: length, readability,
information from textual data in the annual report and their subsequent decision-making. We rely on this prior literature when interpreting the textual trends, while acknowledging that the
interpretation of these textual attributes is limited by the fact that we do not directly measure the usefulness of the actual information and different types of information may lend themselves to disclosure with different attributes (e.g., some topics may lend themselves to disclosure which is more redundant, boilerplate, or expressed in longer sentences). To our knowledge, ours is the first academic paper to focus on identifying the magnitude, content, and causes of time trends in textual disclosure, although these trends have received substantial attention by practitioners.
First, prior literature in academia and practice has discussed negative effects of less readable and overly lengthy disclosure, sometimes referred to as disclosure “overload” (KPMG, 2011). Similar to the incomplete revelation hypothesis in Bloomfield (2002) in which statistics that are costly to extract are not fully incorporated into price, these attributes have been shown to decrease information impounded at the time of the filing and increase subsequent price drift (Lee, 2012; You and Zhang, 2009).9
Similarly, redundancy of disclosure within a document, re-use of the same firm’s
disclosure from a prior period (disclosure “stickiness”), and generic and standardized disclosure (often referred to as “boilerplate”) have been highlighted as negative aspects of disclosure. For example, all three are discussed by the FASB in its invitation to comment on the disclosure framework project (FASB, 2012), and the SEC has urged firms to remove boilerplate disclosure and indicated that redundancies between FASB and SEC disclosure requirements will be a focus going forward (Higgins, 2014; SEC, 1998, 2013). Cazier and Pfeiffer (2015b) show that
redundant disclosure leads to less efficient price discovery, while Brown and Tucker (2011) find
9 Additionally, disclosure length and Fog have been shown to lead to greater market uncertainty (Loughran and
that MD&As that are updated less over time (“sticky” disclosures) have muted stock price responses. Lang and Stice-Lawrence (2015) empirically link the use of boilerplate to decreased liquidity, analyst following, and institutional ownership for an international sample.
Lastly, we examine the specificity of disclosure and the relative amount of hard
information. Regulators have expressed concern that textual disclosure has become increasingly vague and less likely to be supported by quantitative data (SEC, 1998). To capture this, we calculate specificity as how often the text refers to specific people, places, organizations, times, or numbers. Hope et al. (2016) show that more specific risk disclosures lead to greater market reactions and better risk assessments by analysts. To measure the extent to which narrative disclosure is supported by quantitative data (the relative mix of hard and soft information), we measure the number of informative numbers in the 10-K (i.e., excluding dates and section numbers) relative to the total number of words. This gives a sense of the quantitative density of disclosure, because text that contains numbers is more verifiable and precise than general
descriptions of topics. Blankespoor (2016) documents an increase in quantitative disclosure after the introduction of XBRL, consistent with firms providing more quantitative data when users’ processing costs decrease.
has the potential to organize textual disclosure for numerical analysis, it has not, to our
knowledge, been applied to understanding trends in 10-K disclosure or to identifying the topical sources of constructs such as length, readability, redundancy, specificity, boilerplate, stickiness, or the mix of hard information.
III. Data
We generate a database of text using SEC 10-K filings spanning the years 1996 to 2013.10 Control variables in our reported analyses are obtained from CRSP and Compustat. Following Loughran and McDonald (2014) we remove firms with negative market-to-book ratios. The intersection of our data constraints results in a sample of 10,452 firms and 75,991 firm-years. Definitions for all of our variables are included in the Appendix.
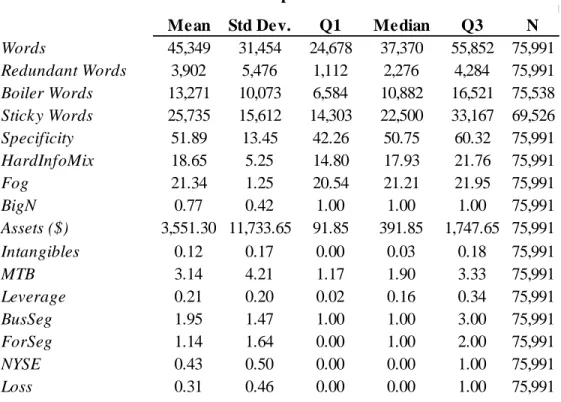
Table 1 provides descriptive sample statistics. The median firm included 37,370 words in their annual report. Based on the Fog index, reading and comprehending the median annual report requires approximately 21.21 years of formal education. The median annual report has 2,276 words (6% of the 10-K for the median firm) in sentences that are repeated verbatim throughout the annual report, 10,882 words (29%) in sentences containing boilerplate phrases, and 22,500 words (67%) in sentences containing “sticky” phrases.11 Median levels of Specificity and HardInfoMix of 50.75 and 17.93 indicate that the median 10-K includes about 51 and 18 specific terms and informative numbers, respectively, for every 1,000 words of text. Lastly, approximately 77% of the sample firms are audited by a Big “N” auditor, and 31% report a loss.
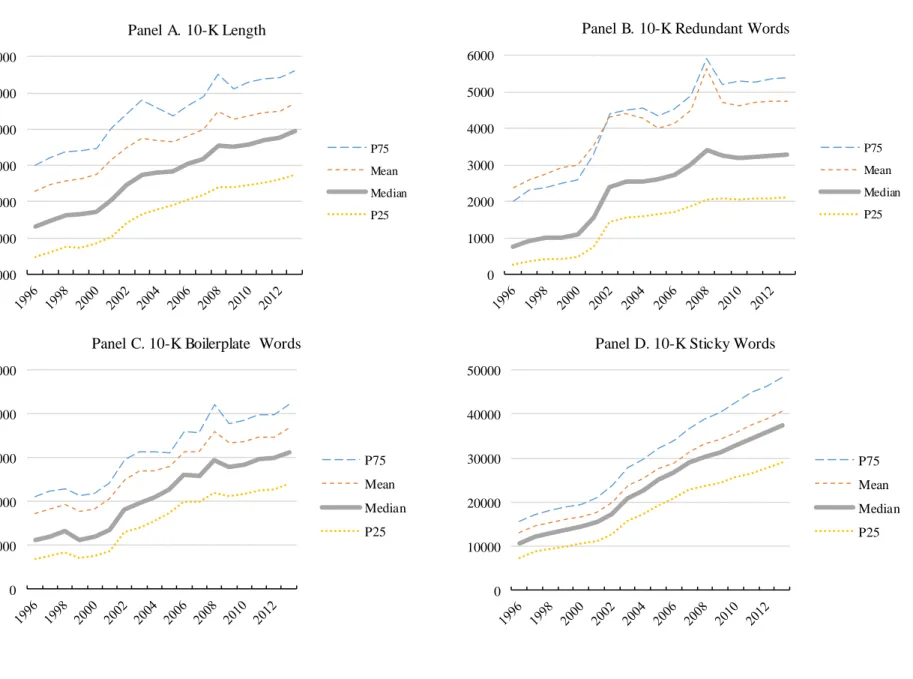
Figure 1 provides initial evidence on the trends in reporting over our sample period, including length, readability, redundancy, boilerplate, stickiness, specificity, and the mix of hard
10
We include only those filings in 1996 that were issued after electronic filing on EDGAR became mandatory.
11 Similar to Lang and Stice-Lawrence (2015), we identify boilerplate as 4-word phrases that are extremely common
information. Perhaps most prominent and relevant for our purposes is the increase in length depicted in Figure 1 Panel A and the near monotonicity of this increase. While there is some evidence of larger increases around Sarbanes-Oxley in the early 2000s and the financial crisis, especially for firms in the 75th percentile, the increase for the median firm has been remarkably continuous. The number of words for the median firm increased from about 23,000 in 1996 to almost 50,000 in 2013.
In terms of other attributes that prior research suggests may reduce the informativeness of disclosure, the pattern for redundant words in Figure 1 Panel B is similarly conspicuous, with the median firm increasing from 800 words in redundant sentences in 1996 to almost 3,300 in
2013.12 Figure 1 Panels C and D suggest similar upward trends in the amount of boilerplate and stickiness, with both tripling over time, indicating an increasing tendency for firms to repeat disclosure from year to year and to use generic disclosure. On the other hand, readability for the median firm decreased monotonically over the twelve years since 2000, following an increase between 1998 and 2000 that was likely a result of the SEC’s plain English requirements in 1998.13 Results in Panels E and F also suggest clear decreases in other attributes of informative disclosure, with specificity and the relative mix of hard information exhibiting nearly monotonic decreases over the period.
The preceding analysis is descriptive, but it provides strong initial evidence that trends in textual disclosure have been systematic and, perhaps more troublingly, that attributes which prior research and regulators suggest are potentially problematic have been increasing, while those
12 Our measure of redundancy almost certainly understates the true level because we err on the side of being
conservative by requiring verbatim repetition of sentences. Conclusions are consistent if we relax our criteria by not requiring that all words in a sentence be repeated verbatim.
13 Fog is defined as the average number of words per sentence plus the percent of words containing more than two
which are more likely to be informative have been decreasing. Further, the consistency in trends among the attributes suggests the possibility that the same underlying factors may be driving the series. In the next section, we examine the extent to which determinants previously used to explain cross-sectional variation in textual attributes explain the trends that we observe.
IV. Why Have Textual Attributes Changed Over Time?
There are several potential explanations for the changes in 10-K characteristics over time. First, they might reflect a change in sample composition if, for example, more firms with
intangible assets (and potentially lengthier and more complex corresponding disclosure) began trading publicly during the sample period.14 However, untabulated analysis indicates that all seven of our attributes continue to trend very similarly for a constant sample.
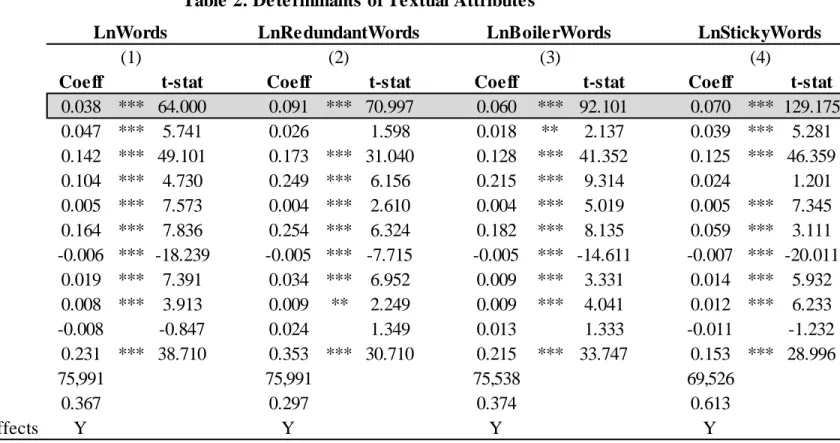
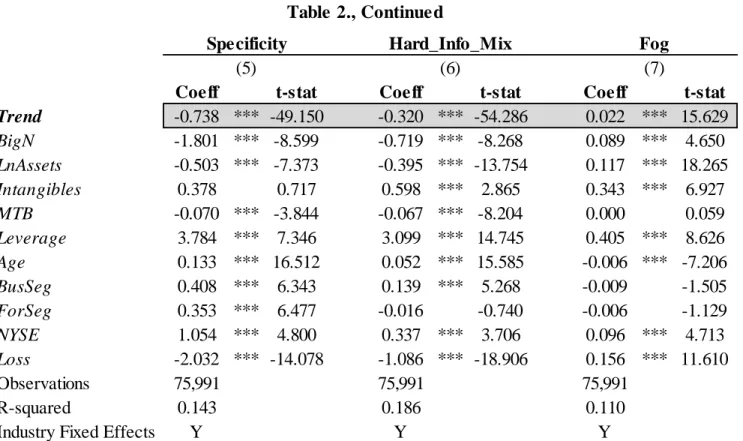
Alternatively, some practitioners have suggested that changes in 10-K disclosure over time may be the result of changes in the economic fundamentals of firms (Monga and Chasan, 2015; FASB, 2012; SEC, 2013). For example, factors such as business complexity, leverage, size, auditor, and profitability have been shown to be important cross-sectional determinants of textual attributes (Cazier and Pfeiffer, 2015a, 2015b; Li, 2008). In Table 2 we report results for regressions where we explain our textual outcomes using variables such as size, auditor, NYSE membership, complexity in terms of numbers of business segments or operating segments, market-to-book ratio, leverage, intangibles, and losses. Although we do not discuss all of the coefficients in this table for parsimony, results are generally consistent with expectations. Length increases with size, complexity, Big-N auditor, market-to-book, leverage, and losses. Firms reporting losses tend to have vague and “foggy” discussions (lower readability, specificity, and
14 For example, Srivastava (2014) suggests that trends in value relevance of accounting data can be explained by
hard information mix), consistent with the obfuscation hypothesis in Li (2008). However, the Trend variable remains strongly significant for all of the textual attributes.15
The preceding analysis suggests that disclosure attributes are influenced by firm-specific variables suggested by regulators and prior research in predictable ways. However, the trends remain significant after controlling for these variables. Another possibility is that the change in overall length is driven by increases in specific sections of the 10-K driven by changes in disclosure requirements by either the SEC or the FASB (KPMG, 2011; White, 2013).
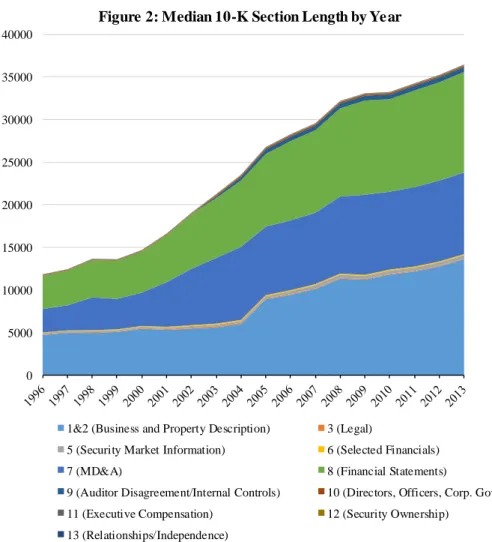
Figure 2 plots the median length for sections of the 10-K. Of the eleven sections, three make up about 90% of the total text in the most recent year: Sections 1 & 2 (Business and Property Descriptions), Section 7 (Management’s Discussion and Analysis), and Section 8 (Financial Statements and Footnotes). Sections 1, 2 and 7 reflect SEC requirements and Section 8 reflects FASB standards. Most noticeable from Figure 2 is the fact that the length of each of the major sections has increased substantially and at roughly the same rate over time. As a consequence, the proportion of the 10-K in each section has remained similar over time, with Sections 1 and 2 comprising 36% of the total in 1996 as compared with 35% in 2013, Section 7 comprising 21% in 1996 vs. 25% in 2013, and Section 8 comprising 30% in both 1996 and 2013. We find similar results when we examine the rest of our textual attributes at the section-level (untabulated for parsimony), with the textual attributes trending within all of the major sections and the relative contribution of the major sections to overall attributes remaining relatively constant over time. Thus while changes to disclosure standards may be important determinants of overall changes in 10-K disclosure, these results suggest that overall changes in disclosure do not
15 In untabulated results, we add additional control variables related to litigation risk, R&D, ownership, analyst
reflect requirements that are unique to a specific section but rather reflect content that spans multiple sections, including sections under the purview of both the FASB and SEC.
The preceding analyses suggest that firm-level determinants from prior research and specific sections of the 10-K do not fully explain the trends in textual disclosure. In the next section we use LDA to identify the topical content of the disclosure and, most importantly, to quantify the topics that account for the bulk of the changes in overall length that we observe. This more nuanced analysis at the topic level allows us to study drivers of trends in a more detailed way than is possible from analyzing text at the document- or even the section-level.
V. Using LDA to Explain the Change in 10-K Length
LDA is an unsupervised Bayesian machine-learning approach developed by Blei et al. (2003) to identify the topics contained in a large corpus of text. LDA uses the probability of words co-occurring within documents to identify sets of topics and their associated words and is conceptually similar to factor analysis, where the model produces topics instead of factors.As in factor analysis, the computer identifies the words associated with a topic and the researchers assign a label to the topic based on their assessment of the likely content given the set of words and their probabilities. LDA is particularly useful in our setting because it allows us to identify the mix of topics in the overall 10-K, and even within section, even though multiple topics may be interwoven in any given section of the 10-K and any individual topic may occur in multiple sections. This allows us to identify the topics of disclosure contained in each annual report and trends in their proportions over time.
French poetry, State Department cables, or Hillary Clinton’s emails). It makes a minimal number of assumptions that are likely to be at least approximately met in 10-K disclosure. First, it
assumes that the overall corpus of documents contains a finite number of topics, implying that every document consists of a mix of those topics. With input from the researcher, LDA helps to estimate the number of topics in the overall corpus (in our case 150 topics) as well as the proportion of each topic in each document (the proportion can vary across documents or over time, and not every document need contain every topic).16 Second, LDA assumes that specific words appear with different frequencies across topics. LDA estimates the frequency of each word within a topic (a given word may appear across multiple topics with different frequencies and not every word need appear in every topic). As a result, the output from applying LDA to the population of 10-Ks is the proportion of each of the 150 topics that appears in each 10-K (e.g., a given 10-K might be 1.5% about Pensions), and the relative weights of words in each topic (e.g., the word “actuarial” might be 10 times more likely to occur in the Pension topic than the word “derivative”). While the researcher helps to determine the number of topics that are generated by the model (in our case 150), that choice is guided by a specific methodology discussed below. We use the MALLET software developed by Andrew McCallum to apply LDA to our sample and generate topics for our document collection using collapsed Gibbs sampling.17
Because LDA is an unsupervised method, it is replicable and free of researcher bias. However, because the topics can sometimes be difficult to interpret, it is important that the researchers help to select the number of topics generated by the model. Following prior
16
LDA generates “topic loadings” which can be interpreted as the proportion of the document comprising each topic and which, for a single document, sum to one. Our model allows the prominence of topics (the alpha
hyperparameter) to vary across the entire corpus of all 10-Ks so that topics that appear in relatively few documents (e.g., industry-specific topics such as healthcare) are given less prominence while topics that are used in more documents (e.g., accounting policies) are given more prominence. This essentially means that common topics are allowed to be “bigger” than others so that they have a consistently higher topic loading on average.
literature, we use a variety of criteria to ensure that we identify the appropriate number of interpretable topics. First, as proposed in Blei et al. (2003), we measure the “perplexity” of the topic model (defined more formally in the Appendix) for topic models with between 10 and 400 topics and observe that perplexity begins leveling off at 150 topics. Because lower perplexity indicates that the model is a better fit for the observed data, this indicates that the model performance gains relatively little from increasing the number of topics after that point.
Although perplexity is a good general guide, and lower perplexity will always lead to models with at least marginally better fit relative to held-out data, the increase in fit is sometimes at the expense of interpretability due to overfitting. Chang et al. (2009) discuss how increasing the number of topics to produce ever finer partitions can make the model less useful because it becomes almost impossible for humans to differentiate between many of the topics. They propose a task in which the overall interpretability of a particular LDA model is measured by how often a human coder agrees with the topics chosen using the model. We perform this “word intrusion” task by providing research assistants with sets of six words, five of which the
computer suggests belong in the same topic and a sixth which appears commonly in 10-Ks but which the model did not assign to that topic (an “intruder” word). The extent to which the human coder agrees with the computer on the assignment of words to a topic is a measure of the
effectiveness of the technique in capturing meaningful topics. We perform this word intrusion task for topic models of 150, 200, and 250 topics (more details in the Appendix) and find that the 150-topic model has the best interpretability (i.e., the fewest disagreements between the LDA model and human coders). As a consequence, we use LDA topics from the 150-topic model.
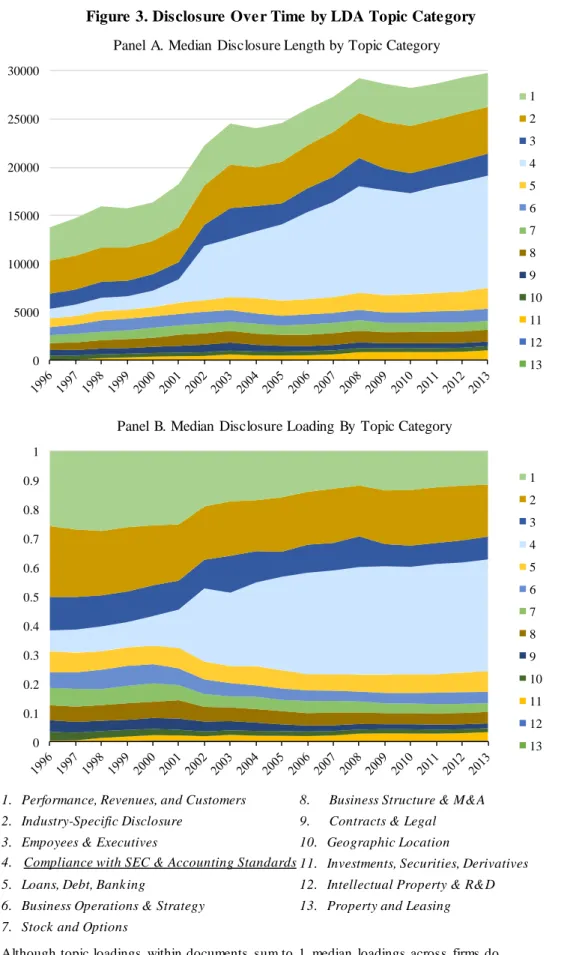
two individuals with financial backgrounds (one MBA student with work experience in banking and one of the authors) independently evaluated each of the 150 topic word lists and determined the best fit of each topic into broader category groupings.18 Category labels are for parsimony and ease of interpretation and do not affect the statistical analysis. The Internet Appendix includes the full list of all 150 topics, the top 20 words most frequently associated with each topic, a topic label created by the researchers, and a “representative paragraph” identified using a procedure similar to Hoberg and Lewis (2015). For all other details relating to the specifics of our LDA procedure and the generation of representative paragraphs, please see the Appendix. Table 3 lists the broad categories into which we group the topics in our analysis, along with brief descriptions.19 For example, “Business Operations and Strategy” refers to discussions of day-to-day business operations such as products, advertising, and information systems; “Business Structure and M&A” refers to discussion of subsidiaries and partnerships, as well as mergers, acquisitions, and other corporate transactions; and “Loans, Debt and Banking” refers to discussion of the firm’s financing. Of the categories, the five that constitute the largest portion of 10-K text, especially in the early part of the sample period, are: “Performance, Revenues, and Customers,” which is primarily discussion of the performance and revenue generation of the firm; “Industry Specific Disclosure,” which includes topics that are unique to specific industries (e.g., healthcare or transportation); “Employees and Executives,” which includes descriptions of executives and executive compensation plans; “Compliance with SEC and Accounting
18 In most cases, the two coders agreed on categorization, but in cases in which the coders disagreed one of the
authors judged the best fit.
19
Standards,” which is text associated with specific reporting requirements; and “Investments, Securities, and Derivatives,” which includes descriptions of financial instruments. The objective identification of topics by the LDA procedure and our more subjective grouping into categories allows us to disaggregate the overall trend in length into the portions attributable to individual types of disclosure. We construct a pseudo topic length by multiplying the topic loadings by the length of the total document to estimate the number of words used to discuss each topic.
Figure 3 Panel A plots the median number of words in each of the broader categories over time. In general, the pattern is clear. Most topics have remained relatively constant over the sample period and therefore do not explain the overall increase in 10-K length. The notable exception is “Compliance with SEC and Accounting Standards” which increased markedly during the sample period.20 Essentially all of the increase in the length of disclosure for the median firm over the sample period appears to be associated with the Compliance with SEC and Accounting Standards category. Figure 3 Panel B provides a similar trend analysis but expressed as the median proportion of total disclosure (i.e., scaling the proportion of disclosure on each topic so that the total adds up to 1).21 Again, we see that the proportion of disclosure related to the Compliance category has increased markedly as a proportion of the total length over the sample period, while the proportions of the other categories (by construction) have decreased.
The preceding analysis provides preliminary, although circumstantial, evidence on the source of the increase in 10-K length over time. Although a general increase in the length of the Compliance category may not be surprising given the introduction of new requirements over our
20 The title “Compliance” is not intended to be pejorative. The category reflects topics for which the categorizers
could clearly identify the disclosure as a response to a specific SEC or FASB requirement and the text did not fit naturally into any other topic.
21 Although the proportions of all topics and topic categories within individual documents sum to one, the sum of
sample period, the fact that the increases are limited to disclosure in the “Compliance” category is potentially more surprising because one might also have anticipated increases in categories such as “Business Operations and Strategy,” “Business Structure and M&A,” or “Performance, Revenues and Customers,” with, for example, general trends in business complexity, firm size, or globalization over time. Further, the magnitude of the increase is substantial, with textual disclosure in the Compliance category increasing approximately ten-fold over the sample period.
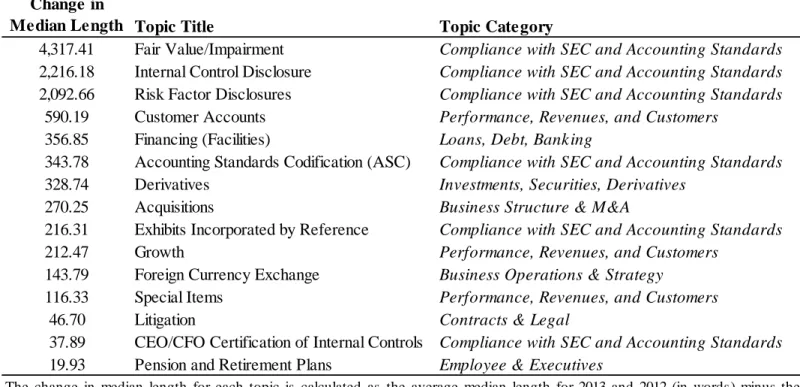
Although the components of the broader categories are somewhat subjective, the analysis of the subcomponents is objective because LDA determines the 150 individual topics and assigns specific text to them. Table 4 reports the top increasing topics by length. The top three topics are categorized as reflecting compliance with specific SEC or FASB standards, in particular fair value/impairment, internal control, and risk factor disclosures. Notably, these top three
increasing topics alone make up the bulk of the increase in overall length with increases of 4,300, 2,200, and 2,100 words, respectively, compared to an increase of less than 600 words for the next most increasing topic, customer accounts. While we would expect these topics to have increased in length given the implementation of new standards (KPMG, 2011; White, 2013), it is noteworthy that they make up such a large proportion of the total increase in disclosure length, especially given the substantial number of other new FASB and SEC requirements during the sample period.22 Because of the large magnitude of the increases in the lengths of these three topics compared to all other topics, we focus on them in our remaining analyses. Examining them individually by year allows us to establish when (and, indirectly, why) these topics increased so substantially.
22 These three subtopics taken together account for about 9,000 of the 10,000 total median word increase in the
One potential concern with the preceding analysis is that LDA may be substituting disclosure that had previously appeared in other topics into our Top 3 topics as a mechanical effect of more standardized language following disclosure guidance. To ensure that is not the case, we investigated whether there are potentially offsetting decreases in any other topics during our sample period. Consistent with the notion that disclosure is added but seldom eliminated, none of the other topics decreased in length over our sample period enough to account for the increase in our Top 3 topics. To examine the issue more formally, we identified the 3, 5 and 10 topics most closely related to each of our Top 3 topics based on cosine similarity (Brown and Tucker, 2011). Netting changes in disclosure length of each of our Top 3 topics with changes in related topics yields similar increases in net disclosure to those reported for our Top 3 topics alone, suggesting that substitution across topics does not explain the increases that we observe.
The first of these three topics relates to fair value and impairment disclosure. Its top words according to the LDA procedure include: “fair,” “reporting,” “consolidated,”
“impairment,” “control,” “future,” “recognized,” “estimated,” “expected,” and “asset.” 23
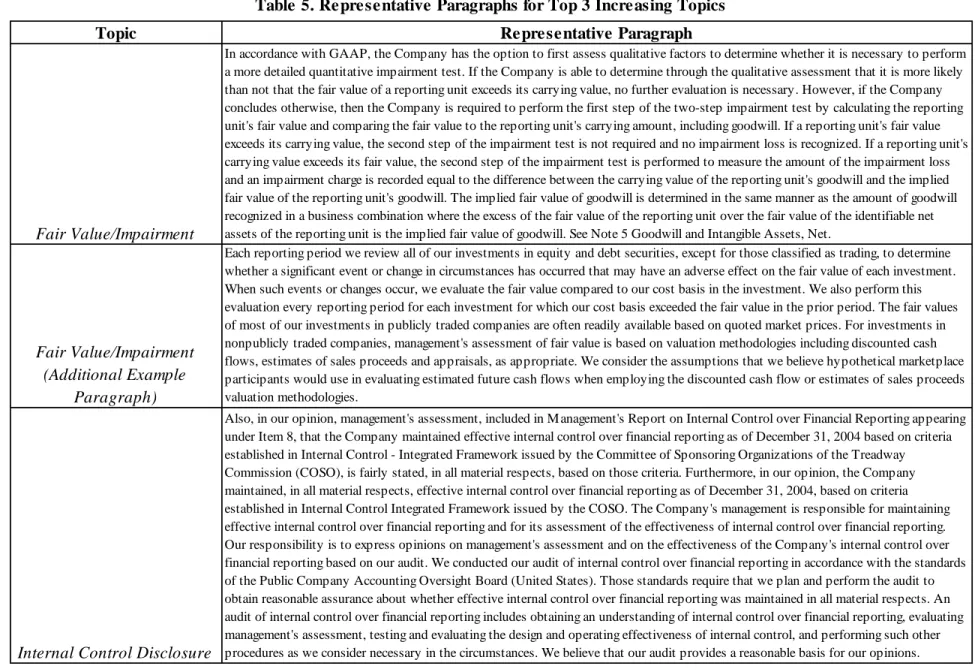
Because SFAS 157 is the most important standard to affect fair value accounting, we expect that much of the disclosure categorized under this topic will be related to that standard. In Table 5 we list the representative paragraphs for each of our Top 3 increasing topics, including the Fair Value/Impairment topic. The representative paragraph for this topic relates to the effect of fair values for evaluating goodwill impairment; in addition to establishing a framework for
measuring fair value accounting, SFAS 157 specifically amended SFAS 142 relating to goodwill impairment. Examination of paragraphs with a high loading of the fair value topic indicates that the grouping reflects fair value discussion on a range of topics including derivatives, investment
23 Note that “value” was excluded from the LDA procedure because it is extremely common; therefore, it cannot
securities, and other investments. Because the representative paragraph technique is inherently biased toward more standardized paragraphs (e.g., those that cite the relevant standards), we provide an additional sample paragraph to provide a more comprehensive view of the range of discussions that fall within this topic (additional sample paragraphs for all three topics are in the Internet Appendix). This paragraph discusses the use of fair values in yearly evaluations of debt and equity securities, also related to SFAS 157.
The next topic relates to internal control disclosure. This disclosure is easy to identify, with its top five words consisting of “control,” “internal,” “reporting,” “registrant,” and
“material.” The representative paragraph is the auditor’s opinion on management’s assessment of internal control, required under SOX Section 404, with an additional sample paragraph that is from management’s discussion of the effectiveness of their internal control system. Of all of our Top 3 topics, internal control disclosures tend to follow the wording of the associated standard most closely. As discussed later, this standardization is also reflected in the associated textual characteristics of internal control disclosure.
Our last main topic of interest is risk factor disclosure. The top five words in this topic are “results,” “future,” “ability,” “result,” and “adversely.” This type of language is consistent with risk factor disclosures that are intended to provide information on future events that might adversely affect firm performance. Disclosure under this topic is relatively broad as reflected in the fact that the representative paragraph describes the loss of key talent and personnel as a risk factor for the firm, while the additional paragraph discusses risks associated with possible security breaches.24 Although some firms disclosed risk factors voluntarily throughout our sample period, the SEC mandated this disclosure in Item 1A of the 10-K in 2005.
24 It is striking that LDA is able to identify risk factor disclosure as relating to the same topic irrespective of the
As further support that these three top increasing topics capture the type of disclosure that we have attributed to them, we identify specific firm attributes that should be associated with each of the three topics and link them with the length of these topics. In the case of Internal Controls, we expect significant additional text for firms with internal control weaknesses; for Fair Value/Impairments we expect additional text for firms with substantial one-time items, in particular impairments; and for Risk Factors we expect additional text for firms with substantial market risk.25 Results in Table 6 indicate that special items (including impairments), internal control weaknesses, and risk all have significant and predictable associations with their relevant disclosure topics.26 The Trend variable remains strong and positive for each topic, suggesting that changes in economic circumstance, as we measure them, do not explain the time trends.
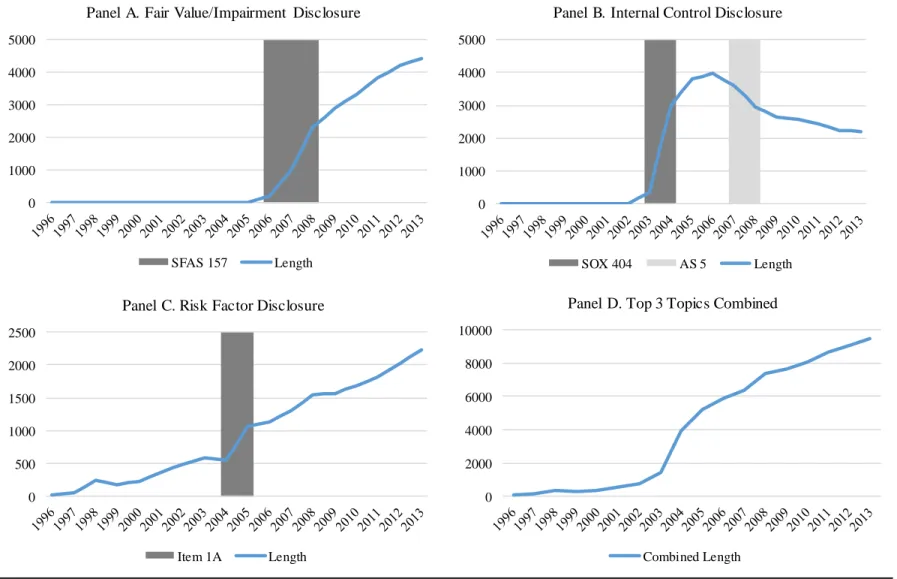
We investigate more closely the timing of these trends in fair value, risk factor, and internal control disclosure to assess patterns in these topics around the associated regulatory events and the probability that increases in these topics could explain increases in overall 10-K length. Figure 4 plots the trends for the top three increasing topics over time and provides evidence consistent with expectations. Panel A, which plots the length of the Fair Value topic is interesting for several reasons. First, recall that SFAS 157, “Fair Value Measurements,” was passed in 2006 and required for fiscal years beginning after November 15, 2007 (i.e., generally in fiscal 2008), with early adoption encouraged. That timeline is very consistent with the path of disclosure around 2006-2008, with virtually no disclosure for that topic pre-2007, an initial substantial increase during 2007 likely reflecting early adopters, and the bulk of the increase
25 We use overall return volatility as a measure of risk. Results are consistent if risk is measured based on beta
(Campbell et al., 2014) or firm-level litigation risk.
26
during 2008. The fact that the pattern is consistent with expectations is reassuring because it suggests that, while LDA is a naïve Bayesian approach to categorizing text, it can identify discussion associated with specific topics quite crisply irrespective of where it appears within a document. This is important because, although LDA has been applied in other contexts, it has not been used to identify text associated with specific accounting rules.
Second, and more importantly, the figure indicates that disclosure around SFAS 157 was a major source of additional length in the typical 10-K. Recall that the median length of the Compliance category in Figure 3 increased by about 10,000 words; in comparison, the increase in disclosure pertaining to SFAS 157 alone was nearly 4,300 words. It is also interesting to note that this increase does not appear to have been temporary. The text associated with this topic leveled out to some extent after the 2008 mandatory adoption date but continued to rise, albeit more gradually, through 2013, suggesting that additional disclosure was necessitated with application of the standard (and related guidance) over time.27
The second largest increase is due to disclosures concerning internal controls. Recall that SOX internal control certifications were required for fiscal years starting in 2004 and 2005. Panel B shows a distinct increase in disclosure for the LDA topic we label Internal Controls between 2004 and 2005, leveling off in 2006, suggesting that LDA correctly identified internal control disclosure. More importantly, Figure 4 suggests that internal control discussion is an important determinant of the increase in 10-K length, especially between 2004 and 2006. Unlike fair value disclosure which continued to increase in length, text associated with internal controls dropped somewhat between 2007 and 2008 before leveling off at about 2,100 words, down from
27
While the sharp increase in text around 2007 seems clearly related to the implementation of the new standard, the continued increase following 2007 could reflect additional implementation guidance or evolving economic
a high of 3,900 words in 2006. This drop coincides with the introduction of Auditing Standard 5 (AS5) by the PCAOB for fiscal years ending on or after November 15th 2007. Among other changes to auditing procedures, AS 5 allows the auditor to issue a combined report of its opinion on both the financial statements and the internal controls over financial reporting whereas
previously auditors were required to issue two separate reports.28
The third major source of the increased length is forward-looking disclosure associated with risk factors, depicted in Panel C. While not specifically required in the 10-K prior to 2005 (although required in prospectuses for debt and equity offerings), firms often provided risk factor disclosures voluntarily when they made forward-looking statements (Campbell et al., 2014; Nelson and Pritchard, 2016). Beginning in 2005, the SEC emphasized the importance of adequate risk factor disclosures and required that they be discussed in a separate section of the 10-K (Item 1A). As a result, we expect an increase in the discussion of risk factors throughout our sample period as SEC interest increased, but with a substantial increase around 2005 when the new rules became effective. The graph for the risk factor topic displays the predicted pattern, with a gradual increase through 2004 followed by a substantial jump in 2005 and a more gradual increase subsequent to 2005. Similar to fair values, the increase in disclosure around the effective date does not appear to have been temporary, with an increasing subsequent trend likely
reflecting the SEC’s continuing focus on implementation along with evolving economic circumstances. By 2013, median risk factor disclosure had increased by almost 2,300 words.
Figure 4 Panel D displays the sum of the three topics over time, which combine to explain an increase of almost 10,000 words. Further, there is a close similarity between the
28
We observe a similar decrease when examining only the subset of firms that never reported an internal control weakness, suggesting that a higher incidence of firms with internal control weaknesses around initial
increase in Compliance disclosure from Figure 3 and the sum of the three components in Figure 4 Panel D suggesting that those three factors explain the bulk of the increase in Compliance disclosure (which, in turn, explains most of the increase in total 10-K length).
Overall, the additional detail that our LDA analysis provides allows us to dig more deeply into the causes and content of the additional length in 10-K disclosure than would be possible with an analysis at the document- or section-level. Perhaps most notable is the extent to which, despite the number of additional SEC and FASB requirements during our sample period, the bulk of the increase in textual disclosure relates to three topics, two under the purview of the SEC and one under the purview of the FASB.29
VI. Do Changes in Topical Disclosure Length Reflect Disclosure Requirements?
A potential issue with the preceding results is that it is not possible to observe what firms would have disclosed in the absence of these changes in disclosure requirements. For example, it is possible that disclosure of risk factors, fair values, and internal controls would have increased irrespective of the requirements and that the new standards simply reflect changing demands for information. The patterns in Figure 4 provide some evidence on that point because the timing of the changes in disclosure coincides quite tightly with the changes in underlying requirements. In addition, the regressions in Table 2 suggest that the trends in textual attributes are robust to a wide variety of economic, regulatory, and litigation-related controls suggesting that general economic trends do not explain the increased length.30 However, it is possible that the relation between our textual attributes and economic determinants is not stable over time or that our analysis excludes important variables.
29 In the 1996-2009 period (up until the codification), for example, the FASB issued 44 pronouncements (not
including amendments), yet only one of them (SFAS 157) appears to explain the bulk of the increase in text length.
30 While the Table 2 results are estimated across all topics, Table 4 replicates the analysis at the specific topic level
An alternate approach is to consider a comparison sample of non-U.S. firms that were not subject to the same regulatory changes as our primary sample. Although non-U.S. firms
experienced some mandatory changes in fair value disclosure because the IASB issued IAS 39 on fair values around the same time that the FASB issued SFAS 157, they were not subject to the SEC risk factor and internal control disclosure requirements. As a result, we would not expect to see the same pattern in risk factor or internal control disclosure for a non-U.S. sample if new SEC reporting requirements, and not solely changes to fundamentals, drive our results.
To investigate that possibility, we analyze annual report textual disclosure for a sample of 16,038 non-U.S. firm-years from Lang and Stice-Lawrence (2015) and examine trends in
disclosure using our trained LDA model.31 Untabulated results suggest there is virtually no disclosure in the internal control or risk factor topics either prior to or subsequent to the change in U.S. regulations and no evidence of an increase over time. Consistent with changes in disclosure in response to IAS 39, disclosure in the fair value topic increases, especially during the 2006-2008 period, although the increase is not as large as for U.S. firms. Subject to the caveat that the non-U.S. sample may not be entirely comparable with the U.S. sample, these results suggest that the disclosure changes that we study in the U.S. sample, particularly those relating to risk factors and internal controls, likely primarily reflect changes in regulatory requirements.
VII. Does the Additional Text Contribute to Trends in the Other Textual Attributes?
Having documented that much of the increase in 10-K length appears to be a result of increases in specific topics associated with accounting and other regulatory action during the mid-2000s, we next investigate the textual characteristics of this additional disclosure. In
31 Our sample size is smaller than that in Lang and Stice-Lawrence (2015) because the date parsing process is
particular, do the same topics also help to explain the trends in other textual attributes documented in Figure 1?
As discussed in Section 2, we focus on a set of characteristics that prior research, standard setters, regulators, and financial statement users have identified as potential barriers to the efficient use of financial reports and investigate the extent to which our Top 3 topics explain the trends documented in Figure 1. An advantage of LDA is that we can apply it at the paragraph level to evaluate textual characteristics within subsets of text. Although the initial output of the LDA procedure does not identify where specific topics are discussed within each document, we use our trained LDA model to re-analyze each paragraph in the 10-K and estimate paragraph-level topic loadings (essentially the probability that the paragraph belongs to a specific topic) in a process called “inferencing.” We then assign the paragraph to the topic which has the highest loading.32 This allows us to assign all paragraphs to individual topics and thus measure the textual characteristics of disclosure relating to that topic.
Table 7 provides descriptive statistics for each of the categories (as well as for our Top 3 increasing topics) aggregated across all paragraphs within each category (topic). In particular, we measure the average amount of redundancy, Fog, specificity, relative mix of hard information, boilerplate, and stickiness. Redundancy, boilerplate, and stickiness are all expressed in
percentage terms so that the relative redundancy, boilerplate, and stickiness of disclosure can be directly compared across categories (topics) of different lengths.33 The broad category statistics in Table 7 are generally consistent with expectations.34
32
This classification procedure introduces noise because a given paragraph may discuss multiple topics, which would cause the textual characteristics for paragraphs assigned to a given topic to revert to the mean because some disclosure has been misclassified. We chose not to exclude paragraphs that might include multiple topics so that we can aggregate all of our statistics up to the document level, but we find similar (if not stronger) results when we instead impose a cutoff loading (probability) of 0.5 in order to categorize a paragraph as a specific topic.
33 To reduce noise, descriptive statistics for each topic (category) are only calculated for documents which have at
Comparing the Compliance category to all other categories (“Other Disclosure Categories” in Table 7), Compliance has substantially higher levels of boilerplate, Fog,
stickiness, and redundancy and lower levels of hard information and specificity. The fact that the Compliance category has disproportionally high levels of Fog, redundancy, boilerplate, and stickiness, as well as low levels of specificity and the proportion of hard information, coupled with the earlier finding that the proportion of the 10-K devoted to Compliance has increased substantially over time, suggests that the overall increase in these attributes could be the result of increases in the proportion of the 10-K representing Compliance disclosure.
In terms of the Top 3 increasing topics, which all fall within Compliance, the descriptive statistics suggest that internal control disclosures tend to have high levels of redundancy, Fog, boilerplate, and stickiness, in most cases higher than for any category, including other
Compliance disclosure. This is not altogether surprising because the disclosure requirements of Sarbanes-Oxley are fairly specific in terms of disclosure requirements, leading to high levels of boilerplate. Risk factor disclosures also tend to have high Fog and stickiness, and fair value disclosure has high stickiness. All three topics tend to have relatively low levels of specificity and the mix of hard information. The attributes of risk factor and fair value disclosures are more noteworthy because firms have more flexibility and disclosure is intended to convey timely firm-specific information. Overall, given the textual attributes of the Compliance category, and the Top 3 increasing topics in particular, their increasing prevalence in the 10-K could help to explain the overall trends in disclosure characteristics documented earlier.
proportion of negative, uncertain, and litigious words in paragraphs relating to each topic and category based on the Loughran and McDonald business words dictionary. These measures also behaved according to expectations for our categories and Top 3 topics (e.g., risk factor disclosure contains a relatively high amount of negative and uncertainty words, the Contracts & Legal category tends to use litigious words, etc.), providing additional assurance that our paragraph-level approach is effective at identifying paragraphs relating to particular topics.
34 For example, the Contracts & Legal category has a high mean level of redundancy and low levels of quantitative
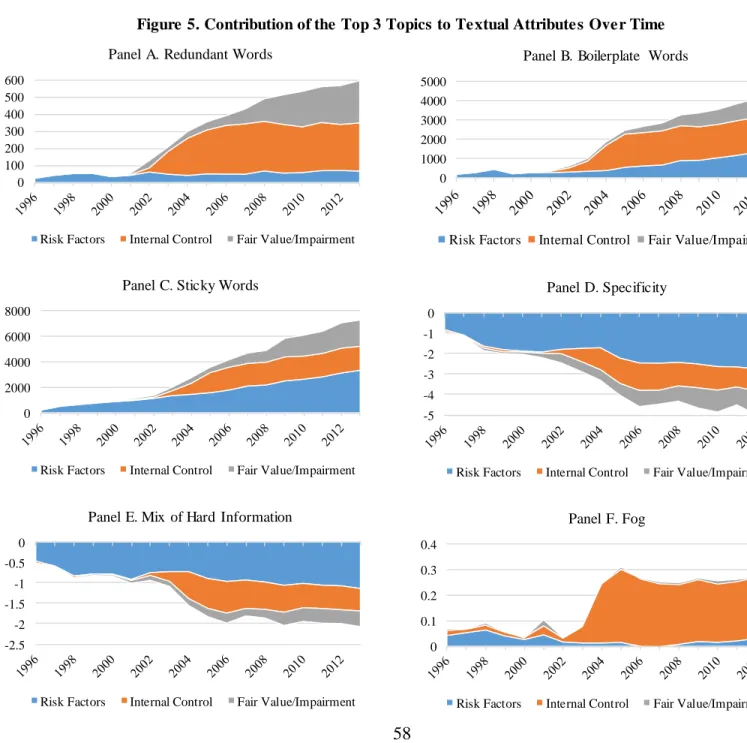
In Figure 5, we investigate the extent to which increases in fair value, risk factor, and internal control disclosure contribute to trends in other textual attributes. Recall from Figure 1 that Fog, boilerplate, redundancy, and stickiness have increased over our sample period while specificity and the relative mix of hard information have decreased. Because we can identify specific portions of the text relating to each topic, we can compare the levels of each of our textual attributes calculated using the entire text (including paragraphs relating to our Top 3 topics) to the attributes of the remaining text after paragraphs relating to the Top 3 topics are removed. Essentially this allows us to compare the actual trends to trends in the “counterfactual” text if those three topics had not been included. We plot the difference between attributes
calculated with and without our Top 3 topics in order to show the contribution of each of the Top 3 topics to trends in our set of textual attributes.
All three of our Top 3 topics help to explain the trends in disclosure attributes over our sample period. Internal control and fair value disclosure are more important drivers of
redundancy, while all three attributes contribute relatively equally to increases in the amount of boilerplate and stickiness. The increase in Fog, on the other hand, is largely explained by increases in internal control disclosure, consistent with the very high level of Fog in internal control disclosure documented in Table 7, particularly after the introduction of SOX in 2004.35 Similarly, all three topics are associated with the declines in specificity and the relative mix of hard information documented in Figure 1. These decreases are most pronounced for risk factors, consistent with these disclosures being particularly vague; however, both internal controls and fair values also contribute to these decreasing trends over time.
Overall, the results from this analysis provide strong evidence that the increase in length in the Top 3 topics discussed earlier also helps to explain the increases in redundancy,
boilerplate, stickiness, and Fog, as well as the decreases in specificity and the prevalence of hard information over our sample period. Further, the effects are consistent with the overall attributes of the topics from Table 7, and the time series of change by topic in Figure 4. Finally, the importance of each of the Top 3 topics varies across textual attributes, highlighting the
importance of evaluating the effects of a given topic in terms of specific attributes. This further illustrates the benefit of using LDA to understand topical content and underscores the importance of conducting additional research on these textual attributes to more fully understand their
implications for the usefulness of disclosure to financial statement users.
VIII. Cross-Sectional Variation
The preceding LDA analysis allows us to identify the sources of aggregate changes in disclosure length over our sample period for the median firm and link these changes in length to changes in other textual attributes. However, if there is heterogeneity in the extent to which new disclosure requirements affect firms, then focusing on changes for the median firm masks the potential spectrum of outcomes across firms. For example, if risk plays a large role in
determining how firms respond to disclosure requirements (e.g., high-risk firms disclose substantially more risk factors or provide extensive discussion of internal controls), then we might find that the median changes in disclosure that we document are not representative of disclosure changes for high- and/or low-risk firms. Similarly, cross-industry variation in fundamentals could affect the extent to which disclosure regulations are relevant.
separately examine firms in each Fama-French 17-industry grouping. While we report the results in the Internet Appendix for parsimony, there are two main takeaways.
First, our figures reveal expected diversity in disclosure attributes across economic partitions in the cross-section, further validating the ability of LDA to correctly identify meaningful topics. In particular, topics within the Industry Specific category become more prominent when the analysis is performed at the industry-level as one would expect. For
example, the industry grouping that includes pharmaceutical companies contains a large amount of disclosure relating to the Intellectual Property and R&D category, in particular clinical trials, while financial institutions tend to have more disclosure in the Loans, Debt, Banking category, in particular the topic Investment Activity. Similarly, high-risk firms tended to have high risk factor disclosure before it became mandatory. Firms in the top two risk quintiles had substantial risk disclosure before the introduction of Item 1A in 2005 and showed little response to the new regulation, consistent with high risk firms providing voluntary disclosure of risks before being required to do so (Nelson and Pritchard, 2016).36
Our second, more important, takeaway is that the length of the overall 10-K, the length of Compliance disclosure, and specifically length of our main increasing topics, is similar across firms in different industries, size quintiles, and risk levels. In each sub-analysis that we
conducted, Compliance-related disclosure comprises a major proportion of the total length and indicates comparable patterns of increases over our sample period. Relatedly, the Top 3 topics exhibited increasing trends around relevant disclosure regulations with patterns similar to those reported in Figure 4 across the size, risk, and industry groupings.
36