FUNCTIONAL CLASSIFICATION OF LONG NON-CODING RNAS
Jessime Kirk
A dissertation submitted to the faculty at the University of North Carolina at Chapel Hill in partial fulfillment of the requirements for the degree of Doctor of Philosophy in the Curriculum in
Bioinformatics and Computational Biology
Chapel Hill 2019
iii ABSTRACT
Jessime Kirk: Functional classification of long non-coding RNAs (Under the direction of J. Mauro Calabrese and Peter J. Mucha)
Long non-coding RNAs (lncRNA) play important roles in mammalian development and health. The relationships between lncRNAs’ sequences and their functions, however, are poorly understood. Unlike proteins, which often contain recognizable functional domain and are
evolutionarily conserved, lncRNAs lack significant linear sequence homology. To address this issue and enable the prediction of a lncRNA’s biological properties from its sequence, we developed a non-linear sequence similarity algorithm called SEEKR. SEEKR allows for the comparison of sequences based on the non-linear abundance of short motifs. These short motifs, or k-mers, may represent potential protein binding sites within the lncRNA.
We used SEEKR to form communities of similar lncRNAs from both human and mouse transcriptomes. We were then able to demonstrate that these communities predicted the
biological properties of the lncRNAs within a given community, including cellular localization and protein binding. We also show we can predict RNAs’ repressive activity in vivo using SEEKR.
Additionally, SEEKR provided evidence of similarity between certain pre-mRNA transcripts and known repressive lncRNAs. We hypothesized that some of these pre-mRNAs may have localized repressive capabilities. We demonstrated that pre-mRNAs are detectable at physiologically relevant levels in human cells and that some pre-mRNAs with repressive-like sequences may also interact with transcription regulating proteins in cis.
iv
v
ACKNOWLEDGEMENTS
This works was completed with the help of many other people. First, I would like to thank Mauro Calabrese, who initially came up with the idea for this work. More importantly, he has been as good of a mentor and leader as I could have hoped for. I would also like to thank the other members of the Calabrese lab, particularly Megan Schertzer and David Lee, who have made it a pleasure to go to work every day. Similarly, I would like to thank the other members of my committee, Peter Mucha, Tim Elston, and Alain Laederach, Daniel Dominguez, as well as Praveen Sethupathy, who have provided me with guidance and suggestions over the years.
I would like to thank all of my fellow graduate school friends who have fielded ideas, provided insights, participated in side projects, helped with homework, listened to grievances, shared milestones, and have been part of this journey. Additionally, I would like to thank all my other friends as well, who have provide laughs, adventures, endless inside jokes, dinner parties, and holiday celebrations, and generally provided me with a life outside of graduate school. I wish I could name you all here, but you know who you are.
vi
TABLE OF CONTENTS
LIST OF TABLES ... ix
LIST OF FIGURE ... x
LIST OF ABBRIVIATIONS ... xii
CHAPTER 1 ... 1
Introduction ... 1
1.1 Importance of bioinformatics models to genomic studies ... 1
1.2 Long non-coding RNAs ... 2
1.3 XIST as a model lncRNA ... 3
1.4 Inspiration from natural language processing ... 3
REFERENCES ... 5
CHAPTER 2 ... 6
2.1 Introduction ... 6
2.2 Results ... 7
2.2.1 Kmer-based quantitation as a means to compare lncRNA sequence content ... 7
2.2.2 LncRNAs can be partitioned into communities of related kmer content ... 10
2.2.3 Kmer content correlates with localization and protein binding ... 10
2.2.4 Similarities in lncRNA communities between organisms ... 14
2.2.5 SEEKR can predict Xist-like regulatory potential in lncRNAs ... 15
2.3 Discussion ... 19
2.4 Methods ... 20
vii
2.4.2 SEEKR ... 20
2.4.3 GENCODE lncRNA annotations ... 21
2.4.4 Conservation analysis ... 21
2.4.5 Hierarchical clustering and labeling ... 22
2.4.6 Clustering of known cis-activating and cis-repressive lncRNAs ... 22
2.4.7 Network analysis and lncRNA community definition ... 23
2.4.8 Comparing lncRNA groups in hierarchical clusters to lncRNA communities found by Louvain ... 24
2.4.9 LncRNA localization analysis... 24
2.4.10 lncRNA polysome association ... 25
2.4.11 lncRNA protein association data ... 26
2.4.12 Models of protein associations ... 26
2.4.13 Calculating the abundance of motif-matching kmers in lncRNA communities ... 27
2.4.14 Measuring kmer similarity surrounding motif matches in lncRNAs ... 28
2.4.15 Identifying motifs from eCLIP peaks ... 29
2.4.16 Human-to-mouse and human-to-other community similarity calculations ... 29
2.4.17 Generation of plasmids for TETRIS assays ... 30
2.4.18 Generation of TETRIS-lncRNA Cargo vectors ... 31
2.4.19 Estimation of TETRIS copy number per cell ... 32
2.4.20 TETRIS assays ... 32
2.4.21 Synthetic lncRNA design ... 32
2.4.22 Visualization of Xist structural models ... 33
2.4.23 TETRIS predictions for kmer sizes and subsets ... 33
viii
REFERENCES ... 65
CHAPTER 3 ... 69
3.1 Introduction ... 69
3.2 Materials ... 71
3.2.1 Hardware Requirements ... 71
3.2.2 Software Requirements ... 71
3.3 Methods ... 72
3.3.1 Comparing k-mer contents between a group of lncRNAs ... 72
3.3.2 Hierarchical clustering of lncRNAs by k-mer content ... 77
3.3.3 Identifying communities of lncRNAs with related k-mer contents ... 80
3.3.4 SEEKR Python ... 86
3.3.5 Scaling k-mer profiles by protein-binding motifs (Positional Weight Matrices) ... 87
3.3.6 Scanning lncRNAs for domains of related k-mer contents ... 91
3.4 Notes ... 96
REFERENCES ... 99
CHAPTER 4 ... 104
4.1 Introduction ... 104
4.2 Results ... 106
4.3 Methods ... 113
4.3.1 Creating transcript annotations ... 113
4.3.2 Measuring expression levels between unspliced and spliced RNA isoforms ... 114
4.3.3 Building communities ... 115
4.3.4 Visualizing communities in Gephi ... 117
ix
4.3.6 Calculating protein binding profiles ... 118
REFERENCES ... 128
CHAPTER 5 ... 129
x
LIST OF TABLES
Supp. Table 2.1 SEEKR similarities of functional lncRNAs... 37
Supp. Table 2.2 Human Louvain communities vs. hierarchical clusters... 38
Supp. Table 2.3 Mouse Louvain communities vs. hierarchical clusters ... 39
Supp. Table 2.4 Human community statistics ... 40
Supp. Table 2.5 Mouse community statistics ... 41
Supp. Table 2.6 Human 5mers vs. 6mers ... 42
Supp. Table 2.7 Human 7mers vs 6mers ... 43
Supp. Table 2.8 HSD tests for localization of polyA-selection in HepG2 ... 44
Supp. Table 2.9 HSD tests for localization of ribo-depletion in HepG2 ... 45
Supp. Table 2.10 HSD tests for localization of polyA-selection in K562 ... 46
Supp. Table 2.11 HSD tests for localization of ribo-depletion in K562 ... 47
Supp. Table 2.12 Polysome associated lncRNAs ... 48
Supp. Table 2.13 Protein binding motif counts in lncRNAs ... 49
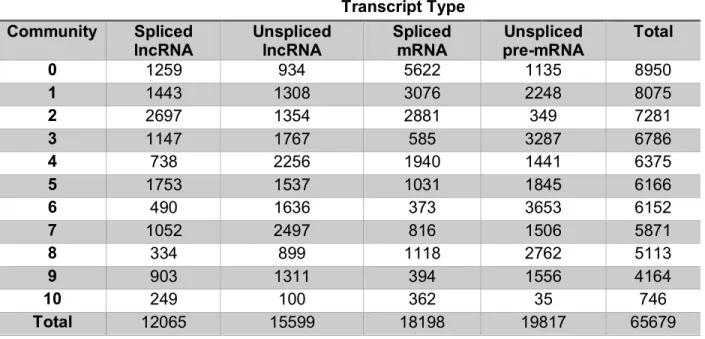
Table 4.1 Transcript type counts in communities ... 119
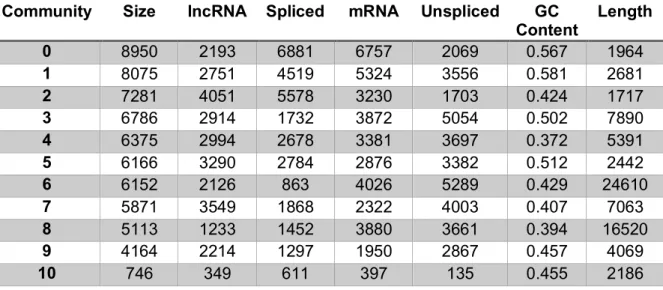
Table 4.2 Basic characterization of RNA communities ... 120
xi
LIST OF FIGURES
Figure 2.1 Overview and initial test of kmer-basedsequence comparison ... 50
Figure 2.2LncRNAs of related function often have related kmer contents ... 51
Figure 2.3 LncRNA localization and protein binding correlate with kmer content ... 52
Figure 2.4 Kmer content correlates with lncRNA repressive activity ... 53
Figure 2.5 Mapping of elements required for repression by Xist-2kb in TETRIS ... 54
Supplementary Fig. 2.1 ... 55
Supplementary Fig. 2.2 ... 56
Supplementary Fig. 2.3 ... 57
Supplementary Fig. 2.4 ... 58
Supplementary Fig. 2.5 ... 59
Supplementary Fig. 2.6 ... 60
Supplementary Fig. 2.7 ... 61
Supplementary Fig. 2.8 ... 62
Supplementary Fig. 2.9 ... 63
Supplementary Fig. 2.10 ... 64
Supplementary Fig. 2.11 ... 65
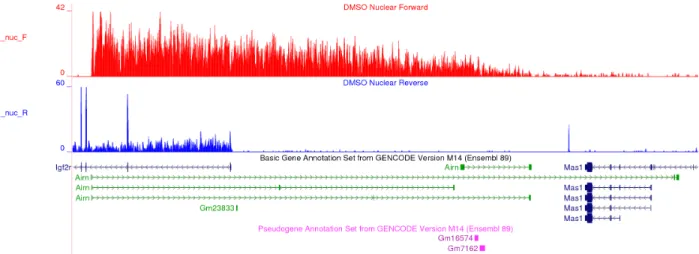
Figure 4.1 Airn provides an example of a misannotated unspliced transcript ... 122
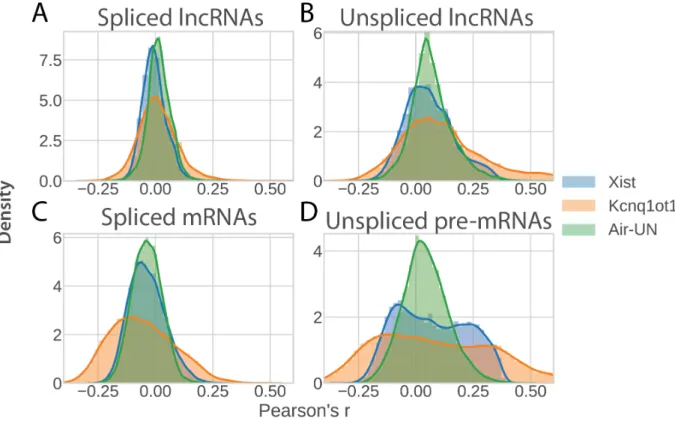
Figure 4.2 Repressive lncRNA SEEKR similarity to classes of RNA transcripts ... 123
Figure 4.3 Expression levels of classes of RNAs ... 124
Figure 4.4 Communities and clusters of RNAs ... 125
xii
xiii
LIST OF ABBREVIATIONS
ANOVA Analysis of VarianceCASP Community Wide Experiment on the Critical Assessment of Techniques for Protein Structure Prediction
CHAMP Convex Hull of Admissible Modularity Partitions CHIP Chromatin immunoprecipitation
eCLIP Enhanced cross-linking immunoprecipitation ENCODE Encyclopedia of DNA Elements
GTF Gene transfer format
H3K27me3 Histone H3 Lysine 27 trimethylation HSD Honestly significant difference HMM Hidden Markov Model
IQR Inner quartile range ITR Inverted terminal repeats
Kb Kilobase
lncRNA Long non-coding RNA LRT Likelihood ratio test
Mb Megabase
MFE Minimum free energy
mRNA Messenger RNA
NLP Natural language processing PWM Position weight matrix RPBP Reads per base pair RPKM Reads per kilobase million
SEEKR SEquence Evaluation from Kmer Representation
xiv
TETRIS Transposable element to test RNA’s effect on transcription in cis TRE Tetracycline Responsive Element
1
CHAPTER 1
Introduction
1.1 Importance of bioinformatics models to genomic studies
One of the key goals of bioinformatics as applied to genomics is to enable the prediction of the biological properties of a nucleotide sequence based solely on the contents of that
sequence. Specific sequence content determines secondary and tertiary structures of molecules. It regulates interaction partners with all other types of biomolecules. Ultimately, sequence determines the biological role of nucleic acids in both healthy and disease cells.
The inherent combinatorial complexity of genomic sequences makes the task of accurately predicting biological properties from sequence alone extremely challenging. The number of possible sequences for even very short nucleic acids—let alone the length of the human genome—is effectively infinite. Therefore, it is impossible to create a complete mapping of nucleic acid sequences to biological roles. Instead, an effective approach to understanding a given molecule’s cellular role is to build computational models which leverage knowledge of underlying biological principles to make predictions about the molecule.
2
domains and newly discovered sequences of interest, information which can be used to predict the function of the new sequence.
Despite the success in some sub-fields, other nucleic acid sequences of interest have proved more difficult to study.
1.2 Long non-coding RNAs
Long non-coding RNAs, or lncRNAs, are defined as RNA transcripts longer than 200 base pairs that do not code for a protein. This class of RNAs is found in all eukaryotic genomes, and tens of thousands of transcripts have been annotated in humans2. A large majority of these have never been studied in any meaningful way, yet several have been shown to play important roles in normal development while others have been implicated in various diseases3.
Even within the few lncRNAs with known functions, detailed mechanisms of action are generally unknown. Determining mechanisms is complicated by the significantly lower levels of evolutionary conservation of lncRNAs relative to mRNA4. It’s currently not possible to use a tool such as nhmmer to discover conserved functional domains within a given lncRNA. Besides conservation levels, this failure is also attributable to the fact that tools like nhmmer were
designed to study and take into account the biological roles of mRNA but do not do the same for other transcripts like lncRNAs.
3
Similarly, lncRNA “guides” may act by recruiting a protein at a specific time and place in the cell. An important recently discovered role for lncRNAs is transcriptional regulation. A given lncRNA, through a variety of mechanisms, may influence the expression levels of other
transcripts in the genome. A lncRNA, either while actively being transcribed or by interacting with proximal DNA shortly after transcription, could be localized to a specific genomic locus. This lncRNA could then influence the transcription levels of nearby loci by the recruitment of transcription factors that activate or repress transcription. By providing multiple protein binding sites throughout the sequence and localizing to a specific chromatic location, the lncRNA acts as a “guide” for some subset of RNA binding proteins.
1.3 XIST as a model lncRNA
The transcriptional repressor XIST is the most well characterized lncRNA due to its role in X-inactivation and is found in all placental mammals6. X-inactivation is the process by which mammalian females shut down one of their two X-chromosomes for gene dosage
compensation7. Proper XIST expression and function is necessary for X-inactivation, and XIST is required for silencing virtually all genes on the inactive-X. While X-inactivation is complex, involving many additional factors beyond XIST, and mechanistic details are still an area of active research, XIST provides a well-studied example of lncRNA activity.
Throughout this study, we used XIST as an approximate ground truth by which to compare other less studied lncRNAs of interest. Much of the work presented here is
generalizable to the lncRNA field at large, but, due to the convenience of XIST as a model for lncRNAs, we continually use XIST as a reference example.
1.4 Inspiration from natural language processing
4
introduction is described here, drawing off the similarity between our approach towards sequence analysis and a popular NLP technique known as a bag-of-words model8. Understanding the meanings or sentiments of a set of documents and their words is a common task in NLP. Examples include creating a summary of a document, classifying the tone of a tweet as “positive” or “negative”, or deciding if a given email should be sorted into spam. This last task (deciding if an email is spam) is analogous to deciding if an individual lncRNA should be classified as a potential repressor or not. Using a bag-of-words model, an email can be classified as spam by counting the word frequencies in the email. After counting all the words in the email, each word frequency can be normalized by the prevalence of its usage in the English language. The words “the” and “a” are likely two of the most common words in the email, but it is unlikely that their frequencies significantly deviate from standard usage. High frequencies of other words, such as “new”, “free”, “hurry”, “limited”, regardless of their exact position in the email or their grammatical context, are likely to indicate spam. This can be
measured by comparing the normalized frequency of these words to a set of emails known to be spam. On the other hand, an email which has high normalized word frequencies of “aunt”, “family”, “dog”, “baby”, again regardless of context, is more likely to be personal in nature. Analogously, counting and normalizing sub-sequences in a transcript of interest is a viable approach for providing biological insight into a lncRNA.
5
REFERENCES
1 Evans, R. et al. De novo structure prediction with deep-learning based scoring. in Thirteenth Critical Assessment of Techniques for Protein Structure Prediction (2018).
2 Iyer, M. K. et al. The landscape of long noncoding RNAs in the human transcriptome. Nat Genet 47, 199–208 (2015).
3 Wapinski, O. & Chang, H. Y. Long noncoding RNAs and human disease. Trends in Cell Biology 21, 354–361 (2011).
4 Johnsson, P., Lipovich, L., Grandér, D. & Morris, K. V. Evolutionary conservation of long non-coding RNAs; sequence, structure, function. Biochimica et Biophysica Acta (BBA) - General Subjects 1840, 1063–1071 (2014).
5 Wang, K. C. & Chang, H. Y. Molecular Mechanisms of Long Noncoding RNAs. Molecular Cell 43, 904–914 (2011).
6 Brown, C. J. et al. The human XIST gene: Analysis of a 17 kb inactive X-specific RNA that contains conserved repeats and is highly localized within the nucleus. Cell 71, 527– 542 (1992).
7 Penny, G. D., Kay, G. F., Sheardown, S. A., Rastan, S. & Brockdorff, N. Requirement for Xist in X chromosome inactivation. Nature 379, 131–137 (1996).
8 Zhang, Y., Jin, R. & Zhou, Z.-H. Understanding bag-of-words model: a statistical framework. Int. J. Mach. Learn. & Cyber. 1, 43–52 (2010).
6
CHAPTER 2
Functional classification of long non-coding RNAs by kmer content
2.1 Introduction
The human genome expresses thousands of lncRNAs, several of which regulate
fundamental cellular processes. Still, the overwhelming majority of lncRNAs lack characterized function and it is likely that physiologically important lncRNAs remain to be identified. Moreover, the mechanisms through which most lncRNAs act are not clear, limiting our understanding of the biology that they govern in cells 1-12.
A significant roadblock to progress remains the inability to detect recurrent relationships between lncRNA sequence and function. An understanding of analogous relationships in proteins has enabled the classification of protein families, functional domains, and mechanisms that, in turn, have led to discoveries that have improved the diagnosis and treatment of disease 13,14. However, with rare exceptions, the functions of lncRNAs are unrecognizable from
computational analyses and must be determined empirically 10-12,15-20. As a result, classification of function in one lncRNA often provides no information about function in others. For example, the Xist and Kcnq1ot1 lncRNAs both repress gene expression in cis (meaning on the same
7
cis-repressive lncRNA. This problem extends to the thousands of lncRNAs that lack
characterized functions.
2.2 Results
2.2.1 Kmer-based quantitation as a means to compare lncRNA sequence content
We hypothesized that lncRNAs with shared functions should harbor sequence similarities that confer the shared functions, even if conventional alignment algorithms do not detect the similarity. Our rationale follows. First, most lncRNAs likely have no catalytic activity, suggesting that the proteins they bind in cells define their function. Second, proteins often bind RNA through short motifs, or kmers, that are between 3 to 8 bases in length, where “k” specifies the length of the motif 23,24. Third, the mere presence of a set of protein binding motifs may be more important than their relative positioning within a lncRNA, meaning that functionally related lncRNAs could harbor related motif contents and still lack linear sequence similarity.
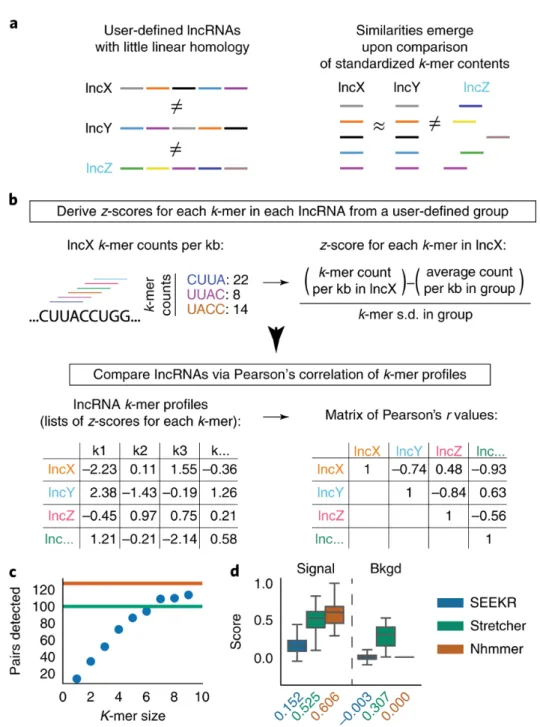
To test our hypothesis, we developed a method of sequence comparison, called SEEKR (SEquence Evaluation from Kmer Representation). In SEEKR, all kmers of a specified length “k” (i.e. k= 4, 5, or 6) are counted in one-nucleotide increments across each lncRNA in a user-defined group, such as the GENCODE annotation set 12. Kmer counts for each lncRNA are then normalized by lncRNA length and standardized across the group to derive a matrix of kmer profiles, which consist of z-scores for each kmer in each lncRNA. The relative similarity of kmer profiles between any pair of lncRNAs can then be determined via Pearson’s correlation (Fig. 1A, B; Methods).
8
than traditional alignment algorithms developed to detect linear sequence homology between evolutionarily related entities 21,22,25,26. Second, whereas traditional alignment algorithms can only quantify similarity, SEEKR can quantify similarities and differences using Pearson’s correlation. Third, SEEKR can quantify relationships in groups of lncRNAs despite differences in overall length, whereas length differences can confound traditional alignment algorithms. For example, conventional alignment of a 20kb and 4kb RNA is barely informative (80% of the 20kb RNA would not align), but their kmer contents can be compared via SEEKR. Lastly, SEEKR is algorithmically efficient; all pairwise comparisons between human GENCODE lncRNAs can be computed in under a minute.
Initially, we assessed whether SEEKR could detect previously identified sequence similarities in lncRNAs. We compared kmer profiles via SEEKR for all pairwise combinations in a set of 161 lncRNAs recently described to be conserved between human and mouse 27. We also aligned the lncRNAs to each other using two existing alignment algorithms, the hidden Markov model based nhmmer 21, and Stretcher, an implementation of the global alignment algorithm Needleman-Wunsch 22. In this test, SEEKR detected known lncRNA homologues nearly as well as or better than both algorithms (Fig. 1C). We defined signal to background in this assay as the ratio between the median similarity of homologous and non-homologous lncRNAs. By this metric, nhmmer detected homologues the most clearly, as expected (signal-to-background ratio of 0.606 : 0.000), followed by SEEKR (signal-to-background of 0.152 : -0.003 at kmer length k=6), and Stretcher (signal-to-background of 0.525 : 0.307; Fig. 1D). We conclude that kmer-based classification can detect sequence similarity between evolutionarily related lncRNAs.
9
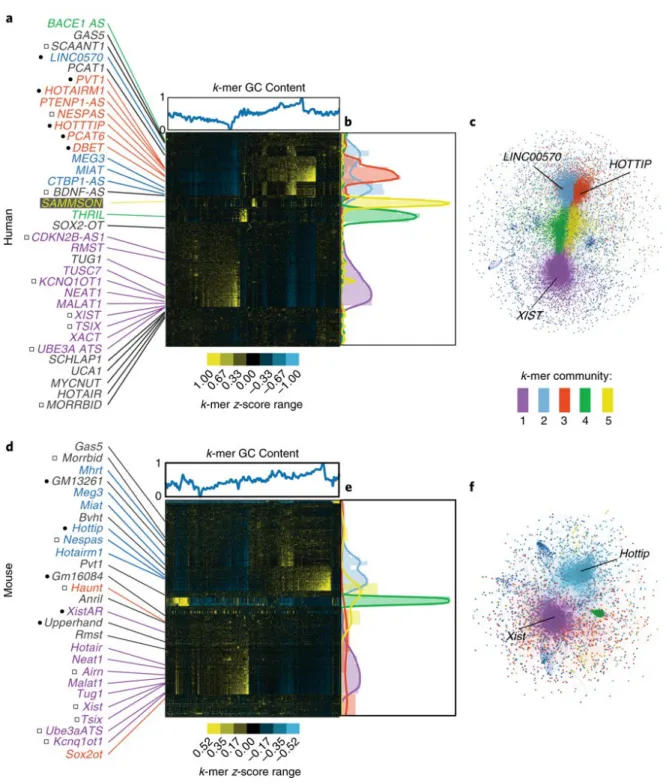
correlation and hierarchically clustered the resulting matrices to examine the patterns that emerged. Consistent with our hypothesis, clustering lncRNAs by SEEKR grouped many by known function in human and mouse (Fig. 2). Several known cis-repressive lncRNAs, including XIST, TSIX, KCNQ1OT1, UBE3A-ATS, ANRIL/CDKN2B-AS1, and Airn clustered together due to high
abundance of AU-rich kmers, whereas several cis-activating lncRNAs, including PCAT6, HOTTIP, LINC00570, DBE-T, and HOTAIRM1, clustered separately due to high abundance of GC-rich
kmers (Figs. 2A and D). These patterns were robust over differing kmer lengths (Supplementary Fig. 2). To determine if this level of clustering was significant, we curated lists of human and mouse cis-activating and cis-repressive lncRNAs from the literature (Supplementary Table 1), and compared average pairwise kmer similarities between lncRNAs in each list to pairwise similarities of 10,000 size-matched lists of randomly selected lncRNAs from the respective organism. Human and mouse cis-repressors, and human cis-activators (but not mouse cis-activators), were significantly more similar to each other than expected by random chance (Supplementary Table 2). Concordantly, SEEKR detected significant similarity between the cis-repressive Kcnq1ot1 and Xist lncRNAs where none was found by conventional alignment algorithms (Supplementary Fig. 1). We conclude that lncRNAs of related function can have related kmer profiles even if they lack linear sequence similarity.
10
2.2.2 LncRNAs can be partitioned into communities of related kmer content
We next used a network-based approach to partition lncRNAs into communities of related kmer profiles, reasoning that such communities would provide a framework to understand the predictive value of lncRNA kmer content. We created networks of relationships between all human and mouse lncRNAs in which weighted edges connected lncRNAs in an organism if the Pearson’s correlation between their standardized kmer profiles met a threshold for similarity (Methods). We then used the Louvain method to assign lncRNAs within the largest connected component of the network representations to communities of related kmer profiles 34.
Approximately half of all GENCODE lncRNAs grouped into five major communities in both human and mouse. LncRNAs not assigned to the five most populated communities were assigned to a “null” community. Our network-based approach and hierarchical clustering grouped lncRNAs in similar ways (p < 1e-324, Chi-squared; Supplementary Tables 3 and 4), signaling community robustness. LncRNA community assignments and associated summary statistics are provided in Supplementary Tables 5-12 and Supplementary Fig. 3. Differences in human and mouse community structures may be due in part to differences in completeness of lncRNA annotation. In the versions of GENCODE used for this work, there were about twice as many lncRNAs annotated in human (v22, n=15953) as there were annotated in mouse (vM5, n=8245 12).
2.2.3 Kmer content correlates with localization and protein binding
We next examined whether lncRNAs with related kmer profiles shared biological properties. For this analysis, we focused on human lncRNAs, where data from the ENCODE project
transcriptome-11
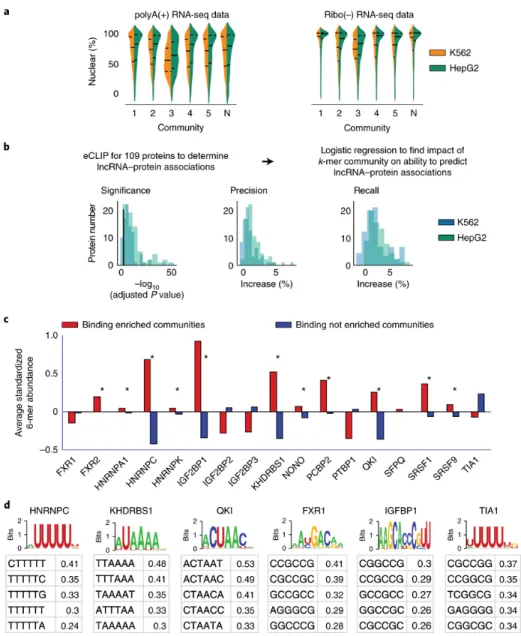
wide. To determine whether kmer content provides information about lncRNA localization, we examined ENCODE subcellular fractionation RNA-Seq experiments performed in HepG2 and K562 cells 35. For each lncRNA expressed in each cell type, we computed its nuclear ratio and determined whether the distributions of nuclear ratios differed between communities. The majority of communities showed slight but significant differences in their distribution of nuclear ratios, with the largest differences found between communities #1 and #3 (Fig. 3A and
Supplementary Tables 13-16). Concordantly, lncRNAs that associate with polysomes in K562 cells 36 were also non-uniformly distributed between communities (p = 3.5e-5, Chi-squared), and were the most over- and under-represented in the most cytoplasmic and nuclear lncRNA
communities, respectively (communities #3 and #1 being the most cytoplasmic and nuclear, respectively; Supplementary Table 17). Lastly, we used ENCODE data to identify the most cytoplasmic and nuclear lncRNAs in HepG2 and K562 cells and determine which kmers were asymmetrically distributed between lncRNAs in the two compartments. 360 and 27 kmers were significantly enriched in cytoplasmic and nuclear lncRNAs, respectively (p-adjusted <0.05; Kolmogorov–Smirnov test; Supplementary Table 18). Consistent with our RNA-Seq and polysome analyses, 58 and 93% of the cytoplasmic- and nuclear-biased kmers were the most enriched in the most cytoplasmic and nuclear lncRNA communities, respectively (communities #3 and #1; Supplementary Table 18, last column). We conclude that kmer content provides information about the subcellular localization of a lncRNA.
To determine if kmer content provides information about protein binding in lncRNAs, we examined ENCODE data for 156 eCLIP experiments performed for 109 proteins in HepG2 and K562 cells 37. We created binary vectors for each experiment that recorded whether the
lncRNAs bound or did not bind a given protein, then built separate logistic regression models for each protein to determine if kmer community assignments could improve prediction of
12
as covariates. LncRNA community assignments significantly increased the log-likelihood of detecting lncRNA/protein associations for the majority of proteins examined (p-adjusted <0.05;146/156, ~94%; Fig. 3B and Supplementary Table 19). Increases in precision and recall in community-informed models were generally modest but significant (Fig. 3B and
Supplementary Table 20). In total, ~17% (25/146) of our models had an increase in precision and/or recall of 5% or more. Notably, in all cases in which recall increased, precision also increased, indicating that kmer community information increased the ability to predict true lncRNA-protein associations and simultaneously increased the fidelity of those predictions. When we used individual 6mers instead of lncRNA communities as predictive features, results were no better than the null model that used only lncRNA length and expression as predictive features. Models with more features than samples are prone to learning noise in their training set, and often lose predictive power, due to overfitting 38. Using individual 6mers brought the number of features being evaluated to 4099, more than the number of lncRNAs expressed in HepG2 and K562 cells (3745). We conclude that kmer content provides information about the protein-binding potential of a lncRNA, but that no single kmer provides an overwhelming portion of that information, and, that kmer communities provide a way to collapse high-dimensional kmer matrices down to representative variables for predictive purposes.
13
matches to binding motifs of the 17 proteins in Fig. 3C, whose position weight matrices were determined from biochemical assays in 23. We annotated motif matches that fell inside and outside of CLIP peaks as true and false positive matches, respectively. As expected, the majority of motif matches fell outside of CLIP peaks (i.e., they were false positive matches; Supplementary Table 21). We then used SEEKR to compare regional kmer content in 300 nucleotide windows surrounding true and false positive motif matches. Remarkably, for 13 of 17 proteins examined, kmer profiles of true positive binding regions were more similar to each other than kmer profiles of randomly selected, size-matched sets of false positive regions (p-value < 0.005; Supplementary Fig. 4). These data support the notion that binding modules for the same protein in different RNAs often have sequence similarity that extends beyond the protein binding motif, and that this similarity can be quantified, in part, by local kmer content.
Moreover, SEEKR provides a simple way to visualize the density of specific kmers within CLIP enriched regions. We compared the most overrepresented kmers in true positive binding regions to protein binding motifs measured in vitro 23, and found that their relationships differed substantially from protein to protein (Fig 3D and Supplementary Fig. 5). For certain proteins, such as HNRNPC, KHDRBS1, and QKI, the most enriched kmers in true positive regions matched the PWM for the protein that was determined in vitro 23. We interpret this observation to mean that for these proteins, motif density plays a dominant role in determining RNA binding in vivo, because our kmer data show that motif-matching kmers are more abundant in true
14
used to augment traditional motif-based analyses and provide insights into mechanisms of RNA-protein interaction. SEEKR provides a way to quantify sequence similarities between any number of protein binding regions, which in turn, can provide predictive power and identify shared characteristics that are not apparent from PWM-based motif analyses.
2.2.4 Similarities in lncRNA communities between organisms
Given (i) that kmer content provides some indication of protein binding potential in a lncRNA, (ii) that sequence specificities of many RNA binding proteins are conserved 23,24, and (iii) that protein binding likely dictates lncRNA function, we hypothesized that kmer contents between communities of functionally related lncRNAs could be conserved even if the lncRNAs themselves lack known evolutionary relationships. In support of this idea, we identified
15
2.2.5 SEEKR can predict Xist-like regulatory potential in lncRNAs
We next directly tested whether kmer profiles could be used to predict lncRNA regulatory potential. We focused on the ability of certain lncRNAs to repress transcription in cis. Cis-repression was one of the earliest characterized functions of lncRNAs, and is essential for normal human health and development. In the most striking example, the XIST lncRNA silences nearly all genes across an entire chromosome during X-chromosome Inactivation 7.
Cis-repression is also one of most straightforward lncRNA functions to study because, by definition, cis acting lncRNAs act near their site of transcription.
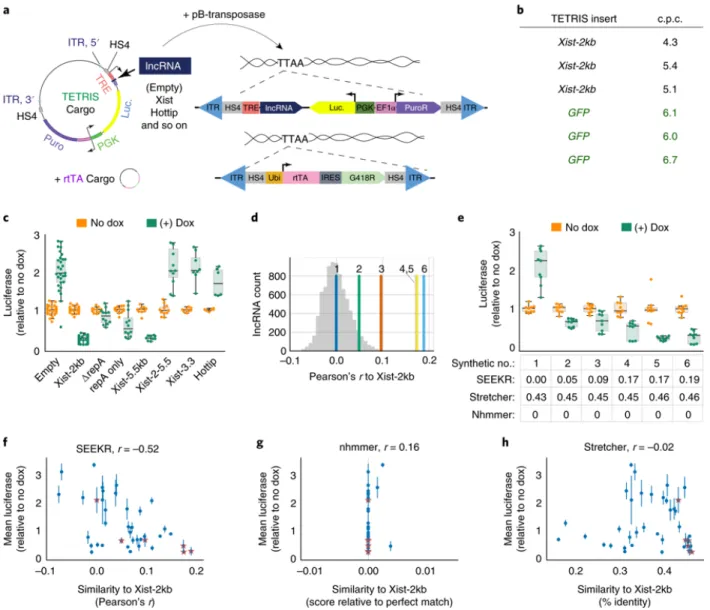
We developed a reductionist assay to study lncRNA cis-repressive activity in a normalized genomic context, called TETRIS (transposable element to test RNA’s effect on transcription in cis). TETRIS enables the sequence of a lncRNA and an adjacent reporter gene to be
manipulated in a plasmid, but then rapidly inserted into chromosomes via the piggyBac transposase 42,43, so that effects of the lncRNA on the reporter can be studied in genomic chromatin (Fig. 4A and Methods). Under our assay conditions, piggyBac catalyzes 4-7 insertions of each cargo per stably selected cell, and cell density estimates suggest between 100,000 to 500,000 cells receive insertions and survive selection (Fig. 4B and not shown). Thus, each TETRIS assay likely surveys 400,000 to 3.5 million insertion events. Insertion-site
dependent variation in lncRNA-induced effects are averaged out in the population, bypassing the need to isolate clones of modified cells, and providing the means to quantify lncRNA regulatory potential without influence from genomic position.
16
baseline for the assay (Fig. 4C). We attribute this mild activation to the close proximity of the dox-inducible and luciferase promoters, and to the fact that both promoters are contained within the same insulated domain 44.By contrast, expression of the first 2kb of Xist repressed
luciferase 5-fold relative to uninduced control (Fig. 4C). The 2-fold activation and 5-fold repression were stable across nine and 16 independent derivations of TETRIS-Empty and TETRIS-Xist-2kb cell lines, respectively (mean ± standard deviation of 2.03 ± .50 and 0.23 ± .08), demonstrating that TETRIS assays result in reproducible effects on luciferase activity. For its repressive effect, Xist requires “Repeat A,” a 425-nucleotide long element contained within its first 2kb 45. In the context of TETRIS, deletion of Repeat A resulted in a significant, but not complete, de-repression of luciferase, whereas expression of Repeat A alone resulted in repression relative to control, but at reduced levels compared to Xist-2kb (“∆repA” and “repA only”; Fig. 4C). Similarly, expression of the first 5.5kb of Xist caused a 5-fold repression of
luciferase, whereas deletion of the first 2kb from the 5.5kb construct caused complete loss of repressive activity (“Xist-5.5kb” and “Xist-2-5.5”; Fig. 4C). Expression of either the final 3.3kb of Xist or the Hottip lncRNA had no repressive effect (Fig. 4C). These experiments demonstrate (i)
that TETRIS is a suitable assay to measure repression by cis-acting lncRNAs in a normalized genomic context, and (ii) in the assay, sequence elements in addition to Repeat A cooperate to encode repressive function in the 5´ end of Xist.
17
similarity for all mouse lncRNAs (a Pearson’s r of 0.19, more similar to Xist-2kb than all other lncRNAs the mouse genome; Fig. 4D). Using nhmmer or Stretcher to align the synthetic lncRNAs to the first 2kb of Xist produced either no alignments (nhmmer) or alignments that differed by only three percent across all six synthetic lncRNAs (Stretcher; Fig. 4E, grid below graph). Via BLAST, the lncRNAs had no significant similarity to the mouse genome or to each other (not shown). The lack of informative alignments was expected because the synthetic lncRNAs have no evolutionary relationship with Xist, any region in the genome, or each other. Nevertheless, as envisioned, the synthetic fragments that SEEKR classified to be most similar to Xist had the highest repressive activity (Fig. 4E). These data directly demonstrate that evolutionarily unrelated lncRNAs can encode similar function through different spatial
arrangements of related sequence motifs. Thus, kmer content can be used to predict lncRNA regulatory potential.
We next examined whether SEEKR could predict Xist-like repressive activity in endogenous lncRNAs. We cloned into TETRIS thirty-three lncRNAs or lncRNA fragments that had a range of kmer similarities to the first 2kb of Xist. Included in our final set of fragments were several conserved lncRNAs and/or shorter fragments contained within them (Airn, Hottip, Kcnq1ot1, Malat1, Neat1, and Pvt1), as well as many lncRNAs with uncharacterized functions
18
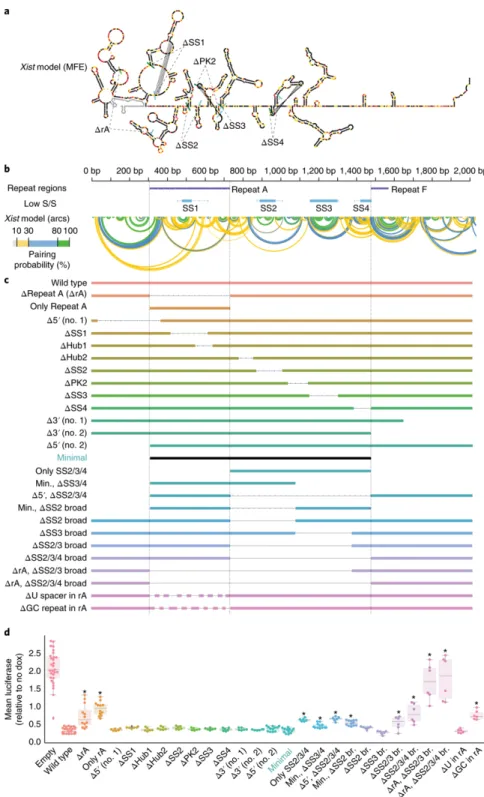
Lastly, we examined whether kmer profiles associated with sequence elements required for repression by Xist-2kb might increase our ability to predict repressive activity in other lncRNAs. To determine the elements in Xist-2kb required for repression, we made a series of 26 deletions (Fig. 5). Surprisingly, 15 of the deletions, including ones that removed predicted stable
structures, pseudoknots, and ~40% of Repeat A (“∆SS1”, “∆SS2”, “∆PK2”, “∆SS3”, “∆SS4”; bottom panel in Fig. 5; 41), had no significant effect on repression. However, removal of all eight GC-rich portions of Repeat A, but not its U-rich linkers, caused a ~3-fold reduction in repression (“∆GC repeat in rA” vs “∆U spacer in rA”), as did removal of three predicted stable structures and their intervening sequences in the 742 nucleotides immediately downstream of Repeat A (“∆SS2/3/4 broad”; 41). Co-deletion of Repeat A and the stable structures had an additive effect, causing a near complete loss of repression (the “∆rA∆SS234 br.” mutant), whereas expression of Repeat A or the stable structures alone had half the repressive potency of Xist-2kb (“Only rA” and “Only SS234”). Expression of both regions together had the same repressive potency as Xist-2kb (“Minimal”). Thus, in TETRIS, the major elements required for repression are contained
19
may be a broadly effective search tool to identify such similarities (not too relaxed, not too stringent).
2.3 Discussion
Collectively, our data support the notion that many lncRNAs function through recruitment of proteins that harbor degenerate RNA binding motifs, and that spatial relationships between protein binding motifs in these lncRNAs are often of secondary importance to the concentration and effectiveness of the motifs themselves. By this logic, a lncRNA may merely need to present the appropriate motifs embedded within the appropriate structural contexts to achieve a specific function. Thus, different lncRNAs likely encode similar function through vastly different
sequence solutions, and nonlinear sequence comparisons can be used to discover similarities between them. By extension, because the RNA binding motifs of many proteins are conserved 23,24, it is likely that groups of lncRNAs rely on similar motifs to encode related function in different organisms even though they lack direct evolutionary relationships. This concept is supported by our observation that lncRNA communities with related kmer contents exist in human, mouse, and other organisms. We propose that nonlinear sequence homology – in which the relative abundance of a set of protein binding motifs is conserved, but the sequential
20 2.4 Methods
2.4.1 Kcnq1ot1 versus Xist comparison
Kcnq1ot1 was aligned to Xist using nhmmer and Stretcher with default parameters. To
assess significance of the alignments, we generated 1,000 pseudo-Kcnq1ot1s that were the same length of real Kcnq1ot1 but composed of nucleotides randomly selected from a
distribution of the mononucleotide content of Kcnq1ot1 (0.335 A: 0.205 G: 0.202 C: 0.258 T). We then aligned the pseudo-lncRNAs to Xist with nhmmer and Stretcher as well as compared their kmer contents relative to all other mouse lncRNAs at kmer length k=6 via SEEKR.
2.4.2 SEEKR
In SEEKR, a matrix of kmer counts for a user-defined set of lncRNAs is created by counting all occurrences of each kmer in each lncRNA in one-nucleotide increments, and then dividing those counts by the length of the corresponding lncRNA. Z-scores are then derived for each kmer in each lncRNA by subtracting the mean length-normalized abundance of each kmer in the group of lncRNAs being analyzed from the length-normalized abundance of the kmer in the lncRNA in question, and then dividing that difference by the standard deviation in abundance of that kmer in the group of lncRNAs being analyzed. We refer to the array of z-scores for each kmer in a given lncRNA as its kmer profile. Similarity between any two lncRNAs can be calculated by comparing their kmer profiles with Pearson’s correlation.
21
normalization is important is supported by studies of known cis-repressive lncRNAs. At 18kb, the Xist lncRNA is the most potent repressive lncRNA known. At least three other known cis-repressive lncRNAs are longer than Xist, but less potent: Airn, Kcnq1ot1, and Ube3a-ATS, are 90kb, 85kb, and 1.1Mb, respectively 7. Of these, the longest lncRNA, Ube3a-ATS, is the least potent, arguing that length alone does not account for lncRNA potency. In certain biological contexts, lncRNA length may not be relevant, or it may have varying influence on lncRNA function. However, what these contexts might be and to what extent length does or does not affect lncRNA function in them are not known and difficult to predict. We also note that
Pearson’s correlation inherently normalizes for length. Thus, comparisons of kmer content that use Pearson’s correlation will eliminate length as a variable.
2.4.3 GENCODE lncRNA annotations
All GENCODE annotations used in this work were from human build v22 and mouse build vM5 12. For each lncRNA, only the major splice annotation was considered (the -001 isoform). In total, there were 15953 human and 8245 mouse transcripts. The heat maps in Fig. 2 were generated with GENCODE annotations plus the additional lncRNA sequences downloaded from the UCSC genome browser 47: SAMMSON, XACT, UBE3A-ATS, MORRBID, and NESPAS, (Human), and unspliced Airn, Anril, Bvht, Haunt, Morrbid, unspliced Tsix, Ube3a-ATS, XistAR, and Upperhand (Mouse).
2.4.4 Conservation analysis
22
the 161 homologue-to-homologue measurements in each of the three algorithms; likewise, background values were computed as the mean of the remaining 12880 non-homologous comparisons. Homologous pairs were defined as being “detected” if the signal value/average similarity (as determined via SEEKR, nhmmer, or Stretcher) was higher for homologue-to-homologue measurements than it was for all other lncRNA-to-non-homologue-to-homologue comparisons. For this analysis, nhmmer was downloaded as part of the HMMER package (URLs) and was run with --nonull2, --nobias, --noali, and -o flags set. Stretcher was used as part of Biopython (URLs) and was run with --gapopen=16, and –gapextend=4.
2.4.5 Hierarchical clustering and labeling
Hierarchical clustering was performed with the R package “amap” using Pearson’s as a distance metric and average linkage 48, and was visualized with Java Treeview 49. We used kmer length k=6 for our main analyses because it performed well in evolutionary comparisons (Fig. 1C), and it provided a feature number (4^6 = 4096 features) that is only marginally larger than the average length of a GENCODE lncRNA (1152 and 1471 nucleotides for human and mouse lncRNAs, respectively).
2.4.6 Clustering of known cis-activating and cis-repressive lncRNAs
We performed a literature review to curate lists of experimentally verified cis-repressive and cis-activating lncRNAs in mouse and human (Supplementary Table 1). We calculated the mean
pairwise similarity between all lncRNAs in each of these groups, and compared those means the distribution of mean similarities calculated from pairwise comparisons of 10,000 randomly selected, size-matched groups of lncRNAs in their respective organism to generate p-values that describe the likelihood that the similarity observed between the functionally related cis-acting lncRNAs was greater than would have been expected from random chance
23
2.4.7 Network analysis and lncRNA community definition
Networks of lncRNAs were formed from a weighted adjacency matrix in which edges between any two lncRNAs were kept only if their Pearson’s r-value was at least 0.13. We selected the lncRNAs within the largest connected component of this network representation and used the Louvain algorithm 34 at default resolution parameter to assign lncRNAs to
communities of related kmer profiles (using the Python package "louvain-igraph"). This decision was supported through use of the recently developed CHAMP algorithm 50 (URLs), which found a wide domain of optimality around the default resolution parameter. We retained assignments for the lncRNAs present in the top five most populated communities, and assigned the
remaining lncRNAs, including those not found in the largest connected component of the network representation, to the “null” community, which served as an important outgroup for our comparisons of kmer content and biological properties in Fig. 3. Multiple Pearson’s r value thresholds between 0.12 and 0.21 were tested for human lncRNAs and we found little to no difference in community definition, correlation with lncRNA localization, or ability to predict protein-binding patterns (not shown). Gephi was used for network visualization (URLs). Community colors were automatically assigned by Gephi according to the size of each community.
24
the computational inefficiency of performing operations on matrices of 7mers or greater provided additional support for our decision to use 6mers for the bulk of our analyses.
We applied the same r-value threshold and community assignment logic that we used for human lncRNAs to define lncRNA communities using kmer length k = 6 in all other organisms.
2.4.8 Comparing lncRNA groups in hierarchical clusters to lncRNA communities found by Louvain
Clusters of lncRNAs with similar kmer content in human and mouse (from Fig 2.) were created by manually making cuts in the dendrogram of the hierarchical clusters that maximized the visual similarity of kmer profiles between lncRNAs in each cluster. Five cuts were made in the hierarchical cluster from each organism to approximate the five major communities found by the Louvain algorithm. We measured the similarity of the manually made clusters to the five major Louvain-defined communities by a creating contingency table that compared lncRNA distributions between the two methods. We then tested if the distribution of lncRNAs across the two sets of communities were significantly similar via a chi-squared test. In both human and mouse, the p-value was < 1E-324 (Supplementary Table 3 and 4).
2.4.9 LncRNA localization analysis
Localization data were downloaded from ENCODE (URLs) as fastq files and aligned to GRCh38 with STAR using default parameters 47,51. FeatureCounts was used to tabulate the number of reads aligning to our set of lncRNAs 52. We then filtered out all lncRNAs with <0.1 RPKM from each community, and calculated the number of reads in the nuclear fraction over the total number of reads from both the nuclear and cytosolic fractions for each lncRNA.
25
not normally distributed (Fig. 3A), we needed to employ different thresholds to define cytosolic and nuclear so that the two groups would include similar numbers of lncRNAs. “Cytosolic” lncRNAs were defined as any lncRNA that was more than 50% cytosolic, which resulted in 2801 transcripts, and “nuclear” lncRNAs were defined as any lncRNA that was more than 95%
nuclear, which resulted in 4576 transcripts. To determine the average difference in kmer abundance between lncRNAs in the two compartments, we calculated the mean value of the z-scores for each kmer in each group, and then used the difference between the means as the metric to calculate the nuclear-enrichment score (Supplemental Table 18). To test for significant differences between the distributions of z-scores between lncRNAs in the two compartments, we used a KS-test and calculated an adjusted p-value using a Bonferroni correction. This analysis yielded 387 kmers whose distributions differed significantly between cytosolic and nuclear lncRNAs (p-value < 0.05; Supplemental Table 18).
Using only the lncRNAs from community 3, we repeated the process of applying the Louvain algorithm to define communities and measure cellular localization in order to rule out the
possibility that potential sub-communities were responsible for the cytosolic nature of community 3. The Louvain algorithm found four main communities and all smaller sub-communities were grouped into a fifth community. The results of ANOVA tests indicated there was no significant differences between any of the communities for either the polyA-selected or ribosome-depleted RNA RNA-Seq data. We performed this analysis again for community 1, but no sub-communities were found to be significantly different (Supplementary Fig 11). This uniformity of cellular localization among possible sub-communities provides biological support for our original community definitions.
2.4.10 lncRNA polysome association
26
between the communities (p-value = 3.5E-5; Supplementary Table 17). The expected values for the chi-squared test were calculated by filtering all communities for lncRNAs expressed in K562 cells, dividing the number lncRNAs in each community by the total number of expressed
lncRNAs (3277), and multiplying by the number of polysomal lncRNAs (229).
2.4.11 LncRNA protein association data
eCLIP data were downloaded from ENCODE 35,37. For each of the 156 eCLIP experiments "bed narrowPeak" data (representing sites of protein binding that passed a ENCODE-defined threshold for enrichment over background; 35,37) were pooled from available biological
duplicates. Genomic coordinates were overlapped with lncRNA exon coordinates annotated by GENCODE. Any lncRNA which overlapped with one or more eCLIP peak was considered as having a true binding interaction with the given protein. LncRNA expression data were collected from ENCODE RNA-Seq experiments in the same cell type as that of the eCLIP experiment (HepG2 or K562).
For each protein, a vector was built for each lncRNA that encoded whether the protein-lncRNA pair did or did not interact. Next, two feature matrices (null and full) were constructed. The null matrix included the log normalized values for length and expression of each of the lncRNAs. The full matrix included log normalized length and expression, as well as an additional five columns that corresponded to each of the five lncRNA communities. Each lncRNA was assigned a value of "1" in the column representing its community.
2.4.12 Models of protein associations
To address if lncRNA communities contained information about lncRNA/protein
27
covariates. Logistic regression models were implemented with scikit-learn, using default parameters 53. The significance of the additional community information was measured with a likelihood ratio test (LRT), where the LRT statistic, D, equaled:
𝐷𝐷= 2∗[log(𝑓𝑓𝑓𝑓𝑓𝑓𝑓𝑓𝑚𝑚𝑚𝑚𝑚𝑚𝑚𝑚𝑓𝑓𝑓𝑓𝑙𝑙𝑙𝑙𝑚𝑚𝑓𝑓𝑙𝑙ℎ𝑚𝑚𝑚𝑚𝑚𝑚)− log(𝑛𝑛𝑓𝑓𝑓𝑓𝑓𝑓𝑚𝑚𝑚𝑚𝑚𝑚𝑚𝑚𝑓𝑓𝑓𝑓𝑙𝑙𝑙𝑙𝑚𝑚𝑓𝑓𝑙𝑙ℎ𝑚𝑚𝑚𝑚𝑚𝑚)]
A chi-squared distribution was used to determine the corresponding p-value for the LRT statistic. P-values were adjusted with a Bonferroni correction for the 156 comparisons.
To quantify the extent of the effect that community inclusion had on prediction of
lncRNA/protein interactions, we used a Leave-One-Out-Cross-Validation approach to measure precision and recall metrics 53, defined as:
𝑃𝑃𝑃𝑃𝑚𝑚𝑃𝑃𝑙𝑙𝑃𝑃𝑙𝑙𝑚𝑚𝑛𝑛= 𝑇𝑇𝑃𝑃𝑓𝑓𝑚𝑚𝑃𝑃𝑚𝑚𝑃𝑃𝑙𝑙𝑃𝑃𝑙𝑙𝑃𝑃𝑚𝑚𝑃𝑃𝑇𝑇𝑃𝑃𝑓𝑓𝑚𝑚𝑃𝑃𝑚𝑚𝑃𝑃𝑙𝑙𝑃𝑃𝑙𝑙𝑃𝑃𝑚𝑚𝑃𝑃+𝐹𝐹𝐹𝐹𝑓𝑓𝑃𝑃𝑚𝑚𝑃𝑃𝑚𝑚𝑃𝑃𝑙𝑙𝑃𝑃𝑙𝑙𝑃𝑃𝑚𝑚𝑃𝑃
𝑅𝑅𝑚𝑚𝑃𝑃𝐹𝐹𝑓𝑓𝑓𝑓= 𝑇𝑇𝑃𝑃𝑓𝑓𝑚𝑚𝑃𝑃𝑚𝑚𝑃𝑃𝑙𝑙𝑃𝑃𝑙𝑙𝑃𝑃𝑚𝑚𝑃𝑃𝑇𝑇𝑃𝑃𝑓𝑓𝑚𝑚𝑃𝑃𝑚𝑚𝑃𝑃𝑙𝑙𝑃𝑃𝑙𝑙𝑃𝑃𝑚𝑚𝑃𝑃+𝐹𝐹𝐹𝐹𝑓𝑓𝑃𝑃𝑚𝑚𝑁𝑁𝑚𝑚𝑁𝑁𝐹𝐹𝑃𝑃𝑙𝑙𝑃𝑃𝑚𝑚𝑃𝑃
In our model, precision is the number of lncRNAs correctly predicted to bind a protein, divided by the total number of lncRNAs the model predicted to bind a protein. Recall is the number of lncRNAs the model correctly predicted to bind a protein, divided by the total number of lncRNAs found to bind a protein according to the eCLIP data. For each lncRNA, the logistic regression models were allowed to train on all other lncRNAs except the single "left out" lncRNA. After training, both models were asked to predict if the "left out" lncRNA did or did not bind the protein. This procedure was repeated for all lncRNAs in each eCLIP dataset to calculate precision and recall.
The methodology for training and testing the raw kmer models was exactly the same as described above except that the five community features were replaced by the 4096 relative kmer abundance features.
28
The data for the bar graph in Fig. 3C were generated by the following approach. Of the 109 proteins on which eCLIP was performed in 37, 79 showed significant association with at least one kmer community over the null (Supplementary Table 19). Of these 79 proteins, binding motifs for 17 were determined via an in vitro binding assay in 23. The PWMs for each of these 17 proteins contained relative weights for each motif matching 6mer, representing the likelihood that the kmer in question would bind the protein in question. We multiplied the weight of each motif-matching 6mer by its average standardized abundance in each of the six communities, including the null, to obtain kmer abundances that were scaled by the likelihood that the kmer in question matched the binding motif in question. For each of the 17 proteins, sums of the
weighted abundance for all motif-matching kmers were created for the communities in which protein binding was enriched and not enriched over the null, respectively, then divided by the number of communities in each group to obtain the average weighted abundance of motif-matching kmers in the binding-enriched and binding-not-enriched groups. These abundances are plotted in Fig. 3C. For proteins that had more than one PWM reported in 23, the average abundance shown in Fig. 3C is comprised of the weighted abundance averaged over all
reported PWMs. To calculate significance, we shuffled the communities in the binding-enriched and binding-not-enriched groups 10,000 times and determined how often the difference in kmer abundance between the randomly shuffled binding-enriched and binding-not-enriched groups was greater than the difference between the real binding-enriched and binding-not-enriched groups.
2.4.14 Measuring kmer similarity surrounding motif matches in lncRNAs
29
if it overlapped an eCLIP peak, or a false positive if it did not. For each protein, the sequences surrounding the center of each true and false positive motif match (up to 150bp on either side of the center, or up to the end of the gene, whichever came first) were collected and their kmer contents were analyzed with SEEKR. Significance of the similarity between true positive regions was measured by a permutation test against randomly selected sets of false positive regions controlling for both the size of the set and the number of overlapping regions in the set (Supplementary Fig. 4).
2.4.15 Identifying motifs from eCLIP peaks
To find motifs in eCLIP peaks for the 17 proteins listed in Fig. 3C, we extracted the subset of sequences from eCLIP peaks whose CLIPper-defined p-value was <0.001 (peaks with the highest read densities relative to control; 37). We searched these sequences for motifs using DREME at default parameter as a part of the MEME-ChIP package 55.
2.4.16 Human-to-mouse and human-to-other community similarity calculations
30
more similar to the human-to-self distribution than it would be to the human-to-other-human and human-to-null distributions. Bonferroni-adjusted p-values were calculated by permutation tests where we iteratively subsampled 0.1-1% of each distribution, re-measured the mean pairwise similarities, counted number trials in which the "human-to-mouse" mean subsample was closer to the "human-to-other-human" mean than it was to the "human-to-self" mean, and finally, divided by the total number of trials performed (36,000). This bootstrapping procedure provided a statistical framework to determine if the similarities uncovered between human and mouse communities were greater than what would have been expected from random chance. For example, in each of 36,000 tests, the distribution of similarities between a randomly selected subset of lncRNAs from human community #1 and size-matched subsets of lncRNAs from mouse community #1 was always more similar to the distribution of similarities between all pairwise comparisons of the human community #1 subset than it was similar to the distribution of similarities between the human community #1 subset and size-matched subsets of non-community #1 human lncRNAs (see upper left panel in Supplementary Fig 6; “H-1 vs M-1” plot; the H-1-vs-H-1 distribution in red is nearly indistinguishable from the H-1-vs-M-1 distribution in purple).
To generate the plots in Supplementary Figs. 8 and 9, identical analyses were performed that compared human lncRNA communities to lncRNA communities from Rabbit, Dog, Opossum, Chicken, Lizard, Coelacanth, Zebrafish, Stickleback, Nile Tilapia, Elephant Shark, and Sea Urchin 10. In these latter cases, the human XIST and HOTTIP lncRNAs were doped into the lncRNA annotation set from the organism in question to find the homologous
communities that were the most XIST- and HOTTIP-like (Supplementary Fig. 7).
2.4.17 Generation of plasmids for TETRIS assays
31
(Clontech). Briefly, a 567bp fragment containing a minimal mouse PGK promoter was cloned into a SacI site in pGl4.10-Luciferase to generate pGI4-PGK-Luc-pA. The reverse complement of PGK-Luc-pA was cloned into a vector containing the bovine growth hormone polyA site. The entire bGHpa-[reversePGK-Luc-pA] was cloned into NotI and SalI sites of the piggyBAC vector (System Biosciences). The cumate-inducible promoter in the piggyBAC vector was then
replaced with the Tetracycline Responsive Element (TRE) from pTRE-Tight (Clontech) via Gibson assembly to generate pTETRIS-Cargo in Fig. 4A, in which the lncRNA, the luciferase gene, and a gene encoding puromycin resistance are all flanked by chicken HS4 insulator elements, and inverted terminal repeats (ITRs) recognized by the piggyBAC transposase. The rtTA-cargo vector from Fig. 4A was generated by cloning the hUbiC-rtTA3-IRES-Neo cassette from pSLIK-Neo (Addgene Plasmid #25735) into SfiI and SalI sites in a piggyBAC transposon vector (System Biosciences). The piggyBAC transposase from System Biosciences was cloned into SmaI and HindIII sites into pUC19 (NEB) to allow propagation of the transposase on ampicillin plates.
2.4.18 Generation of TETRIS-lncRNA Cargo vectors
LncRNA fragments were PCR-amplified from genomic DNA or bacterial artificial
32 2.4.19 Estimation of TETRIS copy number per cell
Genomic DNA was prepared from biological triplicate derivations of TETRIS-GFP and TETRIS-Xist-2kb cell lines. qPCR signal (SsoFast, Biorad) from the genomic DNA was compared to signal from a molar standard amplified from increasing amounts of the corresponding TETRIS plasmid (Supplementary Table 23).
2.4.20 TETRIS assays
To generate stable TETRIS-lncRNA cell lines, 8x10^5 E14 embryonic stem cells were seeded in a single well of a 6-well plate, and the next day transfected with 0.5µg TETRIS cargo, 0.5µg rtTA-cargo, and 1µg of pUC19-piggyBAC transposase. Cells were subsequently selected on puromycin [2µg/ml] and G418 [200µg/ml] for 6 to 12 days. Due to the efficiency of piggyBAC cargo integration and the rapidity of puromycin selection, all observable death from drug
selection occurred within ~3 days after addition of puromycin and G418 (i.e. cells with
puromycin resistance were invariably resistant to G418). For luciferase assays, 1x10^5 cells per well of 24 well plate were seeded in triplicate from each biological replicate preparation of a stable TETRIS-lncRNA cell line. 24 hours post-seeding, media was changed to include
doxycycline at a final concentration of 1µg/ml. After two days of growth in dox-containing media, cells were lysed with 100 ul of passive lysis buffer (Promega), and luciferase activity was
measured using Bright-Glo™ Luciferase Assay reagents (Promega) on a PHERAstar FS plate reader (BMG Labtech). Luciferase activity was normalized to protein concentration in the lysates via Bradford assay (Biorad). Each lncRNA fragment was assayed in at least in triplicate from at least two independent biological replicate preparations of stable TETRIS-lncRNA cell lines.
33
Synthetic lncRNAs were designed by generating 10 million, 1650 nucleotide long lncRNAs in silico that were composed of nucleotides randomly selected based on a given input ratio. To generate synthetic lncRNAs #2 through #6, the input ratio was the mononucleotide content of the 2,016-nucleotide long fragment of Xist inserted into TETRIS (0.203 A: 0.262 G: 0.204 C: 0.331 T). To generate synthetic lncRNA #1, the input ratio was an equal proportion of
mononucleotides (0.250 A: 0.250 G: 0.250 C: 0.250 T). Synthetic lncRNAs with the specified kmer similarity to the 2kb fragment of Xist were then selected and synthesized as geneBlocks (Integrated DNA Technologies) and Gibson assembled into the SwaI site in TETRIS. Similarities in kmer content to the 2kb fragment of Xist are relative to all other mouse GENCODE lncRNAs.
2.4.22 Visualization of Xist structural models
Minimum Free Energy and probability-arc structural models of Xist-2kb were generated using SHAPE-MaP data from 41, the visualization package VARNA 56, and a modified version of the IGV browser 57. Predicted pseudoknots and regions of low SHAPE reactivity and low
Shannon Entropy in Xist-2kb are from 41.
2.4.23 TETRIS predictions for kmer sizes and subsets
We measured SEEKR's ability to capture the relationship between a lncRNA's Xist-likeness and its repressive ability in the TETRIS assay using kmers from size one to eight. In each case, the correlation is measured using the means of all biological and technical replicates of each real and synthetic lncRNA, by normalizing kmer counts of Xist-2kb and the lncRNA in question in context with all mouse GENCODE lncRNAs. This process was repeated for select subsets of kmers which had the potential to increase our ability to predict repressive activity in TETRIS. Individual subsets were created by counting and normalizing kmers as normal with SEEKR then removing columns of the resulting count matrix that were not included in a given subset.
34
4095 kmers, and measured each of the subsets Pearson’s r values relative to our TETRIS data (Supplementary Fig. 10).
2.4.24 Statistical analyses
35
Supp. Table 2.1. (Corresponds to Supplementary Table 2) Relationship between lncRNAs with known transcriptional regulatory function as measured by SEEKR. “Species”, GENCODE set of lncRNAs. “Function”, the literature reported regulatory role of the lncRNAs. “Count”, the number of lncRNAs curated from the literature with a given function for a given species (full lists in Supplemental Table 1). “Mean”, the average Pearson’s correlation of all pairwise comparisons of lncRNAs in the set. “p-value”, the results of a permutation test of 10,000 random, sized matched sets of lncRNAs. SEEKR predicts that the lncRNAs in each of these classes are significantly more similar to each other than would be expected, with the exception of the mouse cis-activators.
36
Supp. Table 2.2. (Corresponds to Supplementary Table 3) Contingency table of Louvain communities and hierarchical clusters definitions in human. Each cell represents the number of lncRNAs that are found in both the corresponding row and column labels when groups of lncRNAs are defined using either the Louvain or hierarchical method. The large values along the diagonal indicate that the group definitions are stable with respect to the particular algorithm used for detection (p < 1E-324; Chi-squared).
Human Clusters
1 2 3 4 5 Null
Human
Communities 1 2 2784 8 1278 5 361 0 56 23 22 32 153 310
3 8 94 1202 7 12 197
4 84 37 30 796 17 133
5 83 14 11 28 536 105
37
Supp. Table 2.3. (Corresponds to Supplementary Table 4) Contingency table of Louvain communities and hierarchical clusters definitions in mouse. Each cell represents the number of lncRNAs that are found in both the corresponding row and column labels when groups of lncRNAs are defined using either the Louvain or hierarchical method. The large values along the diagonal indicate that the group definitions are stable with respect to the particular algorithm used for detection (p < 1E-324; Chi-squared).
Mouse Clusters
1 2 3 4 5 Null
Mouse
Communities 1 2 1555 5 751 6 41 17 0 0 4 7 203 499
3 88 4 156 0 3 209
4 0 0 1 326 0 0
5 0 1 2 0 42 31
38
Supp. Table 2.4. (Corresponds to Supplementary Table 5) Summary statistics of human
lncRNA communities. “Comm.”, community assignment; number of lncRNAs in each community is in parentheses. “N”, lncRNAs not assigned to a community at the specified threshold of similarity. “Length”, average length and (standard deviation). “GC”, average GC content and (standard deviation). “CpG”, proportion of lncRNAs that overlap CpG islands. “Proteins”, proportion of lncRNAs that overlap protein-coding genes. “Exons”, average number of exons in the lncRNA and (standard deviation).
39
Supp. Table 2.5. (Corresponds to Supplementary Table 6) Summary statistics of mouse
lncRNA communities. “Comm.”, community assignment; number of lncRNAs in each community is in parentheses. “N”, lncRNAs not assigned to a community at the specified threshold of similarity. “Length”, average length and (standard deviation). “GC”, average GC content and (standard deviation). “CpG”, proportion of lncRNAs that overlap CpG islands. “Proteins”, proportion of lncRNAs that overlap protein-coding genes. “Exons”, average number of exons in the lncRNA and (standard deviation).
40
Supp. Table 2.6. (Corresponds to Supplementary Table 9) Contingency table comparing 5mer based human communities to 6mer based communities. Each cell represents the number of lncRNAs that are found in both the corresponding row and column labels when community detection is run using either 5mers or 6mers as a similarity measure. The large values along the diagonal indicate that the community definitions are similar to one another (p < 1E-324; Chi-squared).
5mer Human Communities
1 2 3 4 5 Null
6mers Human Communities
1 2835 1 0 2 3 179
2 1 1785 28 8 8 182
3 1 52 1343 1 0 123
4 107 81 23 491 3 392
5 57 67 24 371 8 250
41
Supp. Table 2.7. (Corresponds to Supplementary Table 10) Contingency table comparing 7mer based human communities to 6mer based communities. Each cell represents the number of lncRNAs that are found in both the corresponding row and column labels when community detection is run using either 7mers or 6mers as a similarity measure. The large values along the diagonal indicate that the community definitions are similar to one another (p < 1E-324; Chi-squared).
7mer Human Communities
1 2 3 4 5 Null
6mers Human Communities
1 1629 50 5 70 68 1198
2 3 53 988 53 47 868
3 0 11 1026 32 27 424
4 5 0 11 888 38 155
5 1 2 0 5 671 98