ASSOICIATION BETWEEN PEAK VERTICAL GROUND REACTION FORCE, STEPS PER DAY, CUMULATIVE LOADING AND FEMORAL CARTILAGE DEFORMATION AFTER A
STANDARDIZED WALKING PROTOCOL IN HEALTHY INDIVIDUALS
Emma Leigh Young
A thesis submitted to the faculty at the University of North Carolina at Chapel Hill in partial fulfillment of the requirements for the degree of Master of Arts in the Department of Exercise
and Sport Science at The University of North Carolina at Chapel Hill. (Athletic Training)
Chapel Hill 2019
Approved by:
Brian Pietrosimone
J. Troy Blackburn
ABSTRACT
Emma Leigh Young: Association between peak vertical ground reaction force, steps per day, cumulative load and femoral cartilage deformation after a standardized walking protocol in
healthy
(Under the direction of Brian Pietrosimone)
The purpose of this study was to determine the association between walking gait loading
variables (peak vertical ground reaction force, steps per day, and cumulative load) and resting
femoral cartilage cross sectional area and femoral cartilage deformation immediately following a
standardized walking protocol in healthy individuals. Data was obtained to assess gait
biomechanics, femoral cartilage measures, and daily steps counts for each participant.
Separate univariate multiple linear regression models were conducted to determine the
individual associations between knee cartilage baseline cross sectional area and deformation
and loading variables. There was an association between greater peak vGRF and lesser
resting cartilage total cross sectional area. There were no statistically significant associations
between steps per day, cumulative load, and femoral cartilage measures. Clinically, the
findings from this study support that moderate levels of activity do not associate with acute
TABLE OF CONTENTS
TABLE OF CONTENTS
... iv
CHAPTER I
... 1
Introduction
... 1
CHAPTER II
... 5
Review of Literature
... 5
Introduction
... 5
Osteoarthritis
... 6
Epidemiology
... 6
Definition
... 7
Treatment Methods
... 8
Articular Cartilage of the Knee Joint
... 8
Physical Activity
... 10
Ultrasound Imaging to Monitor Cartilage Health
... 12
CHAPTER III
... 13
Experimental Design and Methods
... 13
Overview
... 13
Participants
... 14
Treadmill Protocol
... 15
Outcome Measures
... 15
Motion analysis
... 16
Accelerometer Measures
... 17
Statistical Analysis
... 18
CHAPTER IV
... 19
Results
... 19
CHAPTER V
... 22
Discussion
... 22
Summary
... 22
Femoral Cartilage Thickness and Peak vGRF
... 22
Steps per day
... 24
Cumulative load
... 24
Limitations
... 25
Conclusion
... 27
CHAPTER I Introduction
The knee is the most common joint to develop osteoarthritis (OA), and knee OA is the
11th leading cause of disability worldwide.1,2 OA is a complex condition that affects multiple
structures within a joint, and alters the functional capacity of the joint.3 Articular cartilage is the
hallmark structure associated with the onset of this condition.4 Articular cartilage is located on
the ends of bones and allows for low friction movements of the joint, as well as load
transmission.3 In individuals with advanced OA, articular cartilage breakdown is associated with
pain, stiffness, and loss of function.3 Articular cartilage is avascular, aneural, and alymphatic,
leading to a decreased capacity to self-repair.3 Articular cartilage is made up of chondrocytes
and a dense extra cellular matrix that is composed of water, type-II collagen, and
proteoglycans.5 Chondrocytes are the cells responsible for controlling the metabolic activity of
articular cartilage; therefore, they are responsible for maintaining joint homeostasis. These cells
are mechanosensitive,2 and therefore respond to the loads placed upon the tissue. Their
sensitivity to the magnitude, duration, and nature of mechanical stimuli allow them to react in a
catabolic or anabolic response.2
An optimal degree of loading is required for chondrocytes to produce an anabolic
response that maintains the integrity of articular cartilage within a joint.2 Both underloading and
overloading, when applied to joints, result in catabolic effects that can lead to cartilage thinning,
tissue softening, and reduced proteoglycan content.2 Responses of chondrocytes to
mechanical loading are highly dependent on loading amplitude, strain-rate, frequency, and
loading history.6 Under normal physiologic conditions chondrocytes synthesize and maintain
Depending on the mode, magnitude, duration of applications, and the combination with growth
factors, mechanical loading can have either beneficial or detrimental effects.6
Mechanosensation of articular cartilage is important for cartilage homeostasis because tissue
loading is directly related to the loss of proteoglycan concentration and composition.5
Proteoglycans are responsible for the compressive stiffness of articular cartilage; therefore, a
decrease in their concentration reduces compressive stiffness and causes more femoral
cartilage deformation when forces are applied, especially with physical activities such as
walking.8
Multiple previous studies have examined the effects of peak magnitudes of load on
articular cartilage, but not the frequency of load. 9,10 Both animal studies and human studies
have been performed to assess the responses of femoral articular cartilage to load. Animal
studies have suggested that greater magnitudes of loading result in a worsening response to
cartilage health.11,12 Human studies have suggested that lesser magnitudes of load may lead to
a deleterious change in biochemical markers and a greater prevalence of radiographic knee
osteoarthritis five years following injury.13
Femoral articular cartilage can adapt to chronic loading patterns during walking, and the
thickest areas of the cartilage occur where the tibia and the femur contact at full extension,
which is also the contact point at heel strike during walking.14 This chronic, functional loading
that occurs during walking can result in chondrocyte proliferation, an increase in proteoglycans,
and an increase in type II collagen.15–17 Maly et al. investigated whether cumulative knee
adduction load could distinguish adults with and without medial knee OA.18 This study
concluded that both cumulative knee adduction load and knee adduction moment were greater
in the OA group, and cumulative load was better than peak knee adduction moment at
discrimination the two groups.18 Moderate mechanical loading achieved with regular physical
activity is essential to preserve healthy femoral articular cartilage.3 The magnitude and
be important for knee joint health. In this study, we are defining cumulative load as the number
of steps per day divided by two, then multiplied by the normalized peak vertical ground reaction
force (vGRF) in the first 50% of stance phase of the gait cycle.19 Physical activity can be
monitored using accelerometers to objectively identify activity counts, steps per day, and
physical activity intensity.20–22 There is conflicting evidence regarding the effects of physical
activity on joint health. One study reported individuals with knee pain had a higher incidence of
cartilage lesions, meniscus, and subchondral bone in individuals who were the most physically
active, suggesting higher levels of physical activity may be associated with increased joint
degradation.23 In contrast, another review emphasized the necessity of moderate physical
activity to maintain healthy joints and prevent joint degradation.3
Ultrasonography is a useful tool for the evaluation of femoral articular cartilage. Schmitz
et al. found moderate to strong correlations between ultrasound and MRI for evaluating medial
femoral condyle cartilage thickness.24 The use of ultrasound as a method to measure knee
cartilage morphology has many benefits as an evaluation tool, some which include low cost,
ease of use, and lack of patient exposure to radiation.25 Ultrasound can produce immediate,
real-time imaging of changes in knee cartilage morphology immediately following an activity to
observe the initial response to loading of articular cartilage.26
To date, there have not been any studies to determine if the magnitude and frequency of
knee loading associates with how resilient femoral articular cartilage is in individuals with low,
moderate, and vigorous activity levels. In this study we estimated physical activity level from the
number of steps taken per day as determined by an accelerometer. It is important to
understand the influence of an individual’s physical activity on the response of articular cartilage
to a standardized loading protocol in order to develop preventative protocols for individuals who
are at risk for developing OA. Therefore, the primary purpose of this study is to determine the
association between loading variables (peak vGRF, steps per day, and cumulative load) and
by a change in cartilage cross sectional area, immediately following a standardized walking
protocol in healthy individuals. Our hypotheses for this study are: 1) healthy individuals who
produce greater peak vGRF in the first 50% of stance will demonstrate greater femoral cartilage
cross sectional area and lesser femoral cartilage deformation after 3,000 steps of walking, 2)
individuals who have a greater number of steps per day, will demonstrate greater femoral
cartilage cross sectional area and lesser femoral cartilage deformation after 3,000 steps of
walking, and 3) individuals who achieve greater cumulative load will also demonstrate greater
femoral cartilage cross sectional area and lesser femoral cartilage deformation after 3,000 steps
of walking.
Clinical Significance
The results of this study may improve the rationale for developing future studies aimed
at prescribing the appropriate amounts of physical activity to optimize cartilage health. If we find
an association between any of these variables and femoral cartilage deformation, the
information obtained from this study will provide fundamental knowledge about how femoral
articular cartilage in healthy individuals responds to load. These data may be clinically relevant
as the proposed information could improve monitoring of cartilage health during rehabilitation.
This study will allow us to better understand the effects repeated forces have on the integrity
CHAPTER II Review of Literature Introduction
Knee osteoarthritis (OA) is a prevalent, chronic condition that imposes a significant
burden on patients and healthcare systems. Among the medical community there has been a
great deal of debate concerning the risk factors of the condition and the potential relationship
between OA and the effects of exercise. Typically, knee OA is not diagnosed until the articular
cartilage is already irreparably damaged. Traditionally OA is diagnosed with the presence of
joint space narrowing identified by radiographic evidence and reported pain. There are currently
no objective diagnostic and prognostic markers to identify the early stages of the condition.
There have been recent advancements in research which suggest that it is possible to identify
decreases in proteoglycan concentration in articular cartilage which associates with the
development of osteoarthritis.27 This information could be used to gain a better understanding
of the early onset of the condition; however, it is time consuming and costly to identify these
biochemical and imaging markers. Ultrasonography has been used to evaluate the mechanical
properties of articular cartilage to better understand it’s behavior, and this may lead to
developments in the prevention and management of patients with OA.26
In order to continue making advancements in OA research, it is vital that we first gain a
better understanding of the characteristics of healthy cartilage. This leads us to the question:
how does femoral articular cartilage in healthy, active individuals respond to the forces placed
on the knee joints during exercise, and how does that relate to the development of
osteoarthritis? Finding the answers to these questions may help to further identify what is it
about uninjured knee cartilage that has made it successful in preventing the structures from
thickness in areas of its greatest loading.28 This suggests that cartilage can adapt to changing
demands placed on the joint. Gaining a better understanding of the characteristics of femoral
articular cartilage in an important topic because it will help to better prevent and treat this
disabling condition.
Osteoarthritis
Epidemiology
Knee osteoarthritis is the 11th leading cause of mobility-related disability globally.1 As a
result, it expends a substantial amount of health care resources and impairs the quality of life to
many individuals.29 In 2008, the reported cost of OA in the US averaged to $33.3 billion for
women, and $23.0 billion for men, making OA one of the most costly conditions in the US.29
Knee OA can have an idiopathic onset or can be elicited by traumatic injury to the knee,
otherwise known as posttraumatic osteoarthritis (PTOA). Idiopathic OA typically affects people
who are older than 60 years; in contrast, PTOA is more likely to affect young and middle-aged
adults.30 This poses a problem for health care providers to find a valid and reliable method to
identify the beginning stages of disease onset, as well as prevention and management
strategies for patients who suffer from PTOA. Since the majority of patients with PTOA are
young and middle aged adults, they are not suitable candidates for total joint replacement.
Individuals with PTOA may experience joint pain and disfunction at a younger age than patients
with idiopathic OA.31 Experiencing symptoms of OA at a younger age could cause individuals
with PTOA to be more susceptible to a premature decrease in physical activity levels.
Decreased physical activity, as a result of PTOA, could have implications of higher risk of
diseases such as high blood pressure, heart disease, and obesity, resulting in higher medical
costs throughout the patient’s lifetime. It is essential that we find a way to identify effective
treatment methods for patients who acquire OA as well as strategies to prevent disease
development in order to improve the quality of life to countless individuals in addition to
Definition
Osteoarthritis is a complex condition that affects all the structures within a joint.26 It is
characterized by the degeneration of the articular cartilage, a viscoelastic tissue located on the
ends of bones that affects joint articulations. The degeneration of the articular cartilage can
often lead to pain, joint stiffness, and disability. The anatomical abnormalities associated with
OA include cartilage fibrillation, fissuring and the removal of the surface layer of bone, loss of
proteoglycan, chondrocyte death or proliferation, and osteophyte formation.32
OA can be defined radiographically as well as symptomatically. The Kellgren-Lawrence
(K-L scale) is a radiographic method that has been used since the 1950s to determine the
presence and severity of osteoarthritis. The K-L scale is based on five features including the
formation of osteophytes, periarticular ossicles, narrowing of joint space, psedocystic areas, and
altered shape of bone ends.33 Symptomatic OA is defined as joint space narrowing in addition
to symptoms including pain, stiffness, and disability within the affected joint.32
The predisposition and susceptibility for developing idiopathic OA depends on many risk
factors. Predispositions for the condition include non-modifiable features including age, gender,
genetics, and ethnicity.34 Susceptibility risk factors are influenced by behaviors. These include
physical activity, poor biomechanics, occupation, joint injury, and diet.34 There has also been an
influx in recent years in research of the impact of obesity and body mass index (BMI) as a major
risk factor for developing OA.35
Posttraumatic osteoarthritis, a phenotype of OA, develops as a result of the occurrence
of injury to a joint. Nearly 50% of patients who sustain a significant joint injury develop OA.36
This can include joint injuries such direct and indirect joint impact loading, meniscal injury,
ligament and joint capsule tears, joint dislocations, and intraarticular fracturs.1,3,5,6 Following
injury to a joint, subtle metabolic changes occur in the articular cartilage and other joint
structures. Initially the joint will endure an asymptomatic phase then transition to a symptomatic
Treatment Methods
Elderly patients who suffer from debilitating OA can often be successfully treated with a
joint replacement or a restriction in activity. However, since patients who suffer from PTOA are
younger and more active, these are not practical treatment options and pose a new area of
interest for research. One study suggested physical therapy could be a potential treatment to
mild OA.37 There is limited evidence to support one specific physical therapy protocol, however,
it has been suggested that an exercise program that combines strengthening exercises with
exercises that increase flexibility and aerobic capacity seem to be the “best” option to offer to
patients with mild OA, taking into account their preferences and tolerance.37
Articular Cartilage of the Knee Joint
The articular cartilage of the knee is thin layer of viscoelastic tissue that covers the
gliding portions of tibiofemoral joint. This allows for ease of motion and additional cushion for
load transmission. Femoral articular cartilage has an average thickness of about 3-4mm,
however, some portions can be up to 7mm thick.38 Cartilage thickness is one of the key
measurements when identifying and monitoring joint health. Since the articular cartilage is an
elastic tissue, it contributes to functioning of load transmission.38 Articular cartilage is mainly
comprised of water, type II collagen, and proteoglycans. These are important components of
articular cartilage when discussing its mechanical behavior. The solid components of the extra
cellular matrix, collagen and proteoglycans, have a high frictional resistance to fluid flow, which
causes a high interstitial fluid pressurization. This results in the stiffness and viscoelasticity
characteristics of articular cartilage.5 When cartilage experiences proteoglycan degeneration, it
allows for the membrane of the extra cellular matrix to become more permeable, have a lower
pressurization, and a reduction in its compressive stiffness.5 It is vital that articular cartilage
maintains its proteoglycan and collagen concentration since it is a tissue that is avascular,
aneural, and alymphatic, which makes it difficult for self-repair.3 The compression and swelling
are responsible for the tensile strength of cartilage.38 Since cartilage is not a vascularized
tissue, the pain that is associated with degeneration could be caused from the various tissues
which surround the joint, such as the joint capsule, synovium, periosteum, bone, tendons,
bursae, ligaments, or menisci 25.
Articular cartilage is a tissue that is mechanosensitive, meaning that is responds to the
loads placed upon it.2,3,39 It has the has the ability to have a catabolic or anabolic response
depending on the magnitude, duration, and nature of the mechanical stimuli.2,39 The optimal
level of loading in order to maintain homeostasis and prevent breakdown of joint tissue is still
unknown. One study that looked at paraplegic patients found a diminish in knee articular
cartilage thickness between 9-13% after one year of reduced loads.40 This supports the idea
that a lack of mechanical load, or reduced loads to the lower extremity result in thinner and
softer cartilage.39 Another study concluded that moderate use leads to hypertrophy and
maintenance of AC, similar to the same processes of muscle.39 The same study reported
immobilization causes atrophy, both primarily because of changes in the content of
proteoglycans.39 Since aging is inevitable, moderate mechanical loading is the best tool to
maintain cartilage integrity and heath.39
Increased physical activity and increased mechanical loading could affect the loading
response of cartilage due to the mechanosensitiy characteristics. Steps per day is a commonly
used measure to assess physical activity level.22,41–43 A greater number of steps taken per day
will result in increased cumulative mechanical loading of the cartilage. Peak vGRF is a simple
overall measurement of load that can be used to evaluate mechanical loading of the lower
extremity. Motion analysis is a technique that is used to assess movement quality by
quantifying forces, joint angles, and movement patterns. Since cartilage is a type of tissue that
adapts to mechanical stimuli,44 it has been shown useful to conduct motion analyses to better
understand the effects of load at the knee joint.9,45 Motion capture systems can be used to
embedded in a walkway can make it easy to have a such who is able to ambulate, to walk
across the force plate and evaluate the vertical ground reaction force that is produced.
Physical Activity
Physical inactivity is a major risk factor for developing various diseases, including OA. One
cause of increased physical inactivity is traumatic musculoskeletal injury. Bell et al reported that
patients who received anterior cruciate ligament reconstruction (ACLR) after injury were less
physically active as determined by an accelerometer and self-reported physical activity
questionnaires.41 Luc et al found that 1 in 3 patients who underwent ACLR developed
symptomatic osteoarthritis within the first 10 years after injury.46
There has been contrasting evidence concerning the role of mechanical loading caused by
physical activity on joint health. Some studies suggest that physical activity has a damaging
effect to femoral articular cartilage, while others determined no or beneficial effects to joint
health.47 One study found an increase in incidence of lesions in cartilage, menisci, and
subchondral bone in individuals who did not have radiographic evidence of OA and no knee
pain, suggesting that higher levels of physical activity are associated with joint degradation.23 In
contrast, one review suggested that moderate levels of physical activity where critical for the
maintenance of joint health.3 These discrepancies found in the literature could be contributed to
several different factors such as the method used to observe cartilage (radiograph, MRI, and
ultrasound), the unknown effect of previous injury history, and the subject population.
Another critical element that could be affecting the conflicting discussion on the effects of
physical activity on cartilage health is the method used to measure physical activity. A majority
of studies utilize self-reported surveys or accelerometers to determine physical activity. Cerin et
al. performed a study that suggested self-reported physical activity estimates were significantly
higher than accelerometer determined physical activity.48 The use of physical activity
questionnaires can result in over-estimates of the amount and intensity of physical activity.
use of self-reported physical activity questionnaires can lead to an underestimate of the
associated risk of physical activity to cartilage health. One study found that physical activity
estimates based on IPAQ-LF were substantially higher than their conceptually matched
accelerometry-based counterparts. 49
Accelerometers have been shown to be a reliable and objective measurement of physical
activity.22 In order to obtain an estimate of physical activity when using an accelerometer, it is
suggested between 3 to 5 days of monitoring is required including at least one week day and
one weekend day.22 Hip and low back placement for the accelerometer have been
demonstrated to be the most reliable for assessment.22 The AticGraph GT1M is an
accelerometer that registers vertical acceleration in units called counts to measure physical
activity.21 This allows for the ability to categorized level of activity based on counts per minute.
Hansen et al. classified sedentary activity as activities below 100 counts per minute, low activity
was 100-759 counts per minute, life style activity as 760- 2019 counts per minute, and moderate
to vigorous activity as >2019 counts per minute.21 While, accelerometers are currently the best
way to objectively measure physical activity, one limitation is their inability to differentiate
between walking intensities.47 Doré et al. performed a study to evaluate the association
between objectively measured physical activity and knee structural changes.47 They found that
for participants in the lowest and middle third of baseline cartilage volume, doing ≥10,000
steps/day resulted in greater cartilage volume loss over time, whereas, subjects in the highest
third of cartilage volume has a smaller loss when compared with subjects doing <10,000 steps
per day.47
Cumulative load to the knee joint may also be associated with the development and
progression of OA. For this study, cumulative load is defined as the number of steps per day
multiplied by the peak vertical ground reaction force during the first 50% of stance phase
produced during walking. Ratzlaff et al. conducted a study looked the association between
calculated cumulative load as a product of time spent in a specific activity, body weight, and
average peak joint force for that activity.50 They found that while lifelong activity for the knee
joint is usually not harmful, high forces from occupation and housework are a potential risk
factor for knee osteoarthritis.50
Ultrasound Imaging to Monitor Cartilage Health
Ultrasonography has shown to be a useful assessment tool in the evaluation of knee
articular cartilage26,25,24. Ultrasound has the ability to evaluate articular cartilage, synovial
recesses, tendons, ligaments, bursae, and the peripheral aspect of the menisci25. Ultrasound is
an easily accessible and relatively inexpensive tool that may be used for routine checks without
harm to the patient, and does not expose the patient to radiation.26 It is important to monitor
changes in cartilage health and to gain a better understanding of how healthy cartilage
responds to the demands place on it, which can lead to advancements in the knowledge of
pathologic cartilage function. A typical, healthy joint has a uniform bone profile, homogeneous
echogenicity of the periarticular soft tissues and may have the presence of small amount of fluid
within in the joint when viewed with ultrasound25. During observation of the articular cartilage of
the tibiofemoral joint, ultrasound is limited to examination of the femoral cartilage only24. One
study found that transverse, mid-longitudinal, and posterior longitudinal ultrasound measures
were strongly associated with MRI findings in the same regions24. In the same study, they also
suggested the anterior longitudinal measure of ultrasound was not highly associated with MRI
measurements, likely due to the positioning of the of the transducer24. Research has been done
to evaluate knee cartilage deformation following walking and running. Their primary finding was
that a larger peak internal knee extensor moment was associated with medial femoral cartilage
thickness, suggesting that a greater force produce by the quadriceps during walking can lead to
healthy, thicker articular cartilage24. This information should be used to aid in the establishment
of clinical factors associated with thicker knee cartilage, which could lead to protocols that could
CHAPTER III
Experimental Design and Methods Overview
The purpose of this study was to determine the association between walking gait loading
variables and resting femoral cartilage cross sectional area and femoral cartilage deformation
immediately following a standardized walking protocol in healthy individuals. The walking gait
loading variables under investigation were peak vertical ground reaction force (vGRF) during the
first 50% of stance phase, steps per day, and cumulative load. Peak vGRF was measured
during gait biomechanics assessment while walking at a self-selected pace. Steps per day
were recorded to determine cumulative load. Cumulative load was investigated to determine
the resiliency of femoral articular cartilage associated with the frequency and magnitude of load
that is produced during walking.
This was a cross-sectional descriptive laboratory study. Testing was completed after the
Institutional Review Board approved all study procedures. All participants provided informed
consent prior to their participation in the study. Participants completed two laboratory sessions
and seven consecutive days wearing an ActiGraph GT9X Link SDK. During the first laboratory
session, participants completed baseline measurements to determine peak vGRF during
walking gait. Participants were provided with an accelerometer after the first laboratory session.
The accelerometer was worn for seven days and returned to the investigators so steps per day
and cumulative load could be calculated. During the second laboratory session, ultrasound
images of femoral cartilage were obtained before and after a standardized walking protocol.
The outcome variables were resting femoral cartilage cross sectional area and femoral cartilage
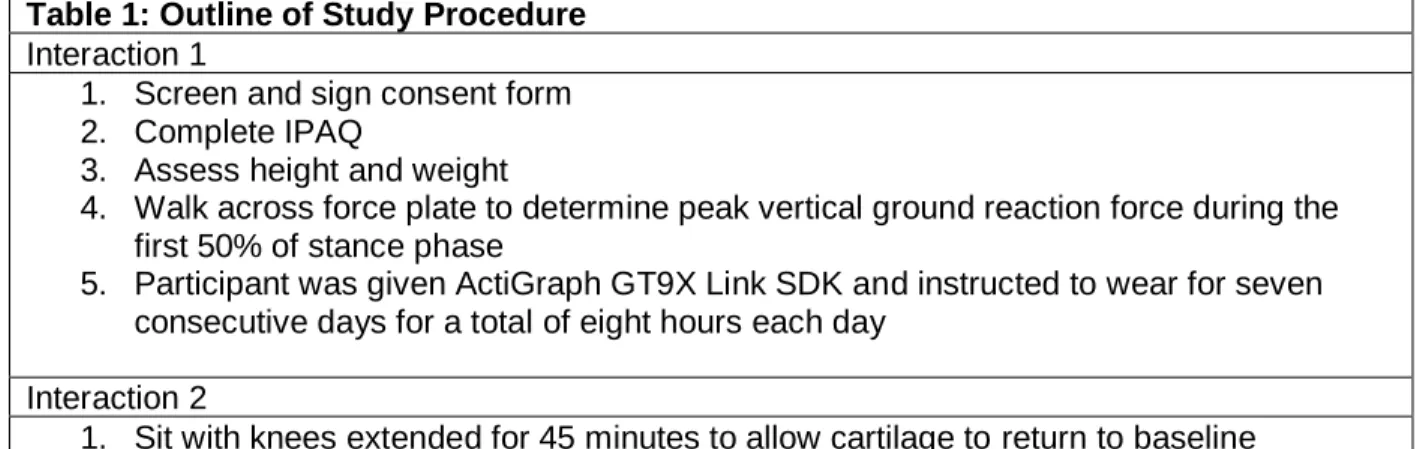
Table 1: Outline of Study Procedure Interaction 1
1. Screen and sign consent form 2. Complete IPAQ
3. Assess height and weight
4. Walk across force plate to determine peak vertical ground reaction force during the first 50% of stance phase
5. Participant was given ActiGraph GT9X Link SDK and instructed to wear for seven consecutive days for a total of eight hours each day
Interaction 2
1. Sit with knees extended for 45 minutes to allow cartilage to return to baseline 2. Complete Tegner survery
3. Measure femoral cartilage via ultrasound to determine total cross sectional area 4. Perform standardized walking protocol
5. Measure femoral cartilage via ultrasound to determine femoral cartilage deformation 6. Participant returned ActiGraph GT9X Link SDK after seven days of wear
Participants
33 healthy individuals were recruited to participate in this study. All participants were
between the ages of 18 and 34 years and had a BMI within the range of 19-32 kgm2.
Individuals were excluded if they reported a history of a major ligamentous injury to the knee or
hip joints, previous surgery to the back or lower extremity, lower extremity fracture, diagnosed
knee osteoarthritis, or experience chronic ankle instability or a balance disorder. Additional
exclusion criteria included inability to ambulate normally without external device, reported
neurological symptoms (including amyotrophic lateral sclerosis, muscle dystrophy, epilepsy,
multiple sclerosis, and Parkinson’s disease), congenital or degenerative joint condition,
orthopedic implants, current lower extremity joint pain, and pregnancy. Confirmation of
exclusion criteria was performed at the screening session prior to data collection.
Sample size was estimated from a previous study which assessed the magnitude of
medial femoral cartilage deformation using ultrasonography following walking and running in
twenty-five healthy individuals.26 Preliminary data determined there was a weak correlation
(r=0.31) between femoral cartilage deformation during walking and the International Physical
(r=0.50) as we used an objective measurement of physical activity, rather than a subjective
measure such as the IPAQ.22,51 Therefore, we estimated needing 29 healthy individuals to
detect a statistically significant moderate association with a power of 80% and α = 0.05 in the
current study (G*Power 3.1.9.3).52 We recruited 33 participants to account for a possible 15%
attrition rate.
Treadmill Protocol
Participants walked on treadmill at an average self-selected speed for 3,000 steps.26
Average walking speed was determined using infrared timing gates during gait biomechanics
assessment. Participants were instructed to walk at a self-selected speed described as
“walking comfortably on the sidewalk.” The average of five trials were calculated and used to
determine the walking on the treadmill. Participants took a minimal number of steps when
transitioning from treatment table to treadmill after their ultrasound images were taken. To
determine how long the participants walked on the treadmill, the participants wore a pedometer
on right anterior-superior iliac spine. Once 3,000 steps were achieved, the treadmill was
stopped and the participant took a minimal number of steps to return to the treatment table to
begin post-test cartilage imaging. The total number of steps as well as distance walked on the
treadmill were recorded.
Outcome Measures
Ultrasound
Ultrasound was used to determine femoral cartilage measures. Prior to baseline
assessments, participants sat on a treatment table in a long sit position with both knees in full
extension and the back and pelvis against a wall. Participants remained in this position for 45
minutes to unload the cartilage and minimize the effects of prior loading. Immediately following
the 45-minute unloading period, the participant’s test knee was positioned in 140° of flexion as
determined by a manual goniometer. A tape measure was secured to the table, and the
subject at post-test. An ultrasound imaging system with a 12.0 MHz linear probe was used to
capture cartilage images. The probe was positioned transversely in line with the medial and
lateral femoral condyles above the superior edge of the patella and rotated in the sagittal plane
to maximize reflection of the articular cartilage surface. A transparency grid was placed over
the ultrasound screen to aid in reproducibility of the ultrasound assessment. Reproducibly was
accomplished by aligning the inferior border of the medial and lateral femoral cartilage of the
initial image to a number on the transparent grid. Sequential images of the same knee were
aligned to the same numbers on the grid. Three images were collected from the left and right
limbs immediately prior to and following the walking protocol. Images were blinded prior to
assessment for each participant to reduce bias between pre and post walking images. From the
images captured, total cross sectional area was calculated using ImageJ software (National
Institutes of Health, Bethesda, MD).53 To determine cross sectional area, the investigator used
ImageJ software to outline the borders of the ultrasound image of the femoral cartilage.
Femoral cartilage deformation was calculated by determining percent change.
Equation 1: 𝑃𝑒𝑟𝑐𝑒𝑛𝑡 𝑐ℎ𝑎𝑛𝑔𝑒 = 𝑃𝑜𝑠𝑡 𝑓𝑒𝑚𝑜𝑟𝑎𝑙 𝑐𝑎𝑟𝑡𝑖𝑙𝑎𝑔𝑒 𝑎𝑟𝑒𝑎−𝑃𝑟𝑒 𝑓𝑒𝑚𝑜𝑟𝑎𝑙 𝑐𝑎𝑟𝑡𝑖𝑙𝑎𝑔𝑒 𝑎𝑟𝑒𝑎
| 𝑃𝑟𝑒 𝑓𝑒𝑚𝑜𝑟𝑎𝑙 𝑐𝑎𝑟𝑡𝑖𝑙𝑎𝑔𝑒 𝑎𝑟𝑒𝑎 | × 100%
Motion analysis
A motion analysis was conducted to assess peak vGRF during the first 50% of stance
phase of walking gait. Motion analysis was performed barefoot. To complete the motion
analysis, participants were instructed to look straight ahead and maintain a constant speed
through timing gates while they walked forward along a 6m walkway at a self-selected speed
while biomechanical data were collected. Two embedded force plates (40 x 60 cm, FP406010,
Bertec Corporation, Columbus, Ohio, United States) were staggered along the walkway so that
vGRF could be collected from both limbs during one gait analysis trial. Participants began by
completing at least 5 practice trials to determine the average preferred speed and ensure they
practice trials, participants completed 5 walking trials during which data for analysis was
collected. Data was considered acceptable if 1) each foot individually struck a single force
plate, 2) participants were able to maintain a forward eye gaze and did not aim for the force
plates 3) gait speed was within ±5% of the average speed determined during the practice trials,
and 4) gait kinematics were not be visibly altered during the trial (e.g. trip or stutter step).54
Kinetics (i.e. ground reaction force) were sampled during each trial. Participants performed five
valid trials from which the peak vGRF was averaged for statistical analysis. Ground reaction
forces was sampled at 1200 Hz and lowpass filtered at 75 Hz. Peak vGRF were identified
during the first 50% of the stance phase during gait and normalized to body weight (xBW).
Accelerometer Measures
Immediately after the first laboratory session was complete, participants were given an
ActiGraph GT9X Link SDK to wear for 7 consecutive days. Wear time validation was chosen
based from algorithms suggested by Choi et al. (2011) consisting of minimum wear time per day
of 480 minutes, minimum weekdays of valid wear time of 3 days, and minimum weekend days
of valid wear time of 1 day.51 The device was worn on a belt located at the right anterior superior
iliac spine, and was removed for bathing and sleeping. After the 7-day collection period, the
participants returned the accelerometer to the investigator and data was assessed for fidelity
and consistency with wear guidelines. Data was collected for steps per day, time spent in
moderate-to-vigorous physical activity, time spent in light physical activity, and time spent
wearing the device. Cumulative load was calculated as the product of steps per day divided by
2 and normalized peak vGRF during the first 50% of stance phase determined during the first
laboratory session.
The primary variable assessed by the accelerometer was daily step count. The total
number of steps was divided by 2 to account for steps on the dominant limb only. The
Actigraph monitored the collected data in raw acquisition mode, and ActiLife software was used
accelerations over a specified epoch.51 ActiGraph data was collected in 1-s epochs and
summed as counts per minute. Count and frequency of triaxial accelerations were used to
determine periods of wear and non-wear, and therefore, determine the participant’s compliance
with wear guidelines. Number of steps were assessed using the vertical acceleration data
collected by the monitor. Physical activity was determined based on the number of activity
counts that occurred per minute during period of wear-time. Freedson Adult VM3 cut points for
moderate and hard physical activity are 2690-6166 and 6167-9642 VM3 counts per minute,
respectively.20 Variables associated with the accelerometer were normalized to the number of
wear days (total number of steps per day in which the accelerometer is worn).
Statistical Analysis
To examine the associations between resting femoral cartilage cross sectional area and
femoral cartilage deformation and walking gait loading variables, separate univariate multiple
linear regression models were conducted. Resting femoral cartilage cross sectional area was
the criterion variable for each equation, and each loading variable (peak vGRF, steps per day,
and cumulative load) was placed into a separate equation as individual predictor variables. First,
we accounted for self-selected walking speed by placing the outcome into the regression
equation prior to the walking gait loading variable. Next, the change in R-squared (∆R2) for
each of the loading variables of interest was determined, as well as the corresponding p-value.
Then, the regressions were completed again with femoral cartilage deformation as the criterion
variable and the same previously stated predictor variables. By first removing the covariate
from the equation, we were able to gain better understanding of the amount of variance in
resting cartilage cross sectional area and cartilage deformation that is explained by each of the
loading variables independently. All calculations and analyses were completed using the
Statistical Package for the Social Sciences software at α = 0.05 (SPSS, Version 25, IBM Corp.,
CHAPTER IV Results
Thirty-three healthy individuals participated in this study (Table 1). Data was analyzed
for all thirty-three participates, however, three participants were lacking one day of validated
wear time for the activity monitor. Those three participants’ data were in included in analysis
because their exclusion did not significantly alter the results. Fourteen males and nineteen
females participated in this study. Twenty-nine participants identified their dominant limb as
their right leg and four participants identified their left limb as dominant. Walking speed was
included in each regression as a covariate and accounted for <0.001% to 5.5% of the
associations (R2 < 0.001 to R2 = 0.055).
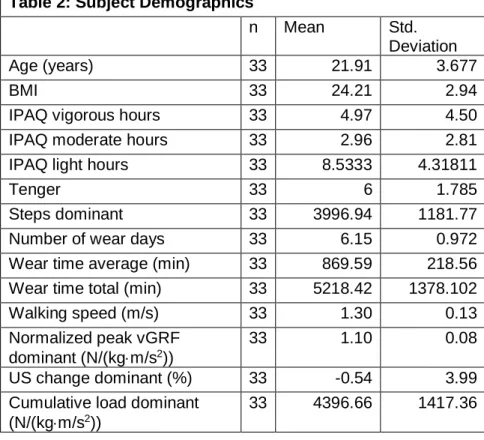
Table 2: Subject Demographics
n Mean Std.
Deviation
Age (years) 33 21.91 3.677
BMI 33 24.21 2.94
IPAQ vigorous hours 33 4.97 4.50
IPAQ moderate hours 33 2.96 2.81
IPAQ light hours 33 8.5333 4.31811
Tenger 33 6 1.785
Steps dominant 33 3996.94 1181.77
Number of wear days 33 6.15 0.972
Wear time average (min) 33 869.59 218.56
Wear time total (min) 33 5218.42 1378.102
Walking speed (m/s) 33 1.30 0.13
Normalized peak vGRF dominant (N/(kgm/s2))
33 1.10 0.08
US change dominant (%) 33 -0.54 3.99
Cumulative load dominant (N/(kgm/s2))
Table 3: Association between knee loading variables and femoral cartilage measures Pre-walking femoral cartilage cross sectional area
R2 P-value Standardized Beta
Steps 0.008 0.617 -0.92
Peak vGRF 0.124 0.048* -0.491
Cumulative load 0.025 0.388 -0.164
Change in femoral cartilage cross sectional area post walking
R2 P-value Standardized Beta
Steps 0.000 0.993 0.002
Peak vGRF 0.004 0.712 0.092
Cumulative load 0.000 0.947 0.012
Table 2: *The correlation between pre-walking femoral cartilage cross sectional area and peak vGRF is statistically significant.
Association between steps per day and femoral cartilage measures
There was not a significant association between average steps per day and pre-walking
femoral cartilage cross sectional area (R2 = 0.008, P = 0.617). There was not a significant
association between average steps per day and change in femoral cartilage cross sectional
area post walking (R2 < 0.001, P = 0.993).
Association between peak vGRF and femoral cartilage measures
There was a significant association between peak vGRF and pre-walking femoral
cartilage cross sectional area, indicating that the individuals who had a greater peak vGRF
during walking had lesser cartilage cross sectional area (R2 = 0.124, P = 0.048; see Figure 1).
There was no significant association between steps per day and change in femoral cartilage
Figure 1 illustrates that as normalized peak vGRF during walking gait increases, pre-walking femoral cartilage cross sectional area decreases.
Association between cumulative load and femoral cartilage measures
There was not a significant association between cumulative load and pre walking
femoral cartilage cross sectional area (R2 = 0.025, P = 0.388). There was not a significant
association between cumulative load and change in femoral cross sectional area post walking
(R2 < 0.001, P = 0.947). 0
20 40 60 80 100 120
0.9 0.95 1 1.05 1.1 1.15 1.2 1.25 1.3 1.35
Pre
-w
al
ki
ng
femoral
ca
rt
ila
ge
cros
s s
ec
tiona
l a
re
a
mm
3
Normalized peak vGRF (N/(kgm/s2))
CHAPTER V Discussion Summary
The purpose of this study was to determine the association between peak vGRF, steps
per day, and cumulative load and resting femoral cartilage cross sectional area and femoral
cartilage deformation in healthy individuals. The main findings from this study were 1) a greater
peak vGRF during walking gait was associated with lesser femoral cartilage cross sectional
area, 2) there was not an association between steps per day and resting femoral cartilage cross
sectional area and deformation, 3) there was not an association between cumulative load and
resting femoral cartilage cross sectional area and deformation. The results of this study were
contrary to our hypotheses. We expected a greater peak vGRF would associate with lesser
femoral cartilage deformation during walking and that individuals who achieved a greater
number of steps per day would associate with lesser femoral cartilage deformation. We also
hypothesized a greater cumulative load would associate with lesser femoral cartilage
deformation. Our findings suggest that the loading variables measured do not have acute
effects on femoral cartilage cross sectional area and deformation during walking in healthy
young adults; however, greater peak vGRF associates with lesser baseline femoral cartilage
cross sectional area.
Femoral Cartilage and Peak vGRF
Previous research has shown that individuals who regularly apply functional load to their
knee cartilage through moderate physical activity have greater cartilage thickness and
mechanical stiffness.55 Therefore, we hypothesized that a greater peak vGRF would associate
with lesser femoral cartilage deformation during walking. To the authors’ knowledge, there have
gait and femoral cartilage deformation in healthy individuals. This study found that there was a
significant association between greater peak vGRF and lesser femoral cartilage cross sectional
area at baseline. Our data suggest that greater force during walking associates with lesser
cross-sectional area of the cartilage at baseline. Similar findings were reported by Lynn et al.56
who reported an individual with a greater peak knee adduction moment (KAM) had thinner
medial femoral cartilage compared to 26 other participants, and this participant later developed
OA.56
Significant, acute changes in the cartilage cross sectional area were not identified during
this study. A similar study that was performed by Harkey et al. analyzed femoral cartilage
deformation in healthy individuals after acute loading and found a 6.72 % decrease in medial
femoral cartilage thickness after walking for 30 minutes on a treadmill.26 This differs from the
results of the current study in that we found a 0.54 % decrease in femoral cross sectional area
after 3,000 steps of walking on a treadmill (approximately 30 minutes). Another difference in
Harkey et al.’s study when compared to the current study, is that they used a different measure
of femoral cartilage; they measured femoral cartilage thickness at the midpoint of the medial
femoral condyle as the length (in mm) using a straight line drawn from the cartilage-bone
interface to the synovial space-cartilage interface, as well as medial and lateral compartment
cross sectional area.26 This differs from our study in that we assessed the total cross sectional
area of the cartilage (mm3). Harkey et al. also did not blind the ultrasound images during image
processing.26 Another study performed by Pamukoff et al. examined resting femoral cartilage
thickness and walking biomechanics in ACL-R participants and reported that a larger vGRF was
associated with greater medial compartment thickness.57 This is contrary to what our study
found; however, Pamukoff et al. studied a sample of patient’s with ACL-R. Pamukoff’s study
also reported that a larger knee adduction angle and knee adduction moment were associated
Steps per day
In the current study, the average number of steps per day did not associate with femoral
cartilage cross sectional area and deformation. On average, the participants in this study
achieved approximately 8,000 steps per day. According to Tudor-Locke and Basset, this would
categorize our healthy participants as moderately active.58 On Tudor-Locke and Basset’s scale,
physically active individuals achieve > 10,000 steps per day.58 To the authors’ knowledge,
there have not been any studies that directly examined the number of steps per day in relation
to femoral cartilage cross sectional area and deformation. Sliepen et al. assessed the number
of steps taken by 61 individuals with diagnosed knee OA to assess their levels of physical
activity.59 Their study found the average daily step count to be approximately 8,000 steps per
day, which is very similar to the average number of steps per day of our healthy participants.59
Another study compared the acute effects of walking on femoral cartilage deformation in healthy
adults and adults with OA and found there was not a difference in the amount of femoral
cartilage deformation between the two groups after a 30 minute bout of standardized walking.60
This would suggest that moderate levels of walking are not harmful for individuals with OA.
Other factors that could contribute to cartilage strain during walking instead of number of steps
per day could be walking speed, peak knee adduction moment, knee adduction moment
impulse, and peak knee flexion moment.61–63 Future studies need to evaluate different types of
physical activity in addition to walking to gain a better understanding the specific forms of
exercise on cartilage deformation.
Cumulative load
Cumulative load did not associate with femoral cartilage cross sectional area or
deformation. There have been a few studies that have examined the response of knee cartilage
to cumulative loading, however, these studies used cumulative KAM instead of peak vGRF.18,64
Previously, KAM has been used to examine the distribution of load between medial and lateral
examines the total magnitude of load that is applied to the entirety of the lower extremity instead
of KAM, which applies specifically to the medial compartment. Studies that have examined
KAM on knee cartilage have concluded that exposure to larger KAM over periods of time may
be detrimental to cartilage.18,61 Brission et al. assessed KAM during walking over 2.5 years to
examine the extent to which cumulative load affects medial knee cartilage thickness and volume
in individuals with clinical knee OA.61 This study found that greater KAM peak and impulse
during gait were each associated with reductions in cartilage volume of the medial tibia in obese
individuals with clinical OA.61 This study also reported that these measures may be important in
predicting medial tibial cartilage changes in normal and overweight individuals; therefore, they
suggest that reducing body mass for obese individuals may modulate the deleterious effects of
knee mechanics on knee OA progression.61 We may not have found an association in
cumulative load and femoral cartilage cross sectional area and deformation because we only
examined the cumulative load for one week and we may need to examine load for a longer
period of time to see changes in cartilage behavior and thickness. Longitudinal changes in
cartilage cross sectional area and deformation patterns during walking in healthy individuals
have not been assessed. There have been studies that have evaluated longitudinal changes in
cartilage thickness measures in individuals with OA; however, they did not measure acute
deformation.65,66 Moyer et al. found decreases in femoral cartilage thickness in individuals with
knee OA over a two year time span.65 Miller proposes that knee cartilage can be conditioned
with repetitive loads; therefore, changes in cartilage may not be able to be observed acutely.67
Miller’s study reported that the cumulative load with running does not cause damage to the joint
is because the cumulative load and peak stress in running are not particularly high, and that the
repetitive joint loads in running condition the cartilage to withstand these stresses without joint
deterioration.67
Medial and lateral compartment measures in addition to lower extremity kinetics (peak
KAM, KAM impulse, and knee flexion moment) were not examined in this study. These
variables have shown significant differences in other studies that examined load and changes in
femoral cartilage thickness. Another limitation was that there was not a large variance in step
counts between subjects. A majority of the study participants achieved an average daily step
count of 6,000 to 8,000 steps. Perhaps, if there was more variation in the step count ranges, we
would be able to better identify if there are changes in femoral cartilage cross sectional area and
deformation using a longitudinal study design. The type of physical activity could not directly be
examined, and therefore, the specific load associated with certain types of exercise could not be
assessed. For example, the load to the lower extremity during weight lifting was not objectively
measured; therefore, for those participants the overall femoral cartilage load was not able to be
fully assessed. Only the load associated with walking was monitored. In addition, patient
compliance with activity monitors was challenging. All participants were included in analysis,
however, only thirty individuals met the 3 weekday, 1 weekend day, and 8 hours per day
requirements. There were 2 subjects who did not obtain data for 1 weekend day and there was
1 subject who did not obtain a third week day. However, their inclusion in the analyses did not
change the results. It is possible that activity monitored over a week long span may not be a
good representation of typical physical activity patterns.
Future research can expand on the current study by assessing cumulative load over a
longer period of time as well as assessing daily step counts in sedentary and highly actively
individuals. Additionally, studies should assess the same measures, however, address sex and
anthropometrics as covariates. The current study was only able to assess cumulative load over
a period of 5 to 7 days. Perhaps evaluating changes in cartilage over a longer period of time
may give insight to cartilage conditioning or patterns in cartilage cross sectional area and
deformation patterns. Future studies should also evaluate different types of physical activity
of developing knee OA. In addition, this research can be expanded upon by assessing the
same variables in individuals who are at higher risk for developing knee OA, and in individuals
who have diagnosed OA in order to determine changes between groups. This could potentially
give more information about the onset of joint disease and could be expanded to develop joint
conditioning protocols.
Conclusion
This study found that there is an association between greater peak vGRF during walking
and lesser resting femoral cartilage cross sectional area. There is not an association between
daily step counts or cumulative load and resting femoral cartilage cross sectional area and
deformation. Therefore, external loads to the lower extremities may not be as important in
preventing harm to the joint tissues and monitoring femoral cartilage health as internal loads,
such as co-contractions and muscle imbalances, lower extremity kinetics, or other predisposing
factors, such as genetics. Clinically, the findings from this study support the notion that
moderate levels of physical activity do not associate with acute changes to resting femoral
REFERENCES
1. Cross M, Smith E, Hoy D, et al. The global burden of hip and knee osteoarthritis:
estimates from the Global Burden of Disease 2010 study. Ann Rheum Dis.
2014;73(7):1323-1330. doi:10.1136/annrheumdis-2013-204763.
2. Sun HB. Mechanical loading, cartilage degradation, and arthritis. Ann N Y Acad Sci.
2010;1211:37-50. doi:10.1111/j.1749-6632.2010.05808.x.
3. Griffin TM, Guilak F. The Role of Mechanical Loading in the Onset and Progression of
Osteoarthritis. Exerc Sport Sci Rev. 2005;33(4):195-200.
doi:10.1097/00003677-200510000-00008.
4. Andriacchi TP, Favre J. The Nature of In Vivo Mechanical Signals That Influence
Cartilage Health and Progression to Knee Osteoarthritis. Curr Rheumatol Rep.
2014;16(11):1-8. doi:10.1007/s11926-014-0463-2.
5. Pearle AD, Warren RF, Rodeo SA. Basic science of articular cartilage and osteoarthritis.
Clin Sports Med. 2005;24(1):1-12. doi:10.1016/j.csm.2004.08.007.
6. Sanchez-Adams J, Leddy HA, McNulty AL, O’Conor CJ, Guilak F. The Mechanobiology
of Articular Cartilage: Bearing the Burden of Osteoarthritis. Curr Rheumatol Rep. 2014;16(10):1-9. doi:10.1007/s11926-014-0451-6.
7. Akizuki S, Mow VC, Muller F, Pita JC, Howell DS. Tensile properties of human knee joint
cartilage. II. Correlations between weight bearing and tissue pathology and the kinetics of
swelling. J Orthop Res. 1987;5(2):173-186. doi:10.1002/jor.1100050204.
8. Lyyra T, Kiviranta I, Väätäinen U, Helminen HJ, Jurvelin JS. In vivo characterization of
indentation stiffness of articular cartilage in the normal human knee. J Biomed Mater Res. 1999;48(4):482-487.
doi:10.1002/(SICI)1097-4636(1999)48:4<482::AID-JBM13>3.0.CO;2-M.
9. Andriacchi TP, M\"undermann a, Smith RL, Alexander EJ, Dyrby CO, Koo S. A
framework for the \textit{in vivo} pathomechanics of osteoarthritis at the knee. Ann Biomed Eng. 2004;32(3):447-457.
10. Pietrosimone B, Blackburn JT, Harkey MS, et al. Greater Mechanical Loading during
Walking Is Associated with Less Collagen Turnover in Individuals with Anterior Cruciate
Ligament Reconstruction. Am J Sports Med. 2016;44(2):425-432.
doi:10.1177/0363546515618380.
11. Radin EL, Ehrlich MG, Chernack R, Abernethy P, Paul IL, Rose RM. Effect of repetitive
impulsive loading on the knee joints of rabbits. Clin Orthop Relat Res. 1978;(131):288-293. http://www.ncbi.nlm.nih.gov/pubmed/657637.
12. Kuyinu EL, Narayanan G, Nair LS, Laurencin CT. Animal models of osteoarthritis:
Classification, update, and measurement of outcomes. J Orthop Surg Res.
2016;11(1):1-27. doi:10.1186/s13018-016-0346-5.
Decreased Knee Joint Loading Associated with Early Knee Osteoarthritis after Anterior
Cruciate Ligament Injury. Am J Sports Med. 2016;44(1):143-151.
doi:10.1177/0363546515608475.
14. Chaudhari AMW, Briant PL, Bevill SL, Koo S, Andriacchi TP. Knee kinematics, cartilage
morphology, and osteoarthritis after ACL injury. Med Sci Sports Exerc.
2008;40(2):215-222. doi:10.1249/mss.0b013e31815cbb0e.
15. Lee DA, Bader DL. Compressive strains at physiological frequencies influence the
metabolism of chondrocytes seeded in agarose. J Orthop Res. 1997;15(2):181-188.
doi:10.1002/jor.1100150205.
16. Elder SH, Goldstein SA, Kimura JH, Soslowsky LJ, Spengler DM. Chondrocyte
differentiation is modulated by frequency and duration of cyclic compressive loading. Ann
Biomed Eng. 2001;29(6):476-482. doi:10.1114/1.1376696.
17. Ikenoue T, Trindade MCD, Lee MS, et al. Mechanoregulation of human articular
chondrocyte aggrecan and type II collagen expression by intermittent hydrostatic
pressure in vitro. J Orthop Res. 2003;21(1):110-116.
doi:10.1016/S0736-0266(02)00091-8.
18. Maly MR, Robbins SM, Stratford PW, Birmingham TB, Callaghan JP. Cumulative knee
adductor load distinguishes between healthy and osteoarthritic knees-A proof of principle
study. Gait Posture. 2013;37(3):397-401. doi:10.1016/j.gaitpost.2012.08.013.
19. Robbins SMK, Birmingham TB, Jones GR, Callaghan JP, Maly MR. Developing an
estimate of daily cumulative loading for the knee: Examining test-retest reliability. Gait Posture. 2009;30(4):497-501. doi:10.1016/j.gaitpost.2009.07.118.
20. Sasaki JE, John D, Freedson PS. Validation and comparison of ActiGraph activity
monitors. J Sci Med Sport. 2011;14(5):411-416. doi:10.1016/j.jsams.2011.04.003.
21. HANSEN BH, KOLLE E, DYRSTAD SM, HOLME I, ANDERSSEN SA.
Accelerometer-Determined Physical Activity in Adults and Older People. Med Sci Sport Exerc.
2012;44(2):266-272. doi:10.1249/MSS.0b013e31822cb354.
22. Trost SG, Mciver KL, Pate RR. Conducting accelerometer-based activity assessments in
field-based research. Med Sci Sports Exerc. 2005;37(11 SUPPL.):531-543.
doi:10.1249/01.mss.0000185657.86065.98.
23. Kretzschmar M, Lin W, Nardo L, et al. Association of physical activity measured by
accelerometer, knee joint abnormalities, and cartilage T2 measurements obtained from 3T magnetic resonance imaging: Data from the osteoarthritis initiative. Arthritis Care Res. 2015;67(9):1272-1280. doi:10.1002/acr.22586.
24. Schmitz RJ, Wang H-M, Polprasert DR, Kraft RA, Pietrosimone BG. Evaluation of knee
cartilage thickness: A comparison between ultrasound and magnetic resonance imaging
methods. Knee. 2017;24(2):217-223. doi:10.1016/j.knee.2016.10.004.
25. Möller I, Bong D, Naredo E, et al. Ultrasound in the study and monitoring of osteoarthritis.
26. Harkey MS, Blackburn JT, Davis H, Sierra-Arévalo L, Nissman D, Pietrosimone B. Ultrasonographic assessment of medial femoral cartilage deformation acutely following walking and running. Osteoarthr Cartil. 2017;25(6):907-913.
doi:10.1016/j.joca.2016.12.026.
27. Lahm A, Mrosek E, Spank H, et al. Changes in content and synthesis of collagen types
and proteoglycans in osteoarthritis of the knee joint and comparison of quantitative
analysis with Photoshop-based image analysis. Arch Orthop Trauma Surg.
2010;130(4):557-564. doi:10.1007/s00402-009-0981-y.
28. Schmitz RJ, Harrison D, Wang H-M, Shultz SJ. Sagittal-Plane Knee Moment During Gait
and Knee Cartilage Thickness. J Athl Train. 2017;52(6):560-566.
doi:10.4085/1062-2050-52.4.05.
29. Xie F, Kovic B, Jin X, He X, Wang M, Silvestre C. Economic and Humanistic Burden of
Osteoarthritis: A Systematic Review of Large Sample Studies. Pharmacoeconomics.
2016;34(11):1087-1100. doi:10.1007/s40273-016-0424-x.
30. Buckwalter JA, Brown TD. Joint Injury, Repair, and Remodeling. Clin Orthop Relat Res.
2004;423(423):7-16. doi:10.1097/01.blo.0000131638.81519.de.
31. Thomas AC, Hubbard-Turner T, Wikstrom EA, Palmieri-Smith RM. Epidemiology of
Posttraumatic Osteoarthritis. J Athl Train. 2016;51(5):0-0. doi:10.4085/1062-6050-51.5.08.
32. Kraus VB, Blanco FJ, Englund M, Karsdal MA, Lohmander LS. Call for standardized
definitions of osteoarthritis and risk stratification for clinical trials and clinical use.
Osteoarthr Cartil. 2015;23(8):1233-1241. doi:10.1016/j.joca.2015.03.036.
33. Kellgren JH, Lawrence JS. Radiological Assessment of Osteo-Arthrosis. Ann Rheum Dis.
1957;16(4):494-502. doi:10.1136/ard.16.4.494.
34. Musumeci G, Aiello FC, Szychlinska MA, Di Rosa M, Castrogiovanni P, Mobasheri A.
Osteoarthritis in the XXIst century: Risk factors and behaviours that influence disease
onset and progression. Int J Mol Sci. 2015;16(3):6093-6112. doi:10.3390/ijms16036093.
35. Singer SP, Dammerer D, Krismer M, Liebensteiner MC. Maximum lifetime body mass
index is the appropriate predictor of knee and hip osteoarthritis. Arch Orthop Trauma
Surg. 2017:1-5. doi:10.1007/s00402-017-2825-5.
36. Lotz MK, Kraus VB. New developments in osteoarthritis. Posttraumatic osteoarthritis:
pathogenesis and pharmacological treatment options. Arthritis Res Ther. 2010;12:211.
doi:10.1186/ar3046.
37. Castrogiovanni P, Musumeci G. Which is the Best Physical Treatment for Osteoarthritis?
J Funct Morphol Kinesiol. 2016;1(1):54-68. doi:10.3390/jfmk1010054.
38. Ondr M, Oliveira JM, Lu R. Regenerative Strategies for the Treatment of Knee Joint
Disabilities. 2017;21:3-20. doi:10.1007/978-3-319-44785-8.
the metabolism of articular cartilage. J Rheumatol. 2017;44(4):410-417. doi:10.3899/jrheum.160226.
40. Vanwanseele B, Eckstein F, Knecht H, Spaepen A, St??ssis E. Longitudinal Analysis of
Cartilage Atrophy in the Knees of Patients with Spinal Cord Injury. Arthritis Rheum. 2003;48(12):3377-3381. doi:10.1002/art.11367.
41. Bell DR, Pfeiffer KA, Cadmus-Bertram LA, et al. Objectively measured physical activity in
patients after anterior cruciate ligament reconstruction. Am J Sports Med. 2017;45(8):1893-1900. doi:10.1177/0363546517698940.
42. Qin J, Barbour KE, Nevitt MC, et al. Objectively Measured Physical Activity and Risk of
Knee Osteoarthritis. Med Sci Sport Exerc. 2017;(September):1.
doi:10.1249/MSS.0000000000001433.
43. Vallance J, Eurich D, Gardiner P, Taylor L, Johnson S. Associations of Daily Pedometer
Steps and Self-Reported Physical Activity With Health-Related Quality of Life. J Aging
Health. 2016;28(4):661-674. doi:10.1177/0898264315609905.
44. Smith RL, Donlon BS, Gupta MK, et al. Effects of fluid‐induced shear on articular
chondrocyte morphology and metabolism in vitro. J Orthop Res. 1995;13(6):824-831.
doi:10.1002/jor.1100130604.
45. Hurwitz DE, Sumner DR, Andriacchi TP, Sugar DA. Dynamic knee loads during gait
predict proximal tibial bone distribution. J Biomech. 1998;31(5):423-430. doi:10.1016/S0021-9290(98)00028-1.
46. Luc B, Gribble PA, Pietrosimone BG. Osteoarthritis prevalence following anterior cruciate
ligament reconstruction: A systematic review and numbers-needed-to-treat analysis. J
Athl Train. 2014;49(6):806-819. doi:10.4085/1062-6050-49.3.35.
47. Doré DA, Winzenberg TM, Ding C, et al. The association between objectively measured
physical activity and knee structural change using MRI. Ann Rheum Dis.
2013;72(7):1170-1175. doi:10.1136/annrheumdis-2012-201691.
48. Cerin E, Cain KL, Oyeyemi AL, et al. reported Physical Activity. 2017;48(6):1075-1084.
doi:10.1249/MSS.0000000000000870.Correlates.
49. Cerin E, Cain KL, Oyeyemi AL, et al. Correlates of agreement between accelerometry
and self-reported physical activity. Med Sci Sports Exerc. 2016;48(6):1075-1084.
doi:10.1249/MSS.0000000000000870.
50. Ratzlaff CR, Koehoorn M, Cibere J, Kopec JA. Is lifelong knee joint force from work,
home, and sport related to knee osteoarthritis? Int J Rheumatol. 2012;2012(1).
doi:10.1155/2012/584193.
51. Choi L, Liu Z, Matthews CE, Buchowski MS. Validation of accelerometer wear and
nonwear time classification algorithm. Med Sci Sports Exerc. 2011;43(2):357-364.
doi:10.1249/MSS.0b013e3181ed61a3.