Partial Least Squares Path Modeling: Time for Some Serious Second Thoughts1
Mikko Rönkkö
Aalto University School of Science PO Box 15500
FI-00076 Aalto, Finland phone: + 358 50 387 8155 email: [email protected]
Cameron N. McIntosh Public Safety Canada
John Antonakis
Faculty of Business and Economics University of Lausanne
Jeffrey R. Edwards Kenan-Flagler Business School University of North Carolina at Chapel Hill
Accepted for publication in Journal of Operations Management DOI: 10.1016/j.jom.2016.05.002
1 We thank Mikko Ketokivi for giving us the data used in this article. We thank John Cadogan, Joerg
Evermann, Dale Goodhue, Philipp Holtkamp, Mikko Ketokivi, Nick Lee, and Ron Thompson for their comments on earlier versions of the article.
Abstract
Partial least squares (PLS) path modeling is increasingly being promoted as a technique of
choice for various analysis scenarios, despite the serious shortcomings of the method. The
current lack of methodological justification for PLS prompted the editors of this journal to
declare that research using this technique is likely to be desk-rejected (Guide & Ketokivi,
2015).To provide clarification on the inappropriateness of PLS for applied research, we provide a
non-technical review and empirical demonstration of its inherent, intractable problems. We show
that although the PLS technique is promoted as a structural equation modeling (SEM) technique,
it is simply regression with scale scores and thus has very limited capabilities to handle the wide
array of problems for which applied researchers use SEM. To that end, we explain why the use of
PLS weights and many rules of thumb that are commonly employed with PLS are unjustifiable,
followed by addressing why the touted advantages of the method are simply untenable.
Keywords: Partial least squares, structural equation modeling, formative measurement,
composite variables, capitalization on chance, significance testing, model fit, causality, statistical
NON SEQUITUR © 2016 Wiley Ink, Inc.. Dist. By UNIVERSAL UCLICK. Reprinted with permission. All rights reserved.
1. Introduction
Partial least squares (PLS) has become one of the techniques of choice for theory testing in some academic disciplines, particularly marketing and information systems, and its uptake seems to be on the rise in operations management (OM) as well (Peng & Lai, 2012; Rönkkö, 2014b). The PLS technique is typically presented as an alternative to structural equation modeling (SEM) estimators (e.g., maximum likelihood), over which it is presumed to offer several advantages (e.g., an enhanced ability to deal with small sample sizes and non-normal data).
purpose, the shortcomings of PLS are much more insidious because they are not immediately apparent in the results of the statistical analysis. Although PLS promises simple solutions to complex problems and often produces plausible statistics that are seemingly supportive of
research hypotheses, both the technical and applied literature on the technique seems to confound two distinct notions: (1) something can be done; and (2) doing so is methodologically valid (Westland, 2015, Chapter 3). As stated in a recent editorial by Guide and Ketokivi (2015): “Claiming that PLS fixes problems or overcomes shortcomings associated with other estimators is an indirect admission that one does not understand PLS” (p. vii). However, the editorial provides little material aimed at improving the understanding of PLS and its associated limitations.
Although there is no shortage of guidelines on how the PLS technique should be used, many of these are based on conventions, unproven assertions, and hearsay, rather than rigorous methodological support. Although OM researchers have followed these guidelines (Peng & Lai, 2012), such works do not help readers gain a solid and balanced understanding of the technique and its shortcomings. This state of affairs makes it difficult to justify the use of PLS, beyond arguing that someone has said that using the method would be a good idea in a particular research setting (Guide & Ketokivi, 2015, p. vii) Therefore, in order to mitigate common
2. What is PLS and What Does It Do?
A PLS analysis consists of two stages. First, indicators of latent variables are combined as weighted sums (composites); second, the composites are used in separate regression analyses, applying null hypothesis significance testing by comparing the ratio of a regression coefficient and its bootstrapped standard error against Student’s t distribution. In a typical application, the composites are intended to measure theoretical constructs that are measured with multiple indicators. In this type of analysis, the purpose of combining the indicators into composites is to produce aggregate measures that can be expected to be more reliable than any of their
components, and can therefore be used as reasonable proxies for the constructs. Thus the only difference between PLS and more traditional regression analyses using summed scales, factor scores, or principal components, is how the indicators are weighted to create the composites. Moreover, instead of applying traditional factor analysis techniques, the quality of the measurement model is evaluated by inspecting the correlations between indicators and
composites that they form, summarized as the composite reliability (CR) and average variance extracted (AVE) indices.
Although PLS is often marketed as a SEM method, a better way to understand what the technique actually does is to simply consider it as one of many indicator weighting systems. The broader methodological literature provides several different ways to construct composite
producing scores with different qualities (Grice, 2001b). Commonly used prediction weights include regression, correlation, and equal weights (Dana & Dawes, 2004). Although not linear composites, different models based on item response theory produce scale scores that take into account both respondent ability and item difficulty (Reise & Revicki, 2014). Outside the context of research, many useful indices are composites, such as stock market indices that can weight individual stocks based on their price or market capitalization. Given the large number of
available approaches for constructing composites variables, two key questions are: (1) Does PLS offer advantages over more well-established procedures?; and (2) What is the purpose of the PLS weights used to form the composites? We address these questions next.
2.1.On the “Optimality” of PLS Weights
Most introductory texts on PLS gloss over the purposes of the weights, arguing that PLS is SEM and therefore it must provide an advantage over regression with composites (e.g., Gefen, Rigdon, & Straub, 2011); however, such works often do not explicitly point out that PLS itself is also simply regression with composites. Other authors suggest the weights are optimal (e.g., Henseler & Sarstedt, 2013, p. 566), but do not explain why and for which specific purpose. As noted by Krämer (2006): “In the literature on PLS, there is often a huge gap between the abstract model [..] and what is actually computed by the PLS path algorithms. Normally, the PLS
algorithms are presented directly in connection with the PLS framework, insinuating that the algorithms produce optimal solutions of an obvious estimation problem attached to PLS. This estimation problem is however never defined” (p. 22).
their arguments. Perhaps the most common argument is that the indicator weights maximize the R2 values of the regressions between the composites in the model (e.g. Hair, Hult, Ringle, & Sarstedt, 2014, p. 16). However, this claim is problematic, for two main reasons: (a) why maximizing the R2 values is a good optimization criterion is unclear; and (b) PLS has not been shown to be an optimal algorithm for maximizing R2. In contrast, Rönkkö (2016a, sec. 2.3) demonstrates a scenario where optimizing indicator weights directly with respect to R2 produces a 180% larger R2 value than PLS, thus demonstrating that if the purpose of the analysis is to maximize R2, the PLS algorithm is not an effective algorithm for this task.
--- Insert Table 1 about here ---
Another common claim is that PLS weights reduce the impact of measurement error (e.g., Chin, Marcolin, & Newsted, 2003, p. 194; Gefen et al., 2011, p. v). The traditional approach to adjusting for measurement error is to combine multiple “noisy” indicators into a composite measure (i.e., a sum), and then use the composite in the statistical analyses. This procedure typically assumes that the measurement errors are independent in the population, in which case combining multiple measures reduces the overall effect of the errors (cf, Rigdon, 2012). Whether the indicators should be weighted when forming the composite received considerable attention in the early literature on factor analysis, and indeed, the problem of how to generate maximally reliable composites was already solved in the 1930’s (Thomson, 1938) by the introduction of the regression method for calculating factor scores, a technique which is the default means of
outcomes in terms of reliability; hence the recommendation to use unit weights instead as a general-purpose solution (e.g., Bobko, Roth, & Buster, 2007; Cohen, 1990; Cohen, Cohen, West, & Aiken, 2003, pp. 97–98; Grice, 2001a; McDonald, 1996).
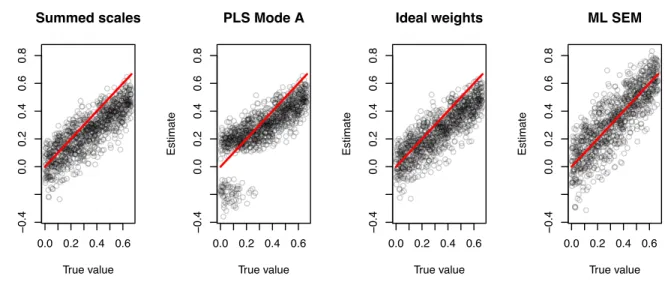
We demonstrate this general result in Figure 1, which shows four sets of estimates
calculated from data simulated from a known population model2. The regression estimates based on summed scales are negatively biased, which is a direct consequence of the presence of
measurement errors in the composites (Bollen, 1989, Chapter 5). The same bias is visible in the PLS estimates as well, but there is also a clear bias away from zero that we will address later in the article. The ideally-weighted composites, calculated by regressing the latent variable scores, which were used to generate the data, on the indicators, provide a theoretical upper limit on reliability against which other composites can be compared. The differences between summed scales and ideal weights are small, demonstrating that indicator weighting cannot meaningfully reduce the effect of measurement error in the composites. In contrast to biased composite-based estimates, ML SEM estimates are unbiased, which is the expected result because the technique does not create composite proxies for the factors, but rather explicitly models different sources of variation in the indicators, including the errors.
---- Insert Figure 1 about here ----
This general finding is also showcased by a recent study demonstrating that, even in highly favorable scenarios, the value-added of PLS weights over unit weights is trivial (only about a 0.6% increase in reliability, on average), whereas in less favorable scenarios, the
2 We simulated 1000 samples of 100 observations each from a population where two latent variables were
associated loss is much more striking (an average decrease of around 16.8%) (Henseler et al., 2014, table 2). Therefore, the common claim that the PLS indicator weighting system would minimize the effect of measurement error (e.g., Chin et al., 2003; Fornell & Bookstein, 1982; Gefen et al., 2011), or more generally, that indicator weighting can meaningfully improve reliability (Rigdon, 2012), is simply untenable (McIntosh et al., 2014; Rönkkö & Evermann, 2013; Rönkkö et al., 2015).
2.2.What Do the PLS Weights Actually Accomplish?
Although it is not clear what purpose the PLS weights serve, or what their advantages are over other modeling approaches, this confusion does not automatically make the weights invalid. Nevertheless, understanding how the PLS weights behave in sample data is critical for assessing their merits. Thus, we will now explain the PLS algorithm and its outcome by using a simple example: Consider two blocks of indicators: (a) X, which is a weighted composite of indicators x1-x3 and (b) Y, which is a weighted composite of indicators y1-y3 (Rönkkö & Evermann, 2013).
Assume further that X and Y are positively correlated. The PLS weighting algorithm consists of two alternating steps, referred to as inner and outer estimation. The weight algorithm starts by initializing the composites, X and Y, as the unweighted sums of standardized indicators (i.e., unit-weighted) x1-x3 and y1-y3, respectively. Next, during the first inner estimation step, the
composites are recalculated as weighted sums of adjacent composites (i.e., connected by paths in the model). In the present example, X is the only adjacent composite of Y and vice versa.
Because X and Y are positively correlated, the composite Y is recalculated as X (i.e., the sum of indicators x1-x3) and vice versa. In the first outer estimation step, the indicator weights are
after which the composites are again recalculated. The two steps are repeated until there is
virtually no difference in the indicator weights between two consecutive outer estimation steps3. To more clearly illustrate the outcome of the PLS weight algorithm, consider a scenario where x3 and y1 are, for whatever reason, correlated more strongly with each other than are the
other indicators. Therefore, in the first round of outer estimation, these two indicators are given higher weights when updating the composites, leading to an even higher correlation of x3 and y1
with their respective composites and increasing the weights further during subsequent outer estimation steps. The PLS algorithm thus produces weights that increase the correlation between the adjacent composites compared to the unit-weighted composites used as the starting point by using any correlations in the data (Rönkkö, 2014b; Rönkkö & Ylitalo, 2010), but this does not guarantee achievement of any global optimum (Krämer, 2006). In more complex models, the weights for a given composite will be contingent on the associations between the indicators of that composite and those adjacent to it, and therefore weights will vary across different model specifications. If a composite is intended to have theoretical meaning, it is difficult to consider the model-dependent nature of the indicator weights as anything but a disadvantage.
To empirically demonstrate the outcomes of the PLS weight algorithm in a real research context, we obtained the data from the third round of the High Performance Manufacturing (HPM) study (Schroeder & Flynn, 2001), in order to replicate the analysis of Peng and Lai (2012)4. We first calculated six sets of composites: One set used unit weights, another set was
3 The PLS algorithm can also be applied without the so-called inner estimation step (or alternatively,
considering a composite to be only self-adjacent), producing the first principal component of each block (McDonald, 1996). This version of the algorithm is sometimes referred to as “PLS regression” in the literature (Kock, 2015). This labeling of the algorithm is confusing, because: (a) the term “PLS regression” is used also for a completely different algorithm (Hastie, Tibshirani, & Friedman, 2013, Chapter 3; Vinzi, Chin, Henseler, & Wang, 2010); and (b) it obfuscates the fact that the analysis is simply regression with principal components.
4 The data consisted of 266 observations, of which 190 were complete. Following Peng and Lai, we used
based on a replication of Peng and Lai (2012, Figure 3, p. 474), and the remaining four sets were calculated with alternative inner model configurations switching the composite serving as the mediator. The standardized regression coefficients are completely determined by correlations, which we focus on for simplicity.
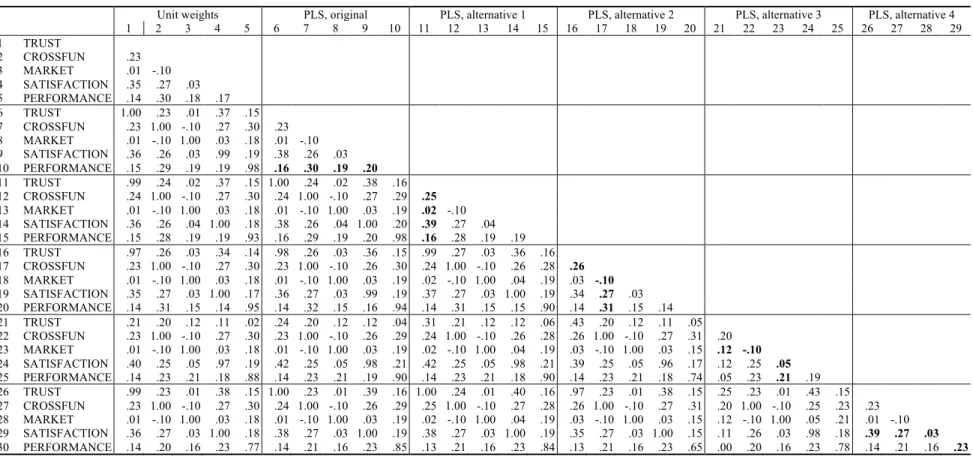
The correlations in Table 2 show that PLS weights provide no advantage in reliability. If the PLS composites were in fact more reliable, we should expect: (a) all correlations between the PLS composites to be higher than the corresponding correlations between unit-weighted
composites; (b) the cross-model correlations between a PLS composite (e.g., Trust with Suppliers) to be higher than the correlations between unit-weighted and PLS composites (see also Rönkkö et al., 2015); and (c) the absolute differences in the correlations between PLS and unit-weighted composites to be larger for large correlations, because the attenuation effect due to measurement error is proportional to the size of the correlation. Instead, we see that PLS weights increase some correlations at the expense of others, depending on which composites are adjacent; in particular, when a correlation is associated with a regression path during PLS weight
calculation, the correlation is on average 0.039 larger than when the same correlation is not associated with a regression path. If we omit correlations involving the single indicator composite Market Share, which does not use weights, this difference increases to 0.051. Also, the correlations between PLS composites are usually larger than correlations between unit-weighted composites when the composites are adjacent (i.e. associated with regression paths), and smaller when not associated with regression paths (not adjacent). Furthermore, the mean
strategy is known to be suboptimal (Enders, 2010, sec. 2.6). Our replication results were similar, but not identical to
correlation between PLS composites and the corresponding unit-weighted composite was always higher than the mean correlation between the cross-model PLS composites. For example, the mean correlation between PLS and unit-weighted composites for Trust with Suppliers was 0.83, but the mean correlation between the different PLS composites using the same data was only 0.72. Finally, no clear pattern emerged regarding how differences between the techniques depend on the size of the correlation.
--- Insert Table 2 about here ---
The results also reveal that model-dependent weights create an additional problem: a composite formed of the same set of indicators can have substantially different weights in different contexts, thus leading to interpretational confounding (Burt, 1976). This issue is apparent regarding the composite for Trusts with Suppliers and the third set of PLS weights, where the correlation between this PLS composite and others calculated using the same data but having different adjacent composites only ranged between 0.24-0.43. In extreme cases,
composites calculated using the same data but different PLS weights can even be negatively correlated. The effect is therefore similar to that of factor score indeterminacy discussed by Rigdon (2012).
assertions regarding the purported advantages of the indicator weighting have done more harm than good in applied research. We will now explain a series of additional, specific
methodological problems in PLS.
3. Methodological Problems
3.1.Inconsistent and Biased Estimation
The key problem with approximating latent variables with composites is that the resulting estimator is both inconsistent and biased (Bollen, 1989, pp. 305–306)5. Consistency is critically important because it guarantees that the estimates will approach the population value with increasing sample size (Wooldridge, 2009, p. 168). Although the literature about PLS acknowledges that the estimator is not consistent (Dijkstra, 1983), many introductory texts ignore this issue or seemingly dismiss it as trivial. For example, based on the results of a single study (Reinartz, Haenlein, & Henseler, 2009), Hair and colleagues (2014) conclude that: “Thus, the extensively discussed PLS-SEM bias is not relevant for most applications.” (p. 18). What do Reinartz et al.’s results actually show? First, these authors correctly observe that when all latent variables are measured with 8 indicators with loadings of .9, the bias caused by approximating them with composites is trivial (i.e., “ideal scenario”, in their Table 5). However, this is a rather unrealistic situation where the Cronbach’s alphas for the composites are 0.99 in the population, and in such a high reliability setting any approach for composite-based approximation will work well (McDonald, 1996). In more realistic conditions, the bias was appreciable: averaged over all conditions, estimates for strong paths (0.5) are biased by -19%, the sole medium strength path (0.3) is biased by -8%, and the estimates for the weak paths (0.15) are biased by +6%; the
5 There are a few important exceptions where regression with composites is a consistent estimator of latent
positive bias for the weaker paths occurs due to capitalization on chance, which we address in the next subsection.
3.2.Capitalization on Chance
The widely-held belief that PLS weights would reduce or eliminate the effect of
measurement error rests on the idea that the indicator weights depend on indicator reliabilities. The study by Chin, Marcolin, and Newsted (2003) typifies this reasoning: “indicators with weaker relationships to related indicators and the latent construct are given lower weightings […] resulting in higher reliability” (p. 194). The claim has some truth to it, because the indicator correlations in such models indeed depend on the reliability of the indicators; however, as mentioned before, decades of research have demonstrated that the advantages of empirically-determined weights are generally small.
A major problem in simulation studies making claims about the reliability of PLS
of anomalies signaling capitalization on chance, such as positively biased correlations, path coefficient estimates that become larger with decreasing sample size, non-normal distributions of the estimates, and bias that depends inversely on the size of the population paths (Rönkkö, 2014). As discussed by Rönkkö (2014b), the path coefficients reported by Chin et al. were larger not because of increased reliability, but rather capitalization on chance. This effect is illustrated in Figure 1, where the PLS estimates show a clear bias away from zero, are distributed bimodally (i.e., with two peaks) when the population parameter is close to zero (Rönkkö & Evermann, 2013), or have long negative tails in other scenarios (Henseler et al., 2014).
formula for correcting correlations for measurement error has now been available for more than 120 years (Spearman, 1904), there is no reason to risk relying on one source of bias to
compensate for another.
3.3.Problems in Model Testing
Model testing refers to imposing constraints on the model parameters and then assessing the probability of the observed statistics (e.g., the sample variance-covariance matrix of the observed variables), given the imposed constraints (Lehmann & Romano, 2005, Chapter 3). The principle behind such constraint-based model testing can be illustrated with the model presented by Peng and Lai (2012, Figure 3, p. 474). The model states that the effect of Trust with Suppliers on Customer Satisfaction is fully mediated by Operational Performance. This model imposes a constraint that the correlation between Trust with Suppliers and Customer Satisfaction must equal the product of two other correlations: one between Trust with Suppliers and Operational Performance, and the other between Operational Performance and Customer Satisfaction. Testing of such theory-driven constraints is essential, because if these do not hold true in the data, there is evidence that the model is not an accurate representation of the causal mechanisms that generated the data and any estimates are likely biased. However, as originally presented by Herman Wold, PLS was not intended to impose constraints on the data, making the technique incompatible with the idea of model testing (Dijkstra, 2014; see Rönkkö et al., 2015). As even its proponents sometimes admit: “Since PLS-SEM does not have an adequate global goodness-of-model fit measure [such as chi-square], its use for theory testing and confirmation is limited” (Hair et al., 2014, pp. 17–18). Although statistical testing may not have been the original purpose of PLS, many researchers attempt to apply PLS for model testing purposes (Rönkkö &
To clearly demonstrate that significant lack of model fit can go undetected in a real, empirical PLS study, we used maximum likelihood estimation to test the model presented by Peng and Lai (2012). The chi-square test of exact fit strongly rejected the model χ2(74) =173.718 (p <.001), indicating that misspecification was present. In addition, even the values for the “approximate fit” indexes did not meet Hu and Bentler’s (1999) guidelines on cutoff criteria (CFI = 0.930, TLI = 0.901, RMSEA = 0.071, 90% CI = 0.057-0.085, SRMR = 0.096)6.
Moreover, the modification indices suggested that the model cannot adequately account for the correlation between Trust with Suppliers and Customer Satisfaction. Therefore, following recent recommendations for studying mediation (Rungtusanatham, Miller, & Boyer, 2014), we
estimated an alternative model that included a direct path between these two latent variables (std. β = 0.479, p <.001). The fit of the model was better but still not exact, χ2(73) =117.521 (p
<.001).7 This analysis demonstrates that Peng and Lai’s conclusions regarding full mediation were incorrect. Thus, due to the lack of tools for model testing, it is evident that PLS
practitioners will be prone to incorrect causal inference.
Recent guidelines on using PLS make an attempt to assuage concerns about misspecification, suggesting that model quality should not be based on fit tests, but on the “model’s predictive capabilities” (Hair et al., 2014, Chapter 6), and that “fit” in PLS means predictive accuracy (e.g., Henseler & Sarstedt, 2013). However, this advice is problematic: First, multiple equation models are almost invariably overidentified, and if this is the case, there is no excuse for not calculating overidentification tests. Model testing (i.e., assessing fit) is important
6 We report these indices for descriptive purposes, noting that they are not useful for model testing (Kline,
2011, Chapter 8). Also, the failure to fit was not due to model complexity or a small sample, as indicated by the Swain correction ("#$%&'( =169.539 (p <.001); the Satorra-Bentler correction for non-normality ("
#)( = 167.067 (p <.001) gave similar results.
7 For comparison purposes, we also estimated this revised model with PLS, resulting in a standardized
to ensure that the specified structural constraints (e.g., zero cross-loadings and error covariances in a CFA model) are correct, because this speaks to the veracity of the underlying theory— estimates from misspecified models can be misleading. Second, predictive accuracy does not reflect model fit (McIntosh et al., 2014), as misspecified models are sometimes more predictive than correctly specified ones (Shmueli, 2010). The fact that PLS cannot test structural constraints does not warrant using measures of predictive accuracy to determine model quality.
Furthermore, Henseler, Hubona, and Ray (2016) state that: “PLS is a limited information estimator and is less affected by model misspecification in some subparts of a model (Antonakis et al., 2010)” (p. 5). Aside from ignoring the fact that Antonakis, Bendahan, Jacquart, and Lalive (2010) specifically cautioned against using PLS given its intractable problems, these statements are problematic because the indicator weights are calculated using information from all adjacent composites. Consider the Peng and Lai (2012) model: If the errors of the indicators of Trust with Suppliers were not independent of the errors of the indicators for Operational Performance, the correlations between the errors would affect the weights of both composites, thereby influencing the estimates of the path from Operational Performance to Customer Satisfaction as well. In contrast, other limited information estimators such as two stage least squares (2SLS) would be unaffected by this type of misspecification. Given the current paucity of research on the performance of PLS with misspecified models and inconsistency of the technique, if a limited information estimator is needed, researchers should instead consider 2SLS, a more established, consistent technique that can be applied to latent variable models (Bollen, 1996).
3.4.Problems in Assessing Measurement Quality
comparing the composite reliability (CR) and average variance extracted (AVE) indices against certain rule-of-thumb cutoffs. Apart from not being statistical tests, the main problem with the CR and AVE indices in a PLS analysis stems from the practice of calculating these statistics based on correlations between the indicators and the composites that they form (as opposed to using factor analysis results), which creates a strong positive bias (Aguirre-Urreta, Marakas, & Ellis, 2013; Evermann & Tate, 2010; Rönkkö & Evermann, 2013). Indeed, simulation studies have demonstrated that these commonly-used statistics cannot detect even severe model misspecifications (Evermann & Tate, 2010; Rönkkö & Evermann, 2013).
Another drawback with using CR and AVE to evaluate measurement models is that neither of these indices can assess the unidimensionality of the indicators, that is, whether they measure the same construct, which renders the resulting composite conceptually ambiguous (Edwards, 2011; Gerbing & Anderson, 1988; Hattie, 1985) as well as makes reliability indices uninterpretable (Cho & Kim, 2015). Introductory PLS texts take three approaches to this
3.5.Use of the One Sample t test Without Observing its Assumptions
After “assessing” the measurement model with the CR and AVE indices, a PLS analysis continues by applying null hypothesis significance testing to the structural path coefficients. Peng and Lai (2012) explain the procedure as follows: “Because PLS does not assume a multivariate normal distribution, traditional parametric-based techniques for significance tests are inappropriate” (p. 472). They then go on to discuss how resampling methods (i.e.,
bootstrapping), rather than analytical approaches, are needed to estimate the standard errors; yet, the significance of the parameter estimates is assessed by the one-sample t test, which is,
ironically, a parametric test and assumes normality of the parameter estimates8.
Furthermore, although the parameter estimates in a PLS analysis are simply OLS regression coefficients, the degrees of freedom for the significance tests presented in the
introductory texts on PLS do not match those described in the methodological literature on OLS. The significance of OLS regression coefficients is tested by the one-sample t test with n – k – 1 degrees of freedom, where n is the number of observations and k is the number of independent variables (Wooldridge, 2009, sec. 4.2). However, introductory texts on PLS argue that the degrees of freedom should be n – 1 (Hair et al., 2014, p. 134) or n + m – 2,9 where m is always 1 and n is the number of bootstrap samples (Henseler et al., 2009, p. 305). Unfortunately, these texts do not explain how the degrees of freedom for the test were derived. When used with large samples, the differences between the results obtained using these three formulas are nearly identical, but with small samples and complex models, the formulas yield differences that can be
8 The fact that parametric significance tests may not be appropriate with PLS has been discussed at least
since the early 2000’s in the context of multi-group analysis (cf., Sarstedt, Henseler, & Ringle, 2011, p. 199), but this concern is not discussed in the broader PLS literature.
substantial, where using a reference distribution with larger degrees of freedom leads to smaller p values (i.e., larger Type I error rates).
An additional problem is that neither of the two cited texts, or any other texts on PLS that we have read, explain why the computed test statistic should follow the t distribution under the null hypothesis of no effect. Rönkkö and Evermann (2013; see also McIntosh et al., 2014) recently showed that the PLS estimates are non-normally distributed under the null hypothesis of no effect. As such, the ratio of the estimate and its standard error cannot follow the t distribution, making comparisons against this distribution erroneous. Although Rönkkö and Evermann did not provide evidence on the distribution of the actual test statistic, Rönkkö, McIntosh, et al. (2015) demonstrated that the statistic did not follow the t distribution (df = n – k – 1), and comparisons against this reference distribution lead to inflated false positive rates. Although these studies can be criticized for using simplified population models10, these criticisms miss a crucial point: even though it may be possible to generate simulation scenarios where the parametric one-sample t test happens to works well, it does not work well in all scenarios; thus the test has not been proven to be a general test with known properties in the PLS context. Because a researcher applying the test in empirical work has no way of knowing whether it works properly in her particular situation, the results from the test cannot be trusted.
There are also misconceptions about the properties and justification of using the bootstrap. Many introductory texts incorrectly argue that PLS is a non-parametric technique and
10 For example, Henseler et al. (2014) argued that calculating the indicator weights based on a single path
does not represent how PLS is typically used. However, a recent review by Goodhue et al (2015) indicates that this type of model is common in PLS applications. Indeed, in the Peng and Lai (2012) model, three out of four
therefore bootstrapping is required (e.g., Hair, Ringle, & Sarstedt, 2011)11, ignoring the fact that bootstrapping itself has certain assumptions. Most importantly, although some articles use small datasets for demonstration (Efron & Gong, 1983), bootstrapping is generally a large-sample technique (e.g., Efron & Tibshirani, 1993; Davison & Hinkley, 1997; Yung & Bentler, 1996). It is therefore unclear how well this procedure works with PLS when applied to the sample sizes typically used in empirical research (Rönkkö & Evermann, 2013). Although bootstrapping is commonly viewed as being particularly applicable to small samples, this notion is a methodological myth that goes beyond PLS (Koopman, Howe, & Hollenbeck, 2014; Koopman, Howe, Hollenbeck, & Sin, 2015).
A further complication is the use of the so-called sign-change corrections in conjunction with the bootstrap, a procedure implemented in popular PLS software and recommended in some guidelines (Hair, Sarstedt, Ringle, & Mena, 2012; Henseler et al., 2009). These corrections are unsupported by either formal proofs or simulation evidence. Moreover, recent work showed that the individual sign-change corrections result in a 100% false positive rate when used with empirical confidence intervals (Rönkkö et al., 2015). Fortunately, some recent works on PLS are more cautionary toward these corrections (Hair et al., 2014), coupled with admissions that they should never be used (Henseler et al., 2016).
4. The Reasons for Choosing PLS: How Valid Are They?
PLS is typically described by its proponents as the preferred statistical method for evaluating theoretical models when the assumptions of latent variable structural equation
11 A technique is parametric if sample statistics (e.g., the mean vector and covariance matrix) determine the
modeling (SEM), are unmet (e.g., Hair et al., 2014; Peng & Lai, 2012). The essential claim is that because the ML estimator typically used in SEM has been proven to be optimal only for large samples and multivariate normal data (Kline, 2011, Chapter 7), then PLS should be used in cases where conditions are not met. This rationale for justifying PLS is problematic, for three reasons. First, the fact that an estimator has been proven to be optimal in certain conditions means neither that it requires those conditions nor that it would be suboptimal in other scenarios. Second, the inappropriateness of one method does not automatically imply the appropriateness of an alternative method (cf., Rönkkö & Evermann, 2013). Third, such recommendations present a false dichotomy, because PLS is just one of a large number of approaches for calculating scale scores to be used in regression analysis, rather than being the only composite-based alternative to latent variable SEM. Although claims of the advantages of PLS are widespread, these claims are rarely subjected to scrutiny, and formal analyses of the statistical properties of PLS are still lacking (Westland, 2015, Chapter 3). We now address the validity of five claims that have been used to justify the use of PLS over SEM.
4.1.Small Sample Size
common confusion in the PLS literature; the fact that some estimates can be calculated from the data does not automatically imply that the estimates are useful. As aptly stated by Westland (2015): “Responsible design of software would stop calculation when the information in the data is insufficient to generate meaningful results, thus limiting the potential for publication of false conclusions. Unfortunately, much of the methodological literature associated with PLS software has conflated its ability to generate coefficients without abnormally terminating as equivalent to extracting information.” (p. 42). Indeed, The idea that PLS would perform better in small samples can be traced back to a conference presentation by Wold (1980, partially republished in 1985a), where he presented an empirical application of PLS with 27 variables and 10
observations (Rönkkö & Evermann, 2013). However, the presentation itself made no methodological claims about the small-sample performance of the estimator.
Although ML SEM can be biased in small samples, resorting to PLS is inappropriate, because doing so would replace a potentially biased estimator with an estimator that is both biased and inconsistent (Dijkstra, 1983; see also Rönkkö et al., 2015). In fact, studies comparing PLS and ML SEM with small samples generally demonstrate that ML SEM has less bias
(Chumney, 2013; Goodhue et al., 2012; Reinartz et al., 2009)12. Considering that capitalization on chance is more likely to occur in smaller samples, and that the bootstrap procedures generally work well only in large samples, it difficult to recommend PLS when sample sizes are small. In such situations, a viable alternative is two-stage least squares, which has good small-sample
12 Recently, Henseler et al. (2014) argued that instead of focusing solely on bias, researchers should
evaluate techniques by their ability to converge to admissible solutions, using an example where ML SEM failed to converge to admissible solutions due to severe model misspecification. In this particular scenario, inadmissibility of the estimates tells very little of the small sample behavior of the estimator because the ML estimates calculated from population data were inadmissible as well. Moreover, as explained by McIntosh et al. (2014), the fact that ML SEM did not produce admissible solutions is actually a plus, because it provides a strong indication of model
properties and is non-iterative (i.e., has a closed-form solution), therefore sidestepping potential convergence problems (Bollen, 1996).
4.2.Non-normal Data
PLS has been recommended for handling non-normal data. However, because PLS uses OLS regression analysis for parameter estimation, it inherits the OLS assumptions that errors are normally distributed and homoscedastic (Wooldridge, 2009, Chapter 3). Perhaps the assumption that PLS is appropriate for non-normal data is rooted in Wold’s (e.g., 1982, p. 34) claim that using OLS to calibrate a model for prediction makes no distributional assumptions. Although normality is not required for consistency, unbiasedness, or efficiency of the OLS estimator (Wooldridge, 2009, Chapter 3), normality is assumed when using inferential statistical tests. Furthermore, an estimator cannot at the same time have fewer distributional assumptions and work better with smaller samples, because this notion violates the basics of information theory (Rönkkö et al., 2015). To be sure, some recent work on PLS urges researchers to “drop the ‘normality’ or ‘distribution-free’ argument in arguing about the relative merits of PLS and [SEM]” (Dijkstra, 2015, p. 26, see also 2010; Gefen et al., 2011, p. vii; Henseler et al., 2016, Table 2), an assertion that is supported by recent simulations (e.g., Goodhue et al., 2012). 4.3.Prediction vs. Explanation
Prediction can have many meanings in OM research. Prediction can take place on the level of a theory because good theories can also be used to predict outcomes (Bacharach, 1989; Wacker, 1998). Prediction on level of a theory can also be useful for understanding of a
relationship between two constructs before we can explain why the constructs are related (Singleton & Straits, 2009, Chapter 2), and hypotheses can be considered as predictions of empirical relationships derived from theory (Sutton & Staw, 1995). Statistical prediction, on the other hand, is concerned with constructing models that are used for calculating useful
predictions, without any reference to a theory about the relationships among the variables. This approach often relies on “models that are strictly predictive, and are not intended to be
explanatory - personnel selection models, expert systems that diagnose or predict problems in complex machines, and quantitative forecasting models would be examples of such models” (Amundson, 1998, p. 342).
Helm, Alaeddini, Stauffer, Bretthauer, and Skolarus’s (2016) recent study is useful for illustrating the difference between statistical prediction and explanation. In this study,
processes and thus focuses on interpreting data about events that have already occurred. Going back to our example, predicting whether and when specific patients are be readmitted differs from explaining why certain patients are more likely to be readmitted than others; the latter is more within the purview of medical rather than OM research, requires that the model is correctly causally specified, and has important implications for interventions, policy, and theory (because the XàY relationship is a causal one).
Therefore, forecasting outcomes, or testing causal relationships among constructs are two distinct issues that often require different kinds of data, research designs, and analysis tools (Shmueli, 2010). For example, neural network techniques have been shown to produce models that predict well, yet the prediction equations are substantively uninterpretable. The distinction between the design and techniques can be clearly seen in the Helm et al. (2016) article, which contains no mention of hypotheses derived from theory, p values, confidence intervals, or any other type of inferential statistical tools typically seen in theory-testing research, but instead relies on applied machine learning (i.e., automated) techniques. Most notably, one does not require a theory to make relevant predictions.
Although guidelines on using PLS state that it is suitable for prediction, the
intervals could be calculated (Shmueli et al., 2016), and evidence is still lacking on the usefulness of these approaches. Indeed, we have not seen a single comparison of PLS against more modern prediction techniques in a real-world prediction setting.
Although PLS is a potentially useful technique for calculating predictions in scenarios where the structure of the model that generated the data is known, it is not clear when this would be the case in real-world prediction problems. Nonetheless, arguments that PLS is optimal for prediction should demonstrate why this 50-year-old algorithm is superior to modern prediction and machine learning techniques such as neural networks (cf., Bishop, 2006; Hastie, Tibshirani, & Friedman, 2013)13. Indeed, although there are a few OM studies that focus on prediction rather than explanation (e.g., Helm et al., 2016; Juran & Schruben, 2004; Karmarkar, 1994; Mazhar, Kara, & Kaebernick, 2007; Vig & Dooley, 1993), none of these studies used PLS, or seem to have considered its use. This is understandable because, except for the R program, matrixpls (Rönkkö, 2016b), none of the currently available PLS software can calculate observation-level predictions based on the PLS estimates (Temme, Kreis, & Hildebrandt, 2010).
4.4.Exploratory vs. Confirmatory Modeling
PLS is often recommended for exploratory studies (e.g., Peng & Lai, 2012; Roberts, Thatcher, & Grover, 2010). Unfortunately, many of the guidelines on PLS and studies applying the method do not clearly explain what they mean by exploratory research or how PLS can be used for exploration (Rönkkö & Evermann, 2013). In their review, Rönkkö and Evermann (2013) identified that the term was used for two different purposes in the PLS literature: (a)
13 PLS regression (a technique similar to principal component regression, where one observed dependent
characterizing theory-focused research in its early stages; and (b) extracting patterns or models from the data. Claims that PLS can serve the first purpose rest on the idea that PLS works well when the accuracy of the model is in question, samples small, and measures may be poor (e.g., Roberts et al., 2010, p. 4338). However, considering that heuristics used to evaluate PLS models cannot detect model misspecification and that both small samples and poor measurement
increase capitalization on chance, recommending PLS for this situation is unjustifiable (Rönkkö & Evermann, 2013).
As to whether PLS can discover patterns in data, it is useful to initially categorize this type of exploratory modeling into two classes: (a) Whether the purpose of the analysis is searching for models that may have generated the data and could have meaningful theoretical implications; and (b) to simply discover patterns in the data without attributing any theoretical meanings to these patterns. The first class can be further divided into two subclasses, depending on whether a researcher sets to discover the model from the data or starts with an initial theory-based model, which is then modified theory-based on the empirical results. The second, largely
descriptive approach can mean “suggesting potential relations among blocks without necessarily making any assumptions regarding which LV model generated the data” (Chin, 2010, p. 663). Such exploratory modeling is amenable to data mining and unsupervised machine learning techniques (Hastie et al., 2013) — techniques that may not be relevant for OM researchers who want to pursue more than merely descriptive summaries of their data.
Modern SEM techniques provide an array of tools for building models from data:
Specification searches have been available in SEM software for decades14, and significant strides have been made in the area of causal discovery algorithms in the SEM literature during recent
years (see Marcoulides & Ing, 2012, for a review; McIntosh et al., 2014). In contrast, it is difficult to find explanations and evidence on how model discovery can be facilitated with PLS, beyond generic assertions that PLS is useful for this kind of research. In fact, two features of the PLS algorithm speak directly against this kind of use. First, in order to analyze a model in PLS software, practitioners require a priori knowledge of both the measurement and structural models. In this sense, therefore, PLS is in fact no different from classical, confirmation-oriented SEM (McIntosh et al., 2014; Rönkkö & Evermann, 2013). Second, although exploratory analysis pertain to situations where the “overall nomological network has not been well understood” (Peng & Lai, 2012, p. 469), PLS uses information from the said nomological network (i.e., the hypothesized pathways among the composites) for calibrating the indicator weights (Dijkstra & Henseler, 2015b; Henseler et al., 2014, 2016). The notion that PLS is oriented toward
exploratory modeling thus inevitably leads to a classic Catch-22: Using PLS in an exploratory manner means the nomological network is unknown, but no model estimates are possible in PLS unless one first specifies a model based on the nomological network (Rönkkö & Evermann, 2013).
Ultimately, the question of whether PLS is a useful technique for exploratory analyses may be moot. Although PLS has been advocated for exploratory analyses, it is only rarely used as such. In their review of PLS-based studies in four leading management journals, Rönkkö and Evermann (2013) found that in all cases, results were presented as confirmatory tests of a priori hypotheses, precisely as we have found in an informal review of PLS-based articles in JOM.
4.5.Formative Measurement
2011). One such assumption is that indicators have causal potency. However, indicators are simply measures, collected by the researcher, and exist as data used for analysis. These measures might reflect factors that cause latent variables, but the measures do not cause anything
(Edwards, 2011; Rigdon, 2013). Equating measures with their corresponding constructs amounts to operationalism, a view of measurement that was discarded decades ago (Campbell, 1960; Messick, 1975). Indeed, formative measurement is actually not measurement at all – in the sense that it describes any real relationships between constructs and their indicators – but rather an unfortunate misnomer for a data aggregation procedure (i.e. indexing; Markus & Borsboom, 2013, p. 172; Rhemtulla, Bork, & Borsboom, 2015).
Aggregating multiple dimensions into a composite is also problematic because it leads to variables that are often uninterpretable (Cadogan & Lee, 2013; Edwards, 2011). All variables, whether they are single observed variables, composites, or latent variables, are fundamentally unidimensional statistical entities. Therefore, to represent multiple dimensions, we need multiple variables (Bollen, 1989, p. 180; Bainter & Bollen, 2015, p. 66). By aggregating several
2013; Edwards, 2001). Indeed, firms do not measure any general notion of "operational performance", but rather its multiple dimensions separately, such as cost and quality.
Aside from conceptual problems in formative models, it is not clear why PLS would be the method of choice for estimating such models. The use of PLS is often justified by stating that formative models have certain requirements to be identified (Bollen & Davis, 2009), and by claiming that PLS would either not require identification or could somehow solve the issue of identification (e.g., Peng & Lai, 2012; Roberts et al., 2010). These claims confuse the concepts of statistical model (a set of equations with free parameters) and estimator (a principle or algorithm for calculating values for the free parameters from the data) (Aguirre-Urreta & Marakas, 2014). Both PLS and ML SEM estimates are completely determined by the sample covariance matrix. If two alternative sets of parameter values for a model produce the same population covariance matrix, is impossible to empirically determine from which of the two models a particular sample originated – this is the definition of model identification. Although model non-identification does not prevent estimation, estimates from non-identified models generally cannot be trusted (Henseler et al., 2016; Rigdon, 1995; Rönkkö, Evermann, et al., 2016). Therefore, the fact that a given statistical software package produces estimates without generating a warning does not mean that identification was addressed, but simply that model identification checks had not been programmed into the software.
The formative model states that indicators cause but do not completely determine the latent variable (Chin, 1998; Henseler et al., 2009). However, PLS involves replacing latent variables with composites, resulting in estimation of a misspecified model (Bollen &
(2016) showed that current empirical evidence resoundingly supports ML SEM over PLS for estimating formative models, and their own simulation study reached the same conclusion.
It seems that the link between formative models and Mode B estimation may have happened accidentally, with no mathematical justification. The statistical model proposed by Wold for use with the PLS algorithm was identical to the original LISREL model (Jöreskog & Wold, 1982), which disallows regression paths originating from measured variables (Bollen, 1989, Chapter 9)15. Rather, the idea appears to originate from an article by Fornell and Bookstein (1982), where the authors confuse the Mode A and Mode B weighting routines with the statistical model being estimated (Rönkkö, Evermann, et al., 2016). However, the model presented by Fornell and Bookstein was not a full formative model, because the error term of the model remained fixed at zero (1982, e.g., p. 446). The first time that a full formative model with an error term for the formative latent variable appeared in the PLS literature seems to be in a book chapter by Fornell and Cha (1994), where the authors also argue that the formative relations and the composite weights are conceptually different, thus contradicting the work by Fornell and Bookstein that presented these as the same. After this book chapter, presenting the formative model and the weights as distinct concepts became a standard practice in the PLS literature (e.g., Chin, 1998, eq. 1, 7, 9; Henseler et al., 2009, eq. 1, 3, 5). Indeed, more recent work has appears to have rediscovered Wold’s original intent: Rather than representing different measurement models, Mode A and Mode B are simply different ways to weight indicators (Rigdon, 2012; Rönkkö, Evermann, et al., 2016). According to Wold (1982), the choice is practical: “Choose Mode B for the exogenous LV's and Mode A for the endogenous LV's” (p. 11), which is also
15 Bollen (1989, pp. 311–312) suggest a workaround in which formative indicators are included as latent
consistent with using the method for predicting the indicators of endogenous composites from the indicators of exogenous composites (Evermann & Tate, 2016).
5. Can the Problems with PLS be Fixed?
In recent years, several attempts have been made to rectify some of the key shortcomings of PLS. However, these purported remedies do not address all problems with the estimator, as the root causes of many of these are that: (1) the sampling distribution of the PLS weights remains unknown; and (2) the weights have been shown to capitalize on chance. Therefore the logical remedy would be to abandon the PLS weights in favor of better understood and robust alternatives such as unit weights (Rönkkö, McIntosh, & Aguirre-Urreta, 2016) thus also
obviating the need for specialized software packages. However, this solution does not appear to be acceptable in the pro-PLS literature. In this section, we critically review some of the recent enhancements to PLS and introduce some links to prior literature that are missing from the articles promoting these techniques.
Based on the issues discussed thus far, it is clear that “like a hammer is a suboptimal tool to fix screws, PLS is a suboptimal tool to estimate common factor models” (Henseler, 2014) and that “if the common factor model is correct, the choice between factor-based SEM and PLS path modeling is really no choice at all” (Rigdon, 2012, p. 344). Given that factor-based models are central to theory-focused research16, it follows that PLS is not useful for this type of application. Regarding this concern, two new streams of work have recently emerged. On one hand, there are efforts to fix the problems of PLS as an estimator for latent variable models; on the other hand, some researchers have started to advocate alternatives to factor models, for which PLS would presumably be suitable. In what follows, we address these two streams of research.
16 The majority of theory-focused studies in OM use scales with multiple parallel items and assess their
5.1.Composite Factor Model
The “composite factor model” (CFM) was introduced into the PLS literature by Henseler et al. (2014) to counter Rönkkö and Evermann (2013)’s criticism toward PLS. The CFM was presented as a generalization of the common factor model where all error correlations between the indicators of a construct are freely estimated. However, the CFM entails serious conceptual sleights of hand, as well as basic statistical shortcomings. For example, Henseler et al.’s (2014) assertion that “PLS is clearly [a] SEM method that is designed to estimate composite factor models” (p. 187) is fundamentally inconsistent with much of the PLS literature, which has traditionally focused on common factor models (McIntosh et al., 2014). Moreover, using the label “composite” is actually a misnomer because the CFM does not actually contain any composite variables (McIntosh et al., 2014), and will likely only confuse applied researchers further. Furthermore, the CFM is not identified, and “research resources devoted to estimating and testing an underidentified model may ultimately be wasted” (Rigdon, 1995, p. 359). Thus, we conclude that the CFM is a meaningless construction that serves no purpose in either methodological or applied research.
5.2.Composites as Proxies for Constructs
Another perspective that is currently gaining traction in the PLS literature is to reject the common factor model altogether and instead treat composites as proxies (approximations) of theoretical constructs (conceptual variables). In contrast to the formative measurement
models do not always fit the data well. However, the argument that factors are simply proxies for, rather than isomorphic with, theoretical constructs is a specious critique. It is well-known that at best, factors are simply approximations of constructs and their interrelationships
(MacCallum, Browne, & Cai, 2007). Furthermore, that factor models do not always fit the data is true, but responding by shifting to composite-based modeling (Henseler et al., 2016) is
misguided, as researchers should instead diagnose the model to discover the sources of misfit, which are themselves informative (Kline, 2011, Chapter 8). Misfit can signify that the indicators are not unidimensional or that the measurement errors are not independent, which are both problems that should be addressed rather than ignored.
Adopting a composite-based approach to modeling implies that measurement models and hence, measurement theory can be disregarded. Ignoring measurement models leaves indicators without theoretical meaning, thus disallowing abstraction beyond the observed data (Bollen & Diamantopoulos, 2015). Conversely, retaining measurement theory, but rejecting just the idea that these theories can be modeled statistically, is at loggerheads with the position that statistical modeling of substantive theory would be useful, essentially leaving a large methodological hole in terms of theory (dis)confirmation. As an alternative to traditional measurement model
validation, Rigdon (2012, p. 354) suggests using the composite proxies as “forecasts”, in order to determine “the magnitude of the gap between proxy and concept.” However, given that it only possible to measure the proxy (and not the concept), it is unclear how one could ever assess the adequacy of the predictions derived from such a framework, or more fundamentally, evaluate the discrepancy between the proxy and the concept (Dijkstra, 2014).
results. For example, in the Peng and Lai (2012) study, it is unclear why the observed indicator “On time delivery performance” should receive a weight four times as large as the weight for “Unit cost of manufacturing” (Table 4). There is no apparent theoretical or managerial justification for these weights. A better alternative would be to combine the items based on a priori defined index weights (Howell, Breivik, & Wilcox, 2013; Lee & Cadogan, 2013), which facilitates clear interpretation of the composite that does not vary across samples or models. 5.3.Consistent PLS
Another approach to improving PLS has been to make the estimator suitable to factor models. Pioneered by Dijkstra and his colleagues (Dijkstra & Henseler, 2015a, 2015b; Dijkstra & Schermelleh-Engel, 2014) and showcased in recent special issues (Sarstedt et al., 2014), consistent PLS (PLSc) removes the inconsistency of PLS estimates by correcting for
measurement error. PLSc starts by estimating factor loadings using a modified version of the minimum residuals (MINRES) estimator, an early factor analysis technique (Harman & Jones, 1966) that is now largely obsolete (Bartholomew, Knott, & Moustaki, 2011, sec. 3.9). PLSc augments the MINRES estimator by constraining the factor loadings to be proportional to PLS weights. Next, the correlation matrix of the composites is corrected for attenuation using
reliability estimates based on the estimated loadings, and the adjusted correlation matrix is used in OLS estimation17. This procedure produces a consistent estimator for correctly specified factor models, but it is not without problems.
17 Dijkstra and Henseler (2015a) note that two stage least squares (2SLS) can be applied instead of OLS
First, why constraining loadings to be proportional to PLS weights produces better estimates than MINRES or other factor analysis techniques is unclear. Indeed, both Huang (2013) and Rönkkö, McIntosh, and Aguirre-Urreta (2016) showed that PLSc is less precise, more biased and has twice the variance compared to ML or MINRES. Second, because the weights are proportional to estimated loadings, indicators with positive loadings are over-weighted, leading to positive bias in the reliability estimates (Rönkkö, McIntosh, et al., 2016). Third, because correlations between the PLS composites are inflated by capitalization on chance, the expected value of these correlations depends on the sample size, making the sample composite
correlations biased estimators of their population counterparts. Fourth, the use of parametric significance tests in PLSc (e.g., t test) remains problematic for the same reasons described in Section 3.5. To be sure, the negative bias caused by under-correcting for attenuation (due to positively biased reliability estimates) could cancel out the effects of capitalization on chance, resulting in negligible overall bias (Dijkstra & Henseler, 2015a, 2015b). However, this scenario is unlikely in real data, and studies show that the PLSc estimator can be substantially more biased and less efficient than ML SEM (Huang, 2013; Rönkkö, McIntosh, et al., 2016).18
The problems with PLSc can be eliminated by simply constructing composites with unit-weights and estimating their reliabilities based on traditional factor analysis techniques (Rönkkö, McIntosh, et al., 2016). Although these techniques have been combined with the correction for
18 Huang (Bentler & Huang, 2014; Huang, 2013) proposed two extensions to PLSc, labeled PLSe1 and
attenuation for decades, the correction for attenuation is no longer widely-used because it tends to produce inadmissible correlation estimates and is less efficient than modern SEM techniques (Cohen et al., 2003, pp. 55–57; Muchinsky, 1996); therefore, it is considered obsolete by some researchers (e.g., Dimitruk, Schermelleh-Engel, Kelava, & Moosbrugger, 2007). Moreover, modern SEM techniques are more flexible and efficient (McIntosh et al., 2014; see also Henseler et al., 2016).
5.4.Model Testing and Inference
In addition to improving the properties of PLS as an estimator, recent research has also proposed a number of new approaches for statistical inference and model evaluation. As part of the development of PLSc, Dijkstra and Henseler (2015a) have constructed global fit statistics (like the SEM χ2 statistic) for PLS to test the discrepancies between the observed and model-implied covariances for the indicator variables, and recent guidelines advocate these new global test statistics (Henseler et al., 2016). Because the sampling distribution of the PLS weights is unknown (Dijkstra, 1983), the test statistics cannot be expected to follow the χ2 or any other known distribution. Thus, Djikstra and Henseler (2015a) proposed simulating the reference distribution via bootstrapping. They showed that the technique did not result in excessive Type I error rates; however, there is currently no evidence demonstrating whether this approach can actually detect misspecification.
Calantone, and Ramirez (2015), who demonstrated its usefulness19. Although this statistic avoids the use of PLS, the information it provides is less comprehensive than that yielded by
confirmatory factor analysis (Cho & Kim, 2015; Shaffer, DeGeest, & Li, 2015).
Lastly, to deal with bimodal coefficient distributions on significance testing, Henseler et al. (2014) suggested using empirical confidence intervals (i.e., lower and upper limits chosen from the bootstrap distribution). Because this method does not require a theoretical probability distribution (the t distribution), one can ignore the normality assumption (Davison & Hinkley, 1997, Chapter 5). However, the scenarios under which empirical CIs have been studied with PLS are limited. Particularly, even though the BCa intervals that correct for skewness in the estimates are promising (Henseler et al., 2014), it is not clear how the approach performs with the bimodal distributions that plague PLS estimates.
6. “PLS-SEM”: A Misleading Label
What do consumers expect in a label? Truth in advertising—a label should be a clear, honest, and informative signal. In the case of PLS, we have recently been witnessing a feat of prestidigitation, namely the explicit advertising of PLS as a SEM technique. A rebranding effort has culminated in relabeling what was known as Partial Least Squares Path Modeling (PLS-PM) as Partial Least Squares Structural Equation Modeling (PLS-SEM) (e.g., Hair et al., 2014, 2011). This marketing effort has been extremely successful, with the use of PLS increasing about three-fold in the last five years (cf., Rönkkö, 2014b). Concurrently, however, many researchers,
19 Note that Voorhees, Brady, Calantone, and Ramirez (2015) use a factor correlation of 0.9 as their lack of
including some writing about the method (e.g., Lu, Kwan, Thomas, & Cedzynski, 2011), appear to have forgotten that PLS is simply regression with weighted sums of the indicators.
The question of whether PLS is a SEM technique is not useful, because the discussion reduces to a debate over definitions. PLS is as much SEM as is any other form of regression with scale scores, regardless of indicator weightings (McIntosh et al., 2014; Rönkkö & Evermann, 2013; Rönkkö et al., 2015). However, two questions relevant for research practice are whether: (a) PLS possesses the capabilities that one expects from an SEM technique; and (b) the labeling of PLS as a SEM technique clarifies or obscures what the technique does. The most common capabilities that researchers usually want in SEM techniques are the ability to model latent variables and measurement errors, as well as formally test the fit between the model and the observed data (Chin, 1998, p. 297; Kline, 2011, Chapter 1; Shah & Goldstein, 2006). Based on our assessment thus far, it is clear that PLS, in its original form and as it is currently used, does not provide these capabilities. Moreover, the labeling obscures that PLS is simply a series of OLS regressions with scale scores that does not account for measurement error, as exemplified by the following quote from Oh et al. (2012): “Although a series of multiple regression analyses could be used to test the model, PLS is a better approach because it can simultaneously account for measurement errors for unobserved constructs and examine the significance of structural paths.” (p. 374). Therefore, simply using the “PLS-SEM” label to place the technique in the same league as well-established SEM techniques can undeservedly enhance its reputation and perceived capabilities merely by association.
scale scores. For example, summarizing multiple indicators as one scale score must be preceded by a factor analysis to analyze the dimensionality of the data and justify aggregating the
measures (e.g., Cho & Kim, 2015). Also, the application of OLS regression should always be followed by residual diagnostics (e.g., Fox, 1997), neither of which are followed in empirical applications of PLS or guidelines explaining the technique. However, adopting these techniques would of course not solve the problems inherent in the use of PLS weights for calculating the scale scores.
As an example of an erroneous analysis, consider the study by Liang, Saraf, and Hu (2007), in which PLS was incorrectly used as the vehicle for an SEM-based procedure, namely the “unmeasured latent method construct” (ULMC) model for diagnosing and controlling for common method variance20. This SEM strategy is based on modeling the indicator variance as trait, method, and random error components by regressing each indicator on both a latent variable representing the construct that the indicator measures and a method factor shared by all indicators. Liang et al. implemented this technique by combining the indicators into composites representing the constructs as well as a global “method” composite consisting of all indicators, on which all indicators were also regressed. This modeling strategy cannot remove any method variance from the composites, because no matter how the indicators are weighted, the
composites will always be contaminated with the same sources of error as the indicators. Yet, incorrectly believing that PLS would have the capabilities of modern SEM techniques has misled a large number of researchers into believing that the ULMC method as presented by Liang et al. would work (Chin, Thatcher, & Wright, 2012), including a few authors in JOM (Kortmann,
20 The ULMC technique is not without its problems (Richardson, Simmering, & Sturman, 2009), but these
Gelhard, Zimmermann, & Piller, 2014; Oh et al., 2012; Perols, Zimmermann, & Kortmann, 2013; Rosenzweig, 2009).
7. Some Concluding Remarks
Some OM researchers who are heavily invested in applying PLS might have been disturbed by the recent JOM editorial (Guide & Ketokivi, 2015), which announced that articles using the technique are likely to be desk-rejected. However, JOM readers should carefully consider the core message of the editorial, which states that to justify the PLS method, “rhetorical appeals must be replaced with methodological justification” (Guide & Ketokivi, 2015, p. vii). Merely saying that a method is good for a particular purpose does not make it so. Rather, applied researchers should keep in mind the possibility that the person making the
statement is simply: (a) making an honest mistake; or (b) intentionally misrepresenting the merits and weaknesses of the technique. Thus, neither the number of authors advocating PLS nor the number of articles that apply PLS are relevant to the inherent problems with this method. These issues are not matters of opinion; there are fundamental methodological problems that speak for themselves. As such, authors who might consider using PLS should not rely on the weight of opinion or who expressed these opinions, but instead should focus on the substance of the matters involved seeking out and verifying the methodological foundations for any claims. We believe that a critical and unbiased evaluation of these claims will lead to the conclusion that PLS is inferior to other methods for constructing scales scores, particularly the even simpler approach of using unit-weights (Bobko et al., 2007; Cohen, 1990).