PHONETIC MOTIVATION FOR DIACHRONIC SOUND CHANGE IN BANTU LANGUAGES AS EVIDENCED BY VOICELESS PRENASALIZED STOP PERCEPTION
BY NATIVE SOMALI CHIZIGULA SPEAKERS
Haley Boone
A thesis submitted to the faculty at the University of North Carolina at Chapel Hill in partial fulfillment of the requirements for the degree of Master of Arts in the Department of Linguistics.
Chapel Hill 2018
© 2018 Haley Boone
ABSTRACT
Haley Boone: Phonetic Motivation for Diachronic Sound Change in Bantu Languages as Evidenced by Voiceless Prenasalized Stop Perception by Native Somali Chizigula Speakers
(Under the direction of A. Elliott Moreton)
Two hypotheses were tested as triggering nasal effacement (leaving an aspiration contrast) in voiceless prenasalized stops in Bantu languages:
Aspiration is more reliably produced than voiceless nasalization. Voiceless nasalization is harder to hear than aspiration.
Productions from two Somali Chizigula speakers were measured to test the cue reliability of nasalization amplitude versus aspiration duration. Aspiration is a more reliably produced cue, providing better distinction between voiceless stops.
The perception of voiceless nasalization and aspiration by 10 Somali Chizigula participants was tested. Native productions of voiceless prenasalized and plain stops were cross-spliced to contain pre-burst information from one stop type and post-burst from the other. Participants then
identified each stimulus as prenasalized or plain.
Nasalized-only stimuli were identified as “prenasalized” significantly less than control
prenasalized stimuli, but aspirated-only stimuli did not receive significantly less “prenasalized” responses than prenasalized controls.
ACKNOWLEDGEMENTS
TABLE OF CONTENTS
TABLE OF CONTENTS ... vi
LIST OF FIGURES ... viii
Chapter 1: Introduction ... 1
1. Summary, Background, and Introduction ... 1
1.1. Summary ... 1
1.2. Sound and Language Background ... 3
1.2.1. Prenasalized stops ... 3
1.2.2. Segment status ... 4
1.2.3. Bantu Languages and Prenasalized stops ... 5
1.2.4. Historical change in Bantu languages ... 6
1.2.5. Somali Chizigula Background ... 8
1.2.6. Somali Chizigula in Boise ... 9
1.3. Study Background ... 9
1.3.1. Aerodynamic Studies ... 9
1.3.2. Acoustic Study ... 10
1.3.3. Huffman and Hinnebusch’s Theory ... 11
1.3.4. Current Proposal ... 12
Chapter 2: Cue Reliability ... 15
2.2. Cue Reliability and Sound Change ... 19
2.3. Cue Reliability in Somali Chizigula ... 20
Chapter 3: Perception Experiment ... 31
3. Perception Experiment ... 31
3.1. Hypothesis and Predictions ... 31
3.1.1. Hypothesis ... 31
3.1.2. Predictions ... 31
3.2. Perception Experiment Methods ... 33
3.2.1. Participants ... 33
3.2.2. Study Synopsis ... 33
3.2.3. Materials ... 34
3.2.4. Procedure ... 40
3.3. Analysis and Results ... 42
3.3.1. Analysis ... 42
3.3.2. Stimuli effects ... 46
Chapter 4: Conclusions ... 50
4. Discussion ... 50
4.1. Perception and Cue weighting Discussion ... 50
4.2. Implications for Sound Change ... 51
LIST OF FIGURES
Figure 1: Prenasalized Stops Aerodynamic Data... 10
Figure 2: /m̥phapa/ waveform/spectrogram ... 11
Figure 3: Cue Reliability ... 16
Figure 4: Reliability Sample ... 17
Figure 5: Shape Assortment ... 17
Figure 6: Color Assortment ... 18
Figure 7: /mphalala/ spectral tilt ... 23
Figure 8: /palapaʧa/ spectral tilt ... 24
Figure 9: /m̥phera/ intensity...25
Figure 10: /pera/ intensity... ... 25
Figure 11: Reliability of VOT vs. Pre-burst Amplitude: Spectral Tilt ... 26
Figure 12: Reliability of VOT vs. Pre-burst Amplitude: Relative Intensity ... 27
Figure 13: F0, F1, F2 and F3 Averages ... 38
Figure 14: same-spliced /mphera/...39
Figure 15: same-spliced /pera/... ... 39
Figure 16: cross-spliced [mpera]...39
Figure 17: cross-spliced [phera]... ... 39
Figure 18: Results of Perception Study ... 44
Chapter 1: Introduction
1.
Summary, Background, and Introduction
1.1.
Summary
This study examined the current state of Somali Chizigula voiceless prenasalized stops and historical data from other languages in an attempt to explain nasal effacement (deletion of the nasalization) in Bantu prenasalized stops. This sound change is claimed to have taken place in other Bantu languages (Huffman and Hinnebusch, 1998).
This paper will explore two theories of sound change: 1. that cue reliability leads to cue weighting – a “preference” for reliable cues and possibly the deletion of unreliable cues
(following Toscano and McMurray, 2010) – and 2. that the difficulty of perception leads to the deletion of hard-to-hear cues (proposed by Huffman and Hinnebusch, 1998).
Measurements of nasalization amplitude versus aspiration duration in Somali Chizigula voiceless prenasalized and plain stops will be used as evidence for cue reliability leading to sound change. The results will show that the length of the VOT (aspiration) is a more consistent cue for
A perception study testing the cues that listeners focus on when discriminating between voiceless plain stops and voiceless prenasalized stops was used to test the hypothesis, proposed by
Huffman and Hinnebusch (1998), that devoicing of the nasalization in voiceless prenasalized stops leads to the deletion of the nasalization due to the difficulty listeners experience in hearing the cue. The results of this study show that, when participants have only either aspiration or nasalization to use in identifying voiceless prenasalized stops versus plain stops, stops with only nasalization lead to significantly less “prenasalized” responses than having both cues. Stops which lack nasalization but have significant aspiration (more than 60 ms.), however, do not lead to significantly less “prenasalized” responses than stimuli containing both cues.
Taken individually, both the cue weighting measurements and the perception study predict that Somali Chizigula will follow the same sound change that has taken place in other Bantu
languages. Each, therefore, offers a possible explanation for nasal effacement as it has been known to have taken place already.
However, comparing the cue reliability to the perception study results, one would expect to see a greater difference between the nasalized-only and aspirated-only stimuli than one does if
aspiration is weighted more heavily than nasalization. It appears that participants will accept either the presence of nasalization or aspiration as an indication that a sound is prenasalized, without taking into account the brevity of the aspiration, as is expected if they are basing their identification of prenasalized and plain stops mainly on aspiration length.
The paper will organize the information as follows:
Chizigula as it compares to other Bantu languages. This chapter will also explain research already done on prenasalized stops in Somali Chizigula, which led to the current study.
Chapter 2 will introduce the role of Cue Reliability in sound change and discuss the reliability of relevant cues in Somali Chizigula voiceless prenasalized stops, in comparison with voiceless plain stops in the language.
Chapter 3 explains the main hypothesis, that removing nasalization from prenasalized stops will not lead to significantly less “prenasalized” responses than true prenasalized stops, but that when aspiration is removed from prenasalized stops, participants will identify the sound as
prenasalized significantly less than actual prenasalized stops. This chapter will then outline my predictions about the perception study results, the methods of the study and the actual results.
Finally, Chapter 4 will discuss the results of the perception study and cue reliability in light of the predicted sound change, and will suggest further avenues of study that could build on the information presented here.
1.2.
Sound and Language Background
1.2.1. Prenasalized stops
had voiceless prenasalized consonants, even if the voiceless state of nasalization was never captured by researchers in that particular language. The study presented here will argue that this devoicing of the nasalization, due to the difficulty in perceiving it, in turn led to the current inventories of many Bantu languages, which lack voiceless prenasalized consonants but contain their voiced counterparts.
1.2.2. Segment status
Proof of prenasalized segments being, in fact, segments, rather than clusters, is phonological in nature rather than phonetic. That is to say, according to Maddieson and Ladefoged (1993) there is no line that can be drawn between prenasalized stops and NC clusters based on the phonetics of the sound. Length of the sound, which is often cited as a test for segmentalization, they suggest, is not a reliable test, citing that different simple consonants within a single language may vary considerably in length. Voicing assimilation is also not a valid measure, as individual segments often undergo assimilation to adjacent sounds in various languages, with no claims that they are actually realized as part of the adjacent sound.
Thus, according to Maddieson and Ladefoged, the only way to claim segment status for prenasalized stops is on a phonological basis. These sounds have, therefore, been subjected to syllable-splitting tasks, compared with other consonant clusters (or lack thereof) in the language in question, and so on, in hopes of proving the existence or non-existence of this segment. These tasks lead most to accept prenasalized stops as a single segment, at least in its surface form (see Casali, 1993; Downing, 2005 for arguments on segment status, or Tak, 2011 for discussion on underlying forms).
question are analyzed as part of a single segment, rather than being the deletion of one segment in a consonant cluster. Therefore, I will continue to refer to prenasalized stops, in this paper, as a single segment, following the tradition laid out by others who have studied this language and similar sounds in related languages (Maddieson and Ladefoged, 1993; Casali, 1995; Hinnebusch, 1975; Temkin Martinez and Rosenbaum, 2017).
1.2.3. Bantu Languages and Prenasalized stops
Prenasalized stops are well-documented in Bantu languages, with detailed acoustic studies of the sound as it is manifested in different languages done by Maddieson and Ladefoged (Maddieson and Ladefoged, 1993; 1996; Maddieson, 2003). The voiced prenasalized stops are particularly prevalent in Bantu languages, with many fewer languages containing a voiceless prenasalized stop. Those which do not have voiceless prenasalized stops often have aspirated stops,
particularly word- and stem-initially, contrasting with unaspirated stops and/or word-medial prenasalized stops or nasal-consonant clusters (Nurse and Philippson, 2003).
Prenasalized stops in Bantu languages are the result of a morpheme reanalysis in Proto-Bantu. Bantu languages have 18 noun classes, each which takes an obligatory prefix. The noun classes in question, 9 and 10, were historically marked by mu- and ni-, but deletion of the vowels resulted in nasals prefixing to stems beginning with other consonants, most often stops (Schadeberg, 2003). Over time, different Bantu languages have reanalyzed this cluster in
different ways, but often as a prenasalized stop. In a few languages, prenasalized fricatives have also been attested, but these are particularly prone to misperception, leading to rapid nasal effacement (Busa and Ohala,1995; Hinnebusch, 1975).
nasal segments preceding voiceless consonants. Bantu languages have a tendency to allow only CV or V syllables, and possibly syllabic nasal syllables. Clusters are generally not allowed in these languages. To satisfy the constraint against nasal-consonant clusters, or, arguably, against clusters in general (see Archangeli, et al., 1998 for arguments about this being the outcome of cluster reduction in general), nasals are either syllabic before consonants in many Bantu languages (Somali Chizigula included), or the nasal and the following consonant are combined into a single segment. This second correction results in prenasalized consonants, usually stops, which are generally produced with a voiced nasal portion, regardless of the voicing
specifications of the following consonant.
The current state of prenasalized stops in Somali Chizigula, where, at least word-initially, the nasalization is voiceless (partial voicing is retained word-medially), appears to be the step between pre-nasalization of the stops and deletion of the nasalization (Temkin Martinez and Boone, 2016), which, when analyzed in terms of difficulty of perception and compared with the sound inventories of other languages, suggests a cause for the sound change concluded to have already taken place in many Bantu languages. This phonetic realization, in turn, leads to reanalysis and diachronic sound change (usually deletion of the nasal portion), due to the difficulty of hearing voiceless nasalization and the fact that aspiration provides an accurate secondary cue for distinguishing the phoneme, making the nasalization superfluous.
1.2.4. Historical change in Bantu languages
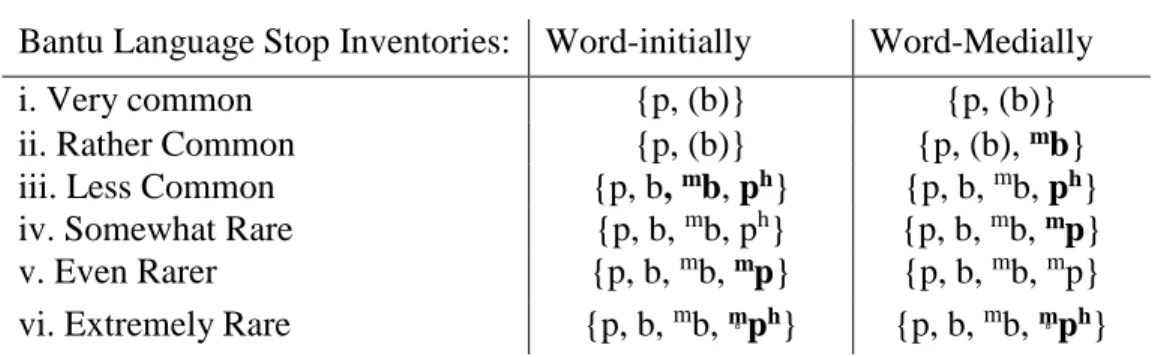
Bantu languages tend to have plain stops in their inventory, sometimes, though not always, with a voicing contrast (i). A subset of these languages also allow voiced prenasalized stops in contrast with plain stops. These prenasalized stops occur in more languages word-medially than or stem-initially (ii, iii). In a smaller subset, voiceless prenasalized stops occur word-medially with voiced nasalization. In these languages which have voiced but no voiceless prenasalized stops word-initially, there is often an aspiration contrast word-initially (iii, iv). Some languages have voiceless prenasalized stops with voiced nasal airflow in both positions (v), and a very few show varying degrees of devoicing of the nasal, particularly word- and stem-initially, and post-burst aspiration (vi) (Nurse and Philippson, 2003).
Table 1: Bantu Stop Inventories
Bantu Language Stop Inventories: Word-initially Word-Medially
i. Very common {p, (b)} {p, (b)}
ii. Rather Common {p, (b)} {p, (b), mb}
iii. Less Common {p, b, mb, ph} {p, b, mb, ph} iv. Somewhat Rare {p, b, mb, ph} {p, b, mb, mp} v. Even Rarer {p, b, mb, mp} {p, b, mb, mp} vi. Extremely Rare {p, b, mb, m̥ph} {p, b, mb,m̥ph} Notably, there are no inventories with both aspirated stops and voiceless prenasalized stops allowed in the same position (to the author’s knowledge). Given this trend, it has been proposed by various researchers (Hinnebusch, 1975; Contini-Morava, 1997; Maddieson, 2003) that
historically, in many other Bantu languages, following the deletion of the vowel in class 9 and 10 prefixes and subsequent fusion of the nasal and the following consonant, the voiceless
prenasalized stop as we see in Chizigula is an intermediate step on the way to effacement. The phoneme which historically included a voiced nasal portion before a voiceless stop has at this point undergone full devoicing word-initially, and will eventually undergo deletion of the voiceless nasal. Thus, Somali Chizigula provides the opportunity to test theories about Bantu nasal effacement specifically, and sound change in general – at least well-attested, one-way sound changes.
1.2.5. Somali Chizigula Background
Somali Chizigula (also known as Mushungulu, Mushunguli, or Zigua) is a Bantu language spoken by the descendants of Kizigua-speakers brought to Somalia from Tanzania as slaves some two hundred years past (Temkin Martinez and Rosenbaum, 2017). After escaping, they built a community in the Lower Jubba Valley of Somalia, and since then the two language varieties (Tanzanian Kizigua and Somali Chizigula) have diverged to the point of being mutually unintelligible.
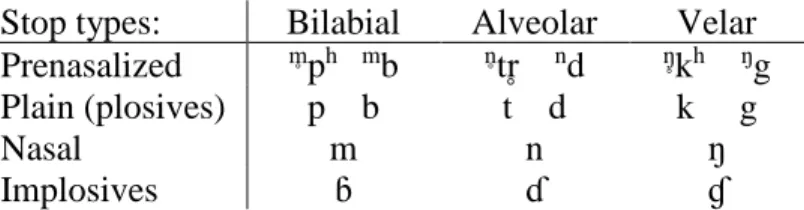
Somali Chizigula has a rather large inventory of stops, including plain stops, nasal stops,
implosives and prenasalized stops. There is a voicing contrast in plain and prenasalized stops. A table showing the stop inventory follows:
Table 2: Stop types in Somali Chizigula
Stop types: Bilabial Alveolar Velar Prenasalized m̥ph mb n̥tr̥ nd ŋ̥kh ŋg Plain (plosives) p b t d k g
Nasal m n ŋ
Implosives ɓ ɗ ɠ
language, and is believed to be a realization of the aspiration of the prenasalized alveolar consonant (Temkin Martinez and Boone, 2016).
1.2.6. Somali Chizigula in Boise
In 2011, Mwaliko Mberwa, Jon P. Dayley and Michal Temkin Martinez began documentation of Somali Chizigula at Boise State University (Temkin Martinez and Rosenbaum, 2017). The initial assumption about the state of prenasalized stops in Somali Chizigula was that, like other Bantu languages, Chizigula voiceless prenasalized stops had undergone effacement of the nasal portion of the segment, leaving an aspiration contrast between voiceless prenasalized stops and plain voiceless stops. Intuitions from the native speaker consultant led to the conclusion that there were, in fact, still voiceless prenasalized stops present in the language, which spurred acoustic and aerodynamic studies of these sounds (Temkin Martinez and Boone, 2016; Temkin Martinez and Rosenbaum, 2017).
1.3.
Study Background
1.3.1. Aerodynamic Studies
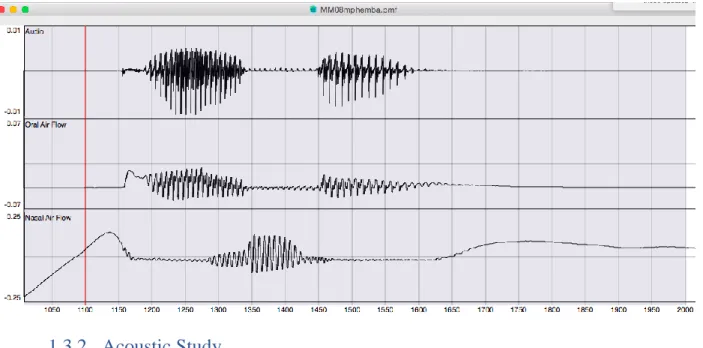
Following discovery of the voiceless prenasalized stops in Somali Chizigula, Temkin Martinez led two studies on the sounds, once with Rosenbaum and later with the author (Temkin Martinez and Boone, 2016; Temkin Martinez and Rosenbaum, 2017), which analyzed the acoustic and aerodynamic properties of this sound using nasal and oral masks to measure airflow and voicing during the production of these stops both word-initially and word-medially. Aerodynamic evidence shows robust, voiceless nasal airflow in the production of word-initial voiceless prenasalized stops, lasting between approximately 65 and 100 ms, as well as significant
falls closer to 20 ms. Word-medial voiceless prenasalized stops have partial voicing of the nasal portion. The current study does not focus on the sound in this position, as acoustic cues in this position would differ somewhat from word-initial cues, and voiceless prenasalized stops in this position have proven to be more resilient to effacement than word initially (Contini-Morava, 1997; Nurse and Philippson, 2003)
As is evident in the following figure, nasal airflow (shown in the third channel) spikes at the beginning of the word during the production of [m̥ph], but there is no periodicity, as there is for the word-medial voiced prenasalized stop [mb]. The second channel shows a spike in oral airflow (aspiration) lasting approximately 50 ms. after the release of the stop.
Figure 1: Prenasalized Stops Aerodynamic Data
1.3.2. Acoustic Study
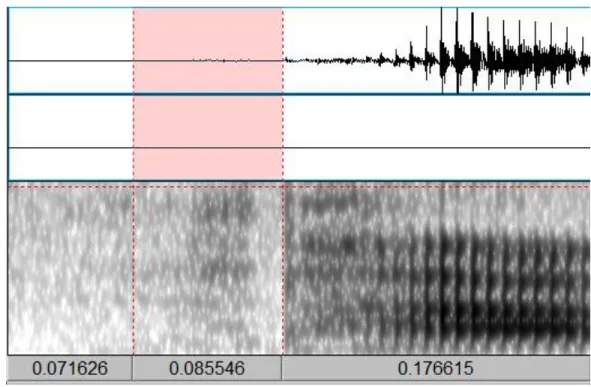
signal during the nasal portion was much lower amplitude than the aspirated portion and is in fact difficult to see in spectrograms and usually not at all evident in waveforms.
The following image, Figure 2: /m̥phapa/, shows the nasal portion of the word [m̥phapa]
highlighted to show the relative amplitude of the nasal and aspirated portions, evident both by inspection of the waveform, which shows almost no signal during the nasal portion and
significantly higher amplitude sound following the release of the stop before the vowel begins, and of the spectrogram during these two portions, which also shows an apparent difference in the amplitude of the two parts, indicated by the darkness of the signal during the aspirated portion.
Figure 2: /m̥phapa/ waveform/spectrogram
1.3.3. Huffman and Hinnebusch’s Theory
of the nasal portion of the stop word-initially. Huffman and Hinnebusch state that this is an outcome of imprecision of the timing of gestures involved in the articulation of prenasalized stops, which require the vocal folds to stop vibrating, the velum to raise and the oral cavity to open all in proper sequence (cessation of vocal fold vibration and full velum closure should be simultaneous).
Though Huffman and Hinnebusch do not use this terminology, it seems that they would agree that this leads to the process of phonologization, as defined by Hyman (1972; 2013), whereby natural acoustic consequences of coarticulation become reanalyzed by speakers as part of the phonology – in this case, speakers overextend a devoicing process to the entire nasal portion. Huffman and Hinnebusch’s hypothesis is that, when this full devoicing occurs, as they have claimed likely took place in many Bantu languages prior to full nasal effacement, it is often heard as a simple stop, leading to the loss of nasalization altogether.
Thus, Huffman and Hinnebusch claim that sound change (at least the sound change in question) is motivated first by articulatory difficulty, which eventually leads to the prenasalized stop being interpreted as an aspirated stop void of nasalization because of the inability to perceive voiceless nasalization.
1.3.4. Current Proposal
As mentioned, Somali Chizigula, the language used in this study, has the same voiceless
prenasalized stops as are found in Huffman and Hinnebusch’s Pokomo, but with totally devoiced nasal air flow word-initially. In addition to containing voiceless nasalization prior to the stop burst, these sounds are produced with significant aspiration following the burst, a cue which is claimed to have developed at the same time as devoicing took place, though which phenomenon caused the other is disputed (see Hinnebusch, 1975; Contini-Morava, 1997; and Hyman, 2003 for discussion of aspiration development in connection with nasal devoicing).
Assuming the difficulty of articulation as the motivation behind devoicing of the nasal portion of voiceless prenasalized stops, and the development of aspiration as a redundant cue, and
presuming that the same sound change which has taken place in many related languages began with devoicing in all of those languages, as seen in Somali Chizigula, this study explores the role of perception, and then the possibility of reliability of cue production, as factors leading to reanalysis of these stops as simple aspirated stops – the sound change predicted to follow devoicing of nasalization in these sounds.
It will be claimed in this paper that the sound change from a voiceless prenasalized stop to an aspirated stop, already attested in many languages, is an outcome of the “misproduction” of the nasalization leading to misperception, as suggested by Huffman and Hinnebusch; that related languages have at some point in their history likely undergone a state of voiceless
pre-nasalization similar to the current production of voiceless prenasalized stops in Somali
plain stops in the language, and 3. evidence from the productions of native speakers that cues from aspiration are consistently produced, allowing for identification of each phoneme regardless of whether nasalization is heard.
Chapter 2: Cue Reliability
2.
Cue Weighting and Reliability
2.1.
Introduction
Takagi and Mann (1995), and Cebrian (2006), along with others, have noted the tendency for different speakers (in these cases second-language learners as opposed to first-language
speakers) to rely on different cues to identify segments. That is, when there are multiple cues or features which differ between two phonemes, learners can reasonably focus on either cue (or consider both cues equally) when trying to identify which phoneme they are hearing. This has been studied in second language learners of English distinguishing /i/ from /ɪ/, (Cebrian, 2006) where L1 speakers rely more heavily on formants, whereas L2 speakers rely on the duration of the vowel to distinguish these two sounds. Takagi and Mann (1995) found similar results in L1 Japanese learners of English, who used formant cues differently than L1 English speakers in distinguishing /l/ from /r/.
The cue preference that will be explored in this paper involves the perception of nasal airflow versus aspiration in voiceless prenasalized stops, as defined in section 1.2.1.
cues with more compact clusters and less overlap between the intended categories to split them; that is, they learn to weight cues based on how well that cue predicts the proper phoneme.
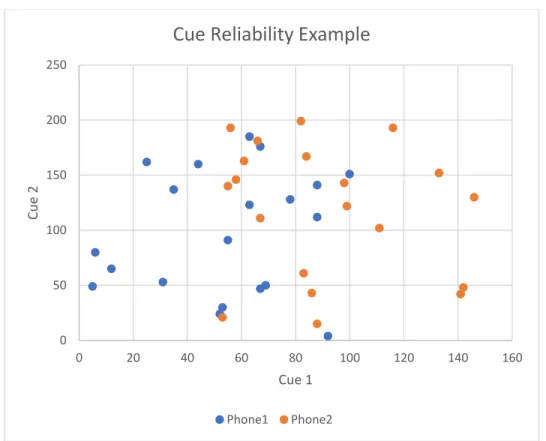
Figure 3: Cue Reliability
Given two sounds: Phone1 and Phone2, which can each be measured in two ways, Cue1 or Cue2, one can categorize these two sounds in two basic ways: by their Cue1 values or their Cue2 values. On the scatterplot above, this would be drawing a line at some value along one axis and assuming that any data point which falls on one side of the line should be identified as Phone1 and data points on the other side of the line as Phone2. On the Cue 1 axis, a border at
approximately 75 would rather accurately split Phone1 (indicated by blue dots) and Phone2 (indicated by orange dots). On the Cue 2 axis, on the other hand, there is no point along the axis that would allow accurate identification of the data on one side of the line as Phone1 and data on the other side as Phone2. Therefore, Cue 1 would be a more reliable cue to use in discriminating
0 50 100 150 200 250
0 20 40 60 80 100 120 140 160
Cue 2
Cue 1
Cue Reliability Example
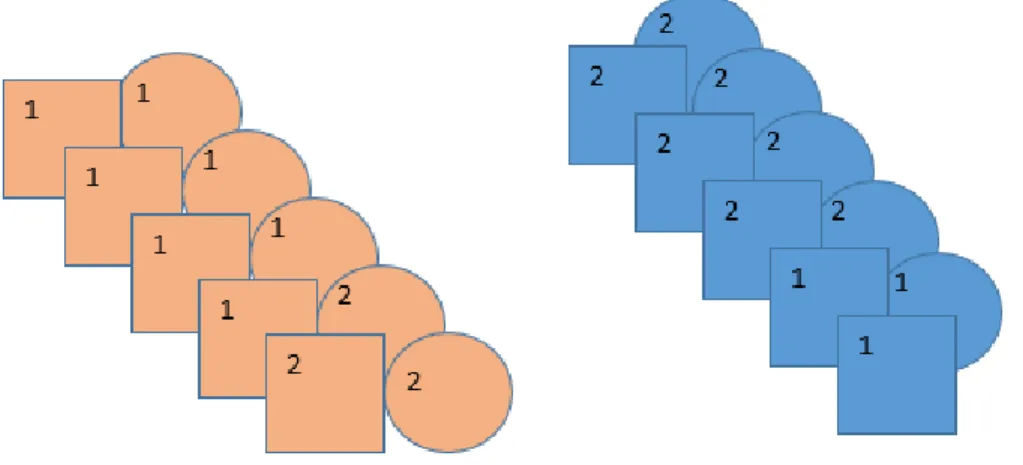
For example, in the following group of items, each which is either a member of set 1 or set 2 (can be thought of as Phone1 and Phone2), as indicated by the number on the top left corner of the item, there are two “cues” that each of these items has: its color and its shape. Not knowing what the number of each item is but knowing there must be two categories, we can organize these shapes into two groups in one of two ways.
Figure 4: Reliability Sample
One, we can organize the items by shape. This gives us the following distribution, where each group has six items of one set and four of the other.
Or, we can organize them by color, which gives us this distribution, where seven items in each group are from the same set.
Figure 6: Color Assortment
This is a slightly more effective way to split the sets, as it allows us to more accurately group the items into set 1 and set 2. Thus, in terms of cues, color is a better predictor, and thus a more reliable cue, than shape is for identifying members of sets 1 and 2.
2.2.
Cue Reliability and Sound Change
Cue reliability has thus far been discussed as a factor in the weighting of cues by native speakers vs. non-native speakers learning the language, with implications for differences between L1 and L2 perception and phoneme development. Here we will explore the role of cue-reliability and the ensuing weighting of cues as a harbinger of sound change.
Kang (2014) did a corpus study of the VOT and F0 contrasts between “lenis,” “fortis” and “aspirated” stops in the Seoul dialect of Korean. Korean traditionally has a three-way contrast between voiceless stops: “fortis” [p’], “lenis” [p] and “aspirated” [ph]. Prior to Kang’s study, there had been considerable research done on the acoustic differences between the categories in this rare, three-way contrast by Han and Weitzman (1970), Cho, Jun and Ladefoged (2002), and others.
Previous studies found that the average VOTs differed between stop types in Korean. According to Cho, Jun, & Ladefoged, the length of VOT is longest for aspirated stops, somewhat shorter in lenis stops, and shortest in fortis stops. However, they also note that lenis stops, which have the highest chance of overlap with both of the other categories in its VOT, as it traditionally has a
VOT duration somewhere in between short-lag (fortis) and long-lag (aspirated) stops, were
produced with a lower F0 on the following vowel than the relatively high F0 of both fortis and
aspirated stops, which have the lowest chance of confusability with each other in terms of VOT,
as they are at opposite ends of the spectrum.
Kang used this information to do a large-scale apparent time study on the acoustic differences
between these stops in the Seoul dialect, comparing the average productions between participants
converging in the lenis and aspirated stops, while the distinction that has been found in the F0 of the following vowel has become exaggerated in the speech of younger speakers, especially women. Kang concluded from this study that, as VOT duration is becoming less distinct – less reliable in distinguishing between the stop categories – the F0 is becoming more reliably
produced. Thus, the F0 is becoming more relevant in this distinction, and is expected to become the primary – and eventually perhaps only – cue used in this dialect to distinguish between the lenis and aspirated stops.
This is evidence that sound changes such as that taking place in Seoul Korean, where one cue becomes irrelevant as the other gains relevance, is motivated by, or at least correlates strongly with, the reliability of the production of different cues in the phonemes. Thus, the reliability of nasalization and aspiration was measured in Somali Chizigula voiceless prenasalized stops in comparison to voiceless plain stops, following the prediction that aspiration – the cue which we predict to be preserved – will be more reliably produced than nasalization.
2.3.
Cue Reliability in Somali Chizigula
voiceless nasalization without aspiration, which leads to the question of why aspiration is so overwhelmingly preferred to nasalization.
The following hypothesis concerning cue reliability in Bantu languages hinges on these claims: 1. Bantu languages have undergone a period of devoicing of the nasalization in prenasalized stops; 2. this devoicing led to the nasalization being misheard – or not heard; and 3.similarly to Seoul Korean, the secondary cue in Bantu (devoiced) voiceless prenasalized stops – aspiration – became a more salient, and more reliably produced cue than nasalization. This section will explore the role of cue weighting in Bantu nasal effacement by measuring and calculating cue reliability and weight in these cues in Somali Chizigula.
Hypothesis
In Somali Chizigula, if the period before the burst (prenasalization vs. plain closure) in voiceless prenasalized and plain stops is measured and compared to the length of aspiration between voiceless prenasalized and voiceless plain stops, aspiration will be found to be the more reliably produced cue.
Then, applying Toscano and McMurray’s cue weighting calculations, aspiration should be calculated as the more heavily weighted cue.
Recordings
with a voiceless plain stop, each in varying places of articulation (bilabial, alveolar and velar). Recordings were made in a sound attenuated booth in the Mary Ellen Ryder Linguistics Laboratory at Boise State University using a head-mounted Shure SM-10 microphone and a Zoom H4n recorder. Acoustic data from one male and one female participant recorded in the aerodynamic study (Temkin Martinez and Boone, 2016) was then used in the acoustic analysis done by Wang and Boone (2017). The measurements mentioned in the following sections on nasalization come from the Wang and Boone study. The VOT measurements were made afterward using the same recordings.
Aspiration (VOT)
VOT, or Voice Onset Time, refers to the duration of aperiodic noise (aspiration) between the release of the stop and the following vowel. VOT here was measured in Praat (Boersma and Weenink, 2014) from the end of the apparent burst to the first full cycle of the vowel. The VOTs of each stop type – voiceless prenasalized and voiceless plain – were measured for the recordings taken from the Temkin Martinez and Boone study, and the averages and standard deviations for each was found, shown in the table below. Time here is measured in milliseconds.
Table 3: VOT measurements
VOT (aspiration) Plain Stops Prenasalized Stops
Mean (ms) 26 72
Standard Deviation 12.6 19.6
N 33 36
Spectral Tilt
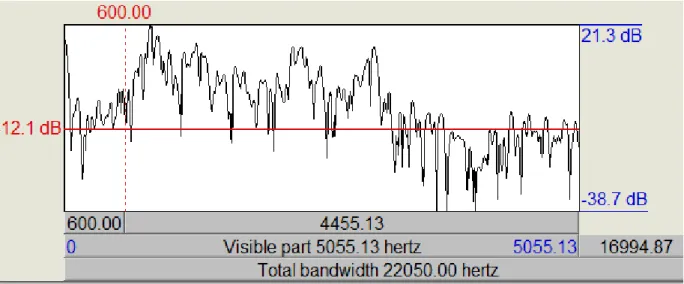
The spectral tilt is found by looking at a spectral slice and comparing the amplitude at low frequencies, where human speech would occur, to the amplitude at high frequencies, where little to no human speech sounds should be picked up. The greater the difference between the high and low frequencies, the louder the speech sound is. Thus, Figure 7: /mphalala/ spectral tilt below, showing a spectral tilt extracted from the nasal portion of the initial prenasalized stop in the word /m̥phalala/, shows a higher amplitude sound than Figure 8: /palapaʧa/ spectral tilt, which shows a spectral tilt extracted from a period during the closure of a word-initial plain stop in the word /palapaʧa/. The horizontal line is set to the same dB level in both images for comparison.
Figure 8: /palapaʧa/ spectral tilt
The difference between the average amplitude between 100 to 600 hz (beginning at the peak just to the right of the leftmost peak and ending at the dotted vertical line) and 4000 to 5000 hz (the rightmost area, about twice the length of the area indicated on the left) was calculated using a function in Praat. Note that, because the lower frequency average was subtracted from the higher frequency average (silence), the tilt averages are negative numbers. Thus, a lower number shows a larger difference, and consequently a louder sound.
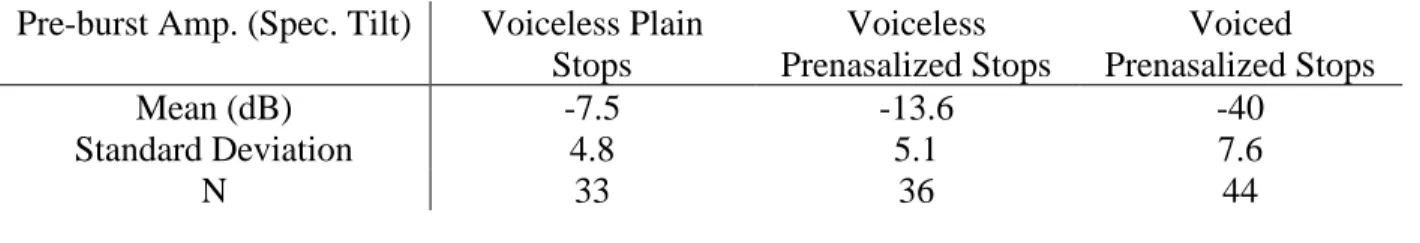
Spectral tilt averages are shown in the table below. Measurements for voiced prenasalized stops are shown for comparison.
Table 4: Spectral Tilt Measurements
Pre-burst Amp. (Spec. Tilt) Voiceless Plain Stops
Voiceless Prenasalized Stops
Voiced Prenasalized Stops
Mean (dB) -7.5 -13.6 -40
Standard Deviation 4.8 5.1 7.6
N 33 36 44
Relative Intensity
plain stop – compared to another value – here the highest amplitude of the word. This allows the researcher to compare how loud one sound would generally be in relation to another. Wang and Boone (2017) used this method to compare voiced and voiceless nasalization to “silence” in Somali Chizigula. To get these numbers, the difference between the maximum intensity of the whole word (calculated by Praat) and the maximum intensity of the nasal portion or 100 ms. before the release of a plain stop was found, which showed how much quieter each sound was than the stressed vowel. When the numbers for each stop type were compared to each other, it was found that voiceless nasalization was significantly quieter than voiced nasalization, but somewhat louder than silence.
Figure 9: /m̥phera/ intensity Figure 10: /pera/ intensity
This gave us the results in the following table. Voiced prenasalized stop measurements are included for comparison.
Table 5: Relative Intensity Measurements
Pre-burst Amp. (Rel. Int) Voiceless Plain Stops
Voiceless Prenasalized Stops
Voiced Prenasalized Stops
Mean (dB) 33.3 29.9 9.0
Standard Deviation 5.8 5.9 4.5
Spectral Tilt and Relative Intensity are two different methods used here to measure essentially the same thing – the amplitude of voiceless nasalization (prenasalized stops) compared to silence (plain stops). The spectral tilt values clearly show a more significant difference between the stop types than the relative intensity measurements, but we will consider the results of both methods below.
Figure 11: Reliability of VOT v and Figure 12: Reliability of VOT vs. Pre-burst Amplitude: Relative Intensity (below) show scatterplots of the measurements for stop closure amplitude (intensity) and aspiration length (VOT) compared between plain and prenasalized stops in the language based on spectral tilt or relative intensity data respectively.
Figure 11: Reliability of VOT vs. Pre-burst Amplitude: Spectral Tilt
-20 0 20 40 60 80 100 120 140
-30 -25 -20 -15 -10 -5 0 5 10
VOT
(As
p
)
Spectral Tilt ("Nas" amp)
Reliability of cues
From the figure above, we can see that both the spectral tilt of nasalization vs. non-nasalization – aka silence, as occurs before the burst in plain stops – (shown on the horizontal axis) and the VOT of prenasalized vs. plain stops (shown on the vertical axis) show clear clusters for each category of stop (prenasalized stops indicated by blue dots, plain stops by orange). However, there is much more overlap between the two stop types in terms of their spectral tilt than their VOT.
Comparing aspiration to the amplitude of nasalization based on the relative intensity shows less categorization, as shown below, where there is near total overlap between the plain and
prenasalized stops in terms of the relative intensity of the pre-burst portion.
Figure 12: Reliability of VOT vs. Pre-burst Amplitude: Relative Intensity
0
20 40 60 80 100 120 140
5 10 15 20 25 30 35 40 45
VOT
Relative Intensity
Reliability of Cues (Relative Intensity)
Using either method for measuring nasal amplitude, it is apparent in the above figures that aspiration is a more reliable way to categorize stops in Somali Chizigula than listening for the nasal, which may or may not override background noise (aka “silence”). If the Seoul Korean study done by Kang is any indication, then this should lead to aspiration becoming a more relevant cue than nasalization, which matches the prediction made based on historical evidence that the nasalization will eventually be lost, providing evidence that this was likely what took place in other Bantu languages.
Cue Weighting
Following the hypothesis laid out by Toscano and McMurray that cue-reliability leads to relative weighting of cues, essentially assigning a value to “relevance” as it is discussed by Kang, the values collected above were used to calculate the weight of aspiration as a cue relative to nasal amplitude. The cue-weighting model laid out in Toscano and McMurray (2010),
w = (µ1 - µ2)2 / ϭ1ϭ2
where w is the weight, µ refers to the mean of the category and ϭ is the standard deviation, was used to assign weights to the two cues – VOT and pre-burst amplitude (based on the more reliable measurements of the spectral tilt). The weight of aspiration as a cue was calculated to be 8.533356, while the weight of amplitude according to the spectral tilt was 1.537152. The weight of the amplitude of nasalization according to the relative intensity measurements was still less, at .337814.
Table 6: Aspiration Weight
VOT (aspiration) Prenasalized Stops Plain Stops
Mean (ms) 72 26
Table 7: Nasal Amplitude Weight (Spectral Tilt)
Pre-burst Amp. (Spec. Tilt) Prenasalized Stops Plain Stops
Mean (dB) -13.6 -7.5
Standard Deviation 5.1 4.8
Cue Weight 1.537152
Table 8: Nasal Amplitude Weight (Relative Intensity)
Pre-burst Amp. (Rel. Int) Prenasalized Stops Plain Stops
Mean (dB) 29.9 33.3
Standard Deviation 5.9 5.8
Cue Weight .337814
Following the hypothesis that cue reliability leads to a cue being weighted more heavily than less reliable cues, we should see that Somali Chizigula speakers base their identification of plain vs. prenasalized stops on aspiration without regards (or with less emphasis on) nasalization, as it does not necessarily provide consistent classification of prenasalized stops to the extent that aspiration does.
Chapter 3: Perception Experiment
3.
Perception Experiment
3.1.
Hypothesis and Predictions
Historical evidence of nasal effacement in voiceless prenasalized stops in Bantu languages, as well as the acoustic and aerodynamic data just presented, where nasalization is difficult to see and aspiration is relatively evident, led to the following hypothesis.
3.1.1. Hypothesis
The nasal portion of voiceless prenasalized stops is a less salient cue for identification of the segment than aspiration. Thus, speakers will identify aspirated segments with no nasal portion as prenasalized more often than prenasalized stops where the aspiration has been removed.
I tested this hypothesis by way of a study comparing adult native speakers’ perception of the aspiration relative to the nasalization.
3.1.2. Predictions
There are a number of possible outcomes of this study.
1. If aspiration does prove to be a better cue than nasalization, native speakers of Somali Chizigula, when presented with prenasalized stops with only either the aspiration or the
2. If the opposite is true and nasalization is the more apparent cue, then the nasalized, unaspirated stimuli should be chosen as prenasalized more often.
3. It is possible that both cues are necessary, or that either cue serves to indicate pre-nasalization just as well as the other, in which case both types of modified stops should be identified as prenasalized at approximately equal rates, either almost never, if listeners must have both cues, or almost always, if listeners only need one or the other.
4. Finally, participants may simply get confused by the modified stimuli and choose randomly, in which case we will see no particular trend one way or the other.
As will be shown, results of this study show a significant difference between controls and the nasalized-only experimental set, but no significant difference between aspirated-only and the prenasalized controls, and none between aspirated-only and nasalized-only. This seems to support either the first possibility, of aspiration being a more useful cue, or of both cues giving approximately equal chances of identifying the sound (3). A few participants exhibited signs of being in group 4, so their results were removed from the study.
We cannot say definitively, based on these results, that perceptual difficulty is the cause of nasal effacement, which calls for further exploration of possible motivations for sound change, as, one way or the other, something must be motivating the systematic removal of nasalization from this sound.
3.2.
Perception Experiment Methods
As shown above, prenasalized stops in Somali Chizigula differ from plain stops in that they contain both a nasal portion and significant aspiration. This is represented as [ m̥ph ], in contrast with the plain stop [ p ]. The purpose of this study was to measure which of these cues
(nasalization or aspiration) leads to better identification of prenasalized stops by native Somali-Chizigula speakers.
3.2.1. Participants
Ten native Chizigula-speaking participants took part in this study. Half of the participants were male and half female, all recruited from the Chizigula community in Boise, Idaho. Requirements for participants were that they must speak Somali Chizigula as a first language and have no history of hearing problems. All participants were paid $10 for their participation in the study, which lasted approximately half an hour per person.
Data from three of the participants was removed from the analysis because they did not meet the proposed number of correct responses for same-spliced tokens (outlined in the Procedure
section).
3.2.2. Study Synopsis
We will hereafter refer to these experimental stimulus types as nasalized-only (or NAS), and aspirated-only (ASP).
Same-spliced tokens – that is, two separate recordings of the same word which have been cut and pasted together without modification of either the aspirated portion or the nasal portion – were also included to be sure that each participant correctly perceives both types of stops in the language ([ m̥ph ], [ p ], also abbreviated as PREN and PL, respectively).
3.2.3. Materials
Words and Pictures
12 pairs of minimal or near-minimal pairs (total 24 words, in three places of articulation)
beginning with the target sounds were chosen to be used in the study. 10 filler pairs (20 words, in three places of articulation) were also included, all beginning with implosive stops and plain stops. All words were nouns, representable with a picture, and were chosen based on the
availability of prenasalized and plain pairs (or plain and implosive pairs for the fillers), with the criteria that each word must be non-violent and deemed likely to be socially acceptable in both American and Somali cultures. Words were selected from the Somali-Chizigula dictionary compiled by Jon Dayley, Mwaliko Mberwa and Michal Temkin Martinez (2016). Target pairs are written below, using the conventions found in the dictionary.
Table 9: Experimental Word pairs
Prenasalized Word Plain word mphera “rhinoceros” pera “pear”
mphalala “corn tassels” palapacha “perch (fish)” mphapa “sharks” papayu “papaya”
nkhonde “farms” konde “slap on the back” nkhunde “beans” kundi “bunch/group” ntrambo “journey” tambi “branch” ntrende “date (fruit)” tende “tent”
ntrongo “sleepy” tongo “sleep (in the eye)”
Each word was recorded three times spoken by the same native Somali Chizigula speaker in isolation using a head-mounted Shure SM-10 microphone and a Zoom H4n recorder with a sampling rate of 44100 Hz. Recordings were made in the Mary Ellen Ryder Linguistics Lab at Boise State University. The speaker was shown a color picture representing the intended word and an approximate phonetic transcription (based on conventions familiar to the speaker) in point 44 Calibri Light font presented via Powerpoint on an Acer laptop computer with an 8x14 inch screen, and was asked to produce the word in isolation three times consecutively, pausing between each utterance. They then moved on to the next word in the list and did the same for each word.
Pictures representing each word were taken from the internet, based on the English translation for each Somali Chizigula word available in Dayley’s dictionary. A variety of pictures for each word was chosen by the experimenter and then presented to 2 native Somali Chizigula speakers to determine which best represented the intended word.
Pictures were cut into rectangles of the same approximate size, between 2 and 3 inches in length on each side, depending on how much was necessary to keep the full item in the picture,
preserving the original background of the photo (items were not cut-out from the background of the picture).
Splicing of Audio
The six recordings in each critical word pair (three recordings for each word) were compared for vowel length, and the average calculated. The VOT was compared between the three recordings for each word and the average calculated.
VOTs were measured in Praat using the waveform, measuring from the zero crossing before the first peak in the stop burst to the zero crossing at the beginning of the first clearly visible periodic cycle of the vowel.
Vowels were measured from the zero crossing at the beginning of the first visible periodic cycle to the zero crossing at the end of the last cycle before the consonant in the second syllable began. Because of the varying natures of the following consonant, the exact method differed between stimuli: if a nasal followed, then vowels were measured up to the first antiformant, if a stop followed, the vowel was measured up to the closure, etc.
The two recordings of each word which best fit the average VOT (for that word) and vowel length (for the pair) were used in the same-spliced stimuli, and the most average recording – that is, the recording of each word in the word pair which was closest to the average values for VOT and vowel length, giving length of the vowel precedence, if there was conflict – of each were used in the cross-spliced stimuli. In prenasalized words where the exact boundary between the nasal and the stop burst was unclear, the nasal portion was cut from a recording with a clearer burst.
For the cross-spliced stimuli, the nasal or aspirated portions were swapped with a comparable portion of the other word in the pair (/mphera/ and /pera/ spliced together) Same-spliced stimuli left the category of stops unchanged by replacing a section of a recording with the same part of a different iteration of the same word (i.e.the nasalization in one iteration of /mphera/ was spliced together with the burst of a different recording of /mphera/). Everything beyond the end of the first vowel in the word was cut from the recording for the experimental portion of the study, leaving a single, word-initial syllable.
The boundaries for cutting nasals from prenasalized stops were based on a previous analysis of the aerodynamics of these sounds in Chizigula (Temkin Martinez and Boone, 2016). Each nasal tends to last 100 ms. or less, with an average of approximately 80 ms. For the nasal or non-nasal portion of the word, 100 ms. before the release of the stop was cut (either 100 ms. of silence or containing the nasal) and spliced into the stimuli recording.
The boundary for stops was the beginning of the burst, and everything following the stop in the first syllable (any aspiration as well as the first vowel) was kept. The vowel used in each
stimulus, then, comes from the same recording as the burst and, necessarily, the aspiration. This brings up the possible problem of additional cues for pre-nasalization being expressed on the vowel, in the form of length, nasalization, or some other cue.
The F1, F2 and F3 values (reported in Hz) of each vowel was calculated using the Praat formant tracker, with measurements taken from the approximate middle of the vowel, where it appeared stable, and compared to the vowel formants of the other member of the minimal pair, and finally, the F0 of the vowels was also analyzed by measuring the duration of the second full vowel cycle of each recording from zero crossing to zero crossing (reported in Hz). Neither of these
measurements showed any consistent differences between the vowels following the different stop types, as shown in the table below, leading to the conclusion, at least for the time being, that we can tentatively assume that speakers are not hearing cues for pre-nasalization in the vowel.
Figure 13: F0, F1, F2 and F3 Averages
Word Ave F1 Ave F2 Ave F3 Ave F0
mphera 439.3365 1319.274 2319.942 149.8736 pera 453.0197 1405.422 2465.653 126.7230 mphalala 575.7954 981.6381 2196.152 116.4394 pala 623.9858 1029.003 2186.287 122.3587 ntrambo 816.5040 1381.596 2448.079 132.1993 tambi 735.9879 1405.830 2354.602 129.7982 ntrongo 712.7290 1022.546 2352.091 119.2413 tongo 694.0970 1259.667 2332.776 128.3864 nkhala 758.4158 1329.962 2115.540 120.5056 kala 803.7215 1369.576 2129.949 117.4988 nkhola 610.6977 1000.375 2324.492 123.3773 kola 559.8803 959.6550 2471.865 125.9009
With this in mind, vowels were cut to the average length of both members of the pair (the
0.015) then self else self * (xmax-x)/0.015 endif”, tapering the last 15 milliseconds of each recording.
Below are Praat images for each type of stimulus. The top pair are same-spliced prenasalized and plain stimuli, respectively. The first image shows both the nasalization and aspiration involved in a prenasalized stop. The second shows a plain stop.
Figure 14: same-spliced /mphera/ Figure 15: same-spliced /pera/
The second pair of images show cross-spliced stimuli. The leftmost picture shows nasalization but relatively little aspiration. The right picture has significant aspiration but no nasalization.
3.2.4. Procedure
Participants were seated in a sound attenuated booth in front of an Acer laptop computer with a 14x8 inch screen, and were outfitted with sound attenuating headphones and an Olympus LS-10 (Linear PCM) recorder sitting beside the laptop approximately 20 inches from the participant. Both the researcher and an interpreter were present for the duration of the study, and participants were encouraged to ask if they had questions, and to adjust the volume in the headphones to a comfortable level.
The study consisted of three phases: training, practice and an experimental portion.
Phase 1: Training Period
At the beginning of the study participants went through a short training period, where they were shown a color picture via Powerpoint and heard, through headphones, an unmodified audio file containing the intended word as spoken by a native Somali Chizigula speaker. Participants were instructed that they could replay the word as many times as necessary, and to mention if a word was unfamiliar to them (this led to the removal of one pair of words – /mphalamunju/ “dragonfly” and /palapaʧa/ “perch (fish)”, where the picture did not match the word).
Participants were then asked to repeat the word that they heard, and their production was recorded using an Olympus LS-10 recorder. This was to ensure that participants knew the word that was intended to be associated with the picture, and that the prenasalized stop is a sound which is produced by the speaker.
Phase 2: Practice
“d”, were chosen based on their placement on the keyboard, so that the corresponding picture would appear above the key. The keys were marked with a bright pink tag on which the symbols and had been drawn, meant to indicate which side of the screen the corresponding picture
appeared on.
They were shown a pair of pictures not used in the experimental portion of the study, but which they had been trained on during the training period, and heard the first syllable of a word which corresponded to one of the pictures. They were asked to press the key the corresponded to the picture that the audio file matched. They went through a series of 12 of these decision tasks, then the section ended and participants were instructed that they would be starting the experimental portion. There was no time limit for participants to decide in either the training or the
experimental portion of the study.
Phase 3: Experimental Portion
For the experimental portion of the study participants heard the spliced or unchanged sound ([ m̥
ph ], [ p ], [ m̥p ] or [ ph ]) with a following vowel and saw a pair of pictures presented side-by-side, each representing a word which they had been trained on, one which began with a plain stop and the other which began with a prenasalized stop. The picture representing the
Ten pairs of words not containing a prenasalized counterpart were recorded and included as filler tokens. Each filler pair was cycled through four times, twice same-spliced and twice cross-spliced. Thus, each participant made 88 decisions for Phase 3 of the study, 48 of them pertinent to the study.
Pictures and audio for the experiment were presented with Actuate software, courtesy of the University of Alberta, which also collected responses and response times for each participant. Pairs were randomly ordered for each participant. The syllable was played twice with a short period (800 ms) of silence between iterations for each decision. A period of 500 milliseconds lapsed between the participant’s selection and the presentation of the next pair of pictures, and each audio file played for 100 milliseconds before the burst of the stop (this period contained the nasal portion for the tokens with nasalization).
This study had been run as a pilot study with 2 native Somali Chizigula consultants. Comments from the consultants after the study prompted the normalization of amplitude, repetition of the audio and tapering of vowels.
3.3.
Analysis and Results
3.3.1. Analysis
Aspiration), Nasalized only (+Nasalization, -Aspiration) and Aspirated only (-Nasalization, +Aspiration):
logit [p (response = Pren)] = α(Prenasalized) + β,(Plain) + β,(Aspirated) + β,(Nasalized)
Standard errors were adjusted for multiple observations within subjects. Between-subject factors appeared to have no effect. Item effects were not able to be calculated because some items were identified as the same sound by all speakers (giving a 100% response rate).
In the experimental portion of the study, if a participant mislabeled 30% or more of the same-spliced tokens, their data was removed from the analysis. This was the case with three
participants, who all produced the prenasalized stop in the training session but appeared to have difficulty hearing it.
Figure 18: Results of Perception Study
Figure 18: Results of Perception Study, above, shows the percentages of “Prenasalized” answers for each stimuli category, where PL means that the audio presented was a plain stop, PREN were prenasalized stops, and NAS and ASP indicate the experimental cross-spliced stimuli including only the nasal portion or aspirated portion of the prenasalized stop, respectively. All participants and all items are included in the percentage, with the exception of those earlier mentioned as having been removed. Thus, participants in the study identified audio containing a plain stop as being a prenasalized stop 28% of the time, and so on.
28%
76%
84%
91%
P L N A S A S P P R E N
%
A
N
SW
ER
ED PR
EN
A
SA
LIZE
D
Table 10: Statistical Test Results
While Figure 18: Results of Perception Study shows a slight tendency for participants to rely on aspiration as a cue for identification of the prenasalized stops rather than the nasalization, the test results above show no significant difference between the experimental groups ASP and NAS (χ2 = 1.82, p = .1770). There is a significant difference between NAS and PREN (χ2 = 15.42, p = <.0001), however, whereas the difference between ASP and PREN is insignificant (χ2 =1.47, p = .2247), which complicates matters. PL is significantly different from all other categories. This says, essentially, that NAS and ASP have a high probability of being the same category, and ASP and PREN as well, but that NAS and PREN are not the same.
To clarify, in the terms used up to this point, when the nasalization is removed from prenasalized stops, leaving the aspiration (ASP), native speakers do not identify them as prenasalized
significantly less than if they have both cues to consider, but when the aspiration is removed, leaving only nasalization (NAS), they are significantly less likely to identify them as
confusion than removing nasalization, but that speakers will accept the presence of either cue as an indication of the prenasalized category (without taking into account the lack of the other cue).
3.3.2. Stimuli effects
As stated, the between-stimuli effects could not be calculated statistically. Raw results show that a few of the stimuli were identified as prenasalized noticeably more or less than others in its category. For instance, several of the aspirated-only stimuli were identified as prenasalized 100% of the time. One cross-spliced, aspirated-only stimulus resulted in a meager 43% “prenasalized” identification. Its same-spliced, prenasalized counterpart elicited a 57% (correct) “prenasalized” response rate – the lowest rate for the prenasalized audio files (compared to the next lowest at 86%).
Due to this discrepancy, after the study was complete, the individual stimuli were again measured for VOT to evaluate whether the length of VOT correlated with the percentage of “prenasalized” responses. As mentioned in the methods section, the VOT for each stop was untouched when the splicing of the audio files was done, and at times the length of VOT for plain and prenasalized stops showed some overlap. It was found that, in the aspirated stimuli which were most often labeled “plain”, the aspiration always fell around the boundary between prenasalized and plain voiceless stops (50 ms.). The recording used in both the cross-spliced aspirated-only stimulus (ASP) and same-spliced prenasalized stimulus (PREN) which elicited the lowest rate of “prenasalized” responses had a VOT of 50 ms.
descending order of response rates, with the stimulus with the highest response rate on the left, and the lowest on the right.
Figure 19: VOTs and Resp. per Item
The cross-spliced nasalized-only stimuli set (on the left in the figure above) had only one stimulus which fell around this point, “12nk” (all other stimuli had VOTs under 40 ms.). This stimulus had a VOT of 62 ms., and was identified by speakers as prenasalized 66% of the time, less than the average for nasalized stimuli, even though it had the longest VOT of the group. The corresponding stimulus in the same-spliced plain category (where the aspiration from both came from the same recording), was incorrectly identified as a prenasalized stop 71% of the time, compared to the next highest of its kind at 43%. Thus, the length of the VOT appears to have somewhat affected response rates for these stimuli.
identification as being “prenasalized” seems to be around 60 ms., although the exact cut-off is uncertain, and may differ according to place of articulation.
In the aspirated stimuli section in the figure above (the right set), the highest “prenasalized” response rates correspond with velar and alveolar stops, with the three lowest response rates falling on bilabial stops. Bilabials tend (cross-linguistically as well as in this stimulus set) to have the shortest VOTs and velars tend to have the longest, so it is difficult to say whether this is an effect of VOT length or some other cue related to place of articulation.
Recall that alveolars are produced with a short, voiceless trill or tap following the burst. This should provide additional, very salient cues for the prenasalized alveolar stops, and, indeed, stimuli which contained the trill elicited a 100% response rate. Interestingly, however, as is apparent in the following table, when the trill was removed and replaced with the plain stop burst and aspiration, in one of the three stimuli the same “prenasalized” response rate of 100% was observed, the highest response rate for a nasalized-only stimulus, showing that the lack of the trill does not prevent listeners from labeling it a prenasalized stop.
Table 11 shows the responses broken down by participant and by token. The leftmost column lists a short code for each cross-spliced token, noting whether the stimuli contained the nasalization (in the upper section, noted by the stop preceded by a homorganic nasal), or aspiration (in the lower section, labeled with “h” following each stop).
Total percentages of “prenasalized” responses for each participant are noted in the corresponding column, and the percentage of “prenasalized” responses for each token in the %Pren column.
Table 11: Participant Responses
1F 2F 3M 4M 5M 6M 7F %Pren VOT
NAS 90% 91% 82% 91% 64% 64% 55%
1mp 86% 30 ms
6mp 57% 27 ms
8mp 86% 14 ms
10mp 71% 31 ms
12nk 67% 62 ms
14nk 71% 14 ms
16nk 86% 18 ms
18nk 86% 37 ms
22nt 100% 30 ms
24nt 57% 36 ms
26nt 71% 16 ms
ASP 80% 73% 91% 91% 82% 91% 82%
2ph 57% 54 ms
5ph 43% 49 ms
7ph 71% 47 ms
9ph 86% 64 ms
11kh 86% 81 ms
13kh 100% 93 ms
15kh 100% 75 ms
17kh 86% 65 ms
21tr 100% 63 ms
23tr 100% 63 ms
25tr 100% 72 ms
Total 85% 82% 86% 91% 73% 77% 68%
Chapter 4: Conclusions
4.
Discussion
4.1.
Perception and Cue weighting Discussion
When the reliability of the production of nasalization versus aspiration in Somali Chizigula stops is calculated, we see that aspiration is a significantly more consistent cue than nasalization in identifying voiceless prenasalized versus plain stops, due to the amplitude of nasalization often failing to rise above background noise. Thus, in the natural world, nasalization may often be lost on hearers, resulting in the eventual loss of this sound, leaving the more consistently produced aspiration as the main cue.
Perception data from this study shows that, in the current state of word-initial, Somali Chizigula voiceless prenasalized stops, having only either aspiration (of more than 50 ms., importantly) or nasalization results in a rather high probability of identification of the sound as a prenasalized stop – at least with good quality recordings presented through headphones in a sound-attenuated room – but that removing aspiration leads to significantly less “prenasalized” responses than having both cues, whereas removing nasalization does not. When nasalization is heard by native speakers of Somali Chizigula (76% of the time), they interpret the sound as being prenasalized regardless of how short the VOT is.
stops, as well. Thus, cue weighting, in this case, has not taken place. It appears that listeners will take either aspiration or nasalization as a cue in identifying prenasalized stops, and that, while one cue is easier to hear, they listen just as hard for the other cue.
Considering the difficulty of the production of a nasal followed by a voiceless consonant in terms of the inability to precisely time articulator movement, as described by Pater (1999), along with the superfluity of having both the nasalization and the aspiration, then simplifying the consonant seems like a phonetically efficient solution. Considering that aspiration is consistently produced and easier to hear than voiceless nasalization, aspiration can be concluded to be the more logical of the two cues to be preserved, although as yet speakers show no partiality toward aspiration over nasalization.
4.2.
Implications for Sound Change
The present study looked only at word-initial, voiceless prenasalized stops, which, based on Somali Chizigula and Pokomo, was likely the state of prenasalized stops immediately prior to full nasal effacement in other Bantu languages, leading to an aspiration contrast between what are now word-initial prenasalized and plain voiceless stops in Somali Chizigula. This study has nothing to say, then, about either voiced prenasalized stops or word-medial voiceless
prenasalized stops.
prenasalized stops and word-medial voiceless prenasalized stops are not as likely to undergo effacement, or at least not as rapidly. This trend is attested in other Bantu languages, such as some dialects of Swahili, where initial voiceless aspirated consonants appear, but word-medially, the nasal in prenasalized stops have been preserved, often through making the nasal syllabic, in spite of its having undergone total nasal effacement word-initially, (Contini-Morava, 1997).
The current state of word-initial voiceless prenasalized stops in Somali-Chizigula is here proposed to be in the semi-final stages of the nasal effacement process, one step further than Pokomo, which has undergone significant devoicing but retains partial voicing, and one step behind Swahili’s full nasal effacement.
Following is the observed sound change trend in Bantu languages:
*NC̥NC̥(NN̥C̥ NN̥C̥h) or (NC̥h NN̥C̥h)N̥C̥hC̥h
The motivator of this sound change is claimed in this paper to be phonetic: ease of articulation motivates the devoicing of the nasal portion of prenasalized stops, and the relatively low amplitude of the ensuing voiceless nasalization, which does not always rise above background noise, particularly in real-world situations, as opposed to ideal lab conditions, leads to speakers mishearing the sound as simply aspirated, which eventually leads them to produce the sound without nasalization.
4.3.
Further Study
prenasalized by varying the VOT duration. A study which controls for aspiration length could then be done to see if this results in more consistent identification. Varying the nasal would be perhaps more difficult, but may lead to clearer information on how loud a nasal has to be in order to be heard. A study done including more participants might provide more conclusive results, or may show a tendency for different speakers to weight cues differently.