S
TREAMLININGA
CCESS TOI
NFORMATIVEP
ERFORMANCEM
ETRICS FORC
OMPLEXF
ENESTRATIONS
YSTEMS S. Dave1; M. Andersen2;1: Building Technology Program, Massachusetts Institute of Technology, Cambridge, USA. 2: Interdisciplinary Laboratory of Performance-Integrated Design (LIPID), ENAC, Ecole Polytechnique Fédérale de Lausanne (EPFL), Lausanne , Switzerland.
ABSTRACT
A mechanism to accurately assess the performance of complex fenestration systems (CFS) is crucial for driving the appropriate adoption of these technologies to improve user comfort and energy use in both new construction and retrofit design. Typically, CFS are not provided sufficient consideration because user intuition is lacking: existing metrics, while valid for conventional systems, fail to reveal the dynamic nature of the performance of CFS. Conducting and reporting elaborate simulation results is neither feasible nor useful for manufacturers and users and thus a comprehensive rating system based on novel performance metrics has been identified as a means to describe CFS. This paper describes the methodology used to determine the simplified calculation procedure for three metrics defined in a previous paper, and the rational for the ultimate decision. The three metrics, the Relative Energy Impact (REI), the Extent of Comfortable Daylight (ECD), and the View-Through Potential (VTP) aim to provide context in three important areas of daylighting technology performance, namely energy efficiency, occupant visual comfort, and view through the facade respectively, such that the user can select systems to address his or her own priorities. Conducting and reporting full resolution calculations for all input conditions would be unfeasible and unwieldy because of the quantity of data that would have to be managed and the effort that would be spent on such en enterprise for every system. A method to eliminate redundancies and minimize the number of input parameters and calculations thus becomes necessary. This paper proposes an approach based on trends, sensitivity analysis, and error minimization techniques and presents the iterative simplifications required to produce the same relative ranking performance of the sample systems as a benchmark analysis would. INTRODUCTION
Complex Fenestration Systems (CFS) are defined as daylighting facade systems that manipulate light in a variety of innovative ways in order to achieve improved performance objectives. When used appropriately, these advanced daylighting systems have the potential to reduce a building’s energy use by up to 41% [1]. Buildings in the United States account for about 40% of the nation’s energy use, 33% of which is attributed to heating and cooling and an additional 18% of which is associated with lighting energy use [2]. A building’s facade system affects both these categories of total energy use as well as the visual comfort of occupants within the space. Broadly and qualitatively, occupants prefer well daylit spaces to spaces that are lit only with artificial light [3]. However, direct sunlight can present contrast problems, especially in spaces in which occupants use computer or television screens. Finally, windows are considered to be a channel by which occupants connect with the outdoors via the view to the outside. Ultimately, there are tradeoffs to performance in each of these categories as systems are typically optimized for a particular consideration.
The mathematical quantity which describes the angular behaviour of light through a facade is known as the Bi-Directional Transmission Distribution Function (BTDF). The BTDF is a relationship between the flux of light transmission and its angles of incidence and emergence, not a measure of system performance under actual facade conditions, which makes it difficult for anyone to relate the system to its contextual environment intuitively. The gap between BTDF values and system performance is complex enough to require a simulation workflow, which obviously renders the performance as being project-specific. Metrics that could relate BTDF quantities directly to at least relative performance (which would also make the information more generic) have the potential to fill this gap and provide context and intuition about a complex fenestration system to its users.
Existing metrics for conventional fenestration systems do describe aspects of each of the three categories presented previously, energy efficiency, occupant visual comfort, and view through the facade, for conventional systems. Reporting of fenestration specifications using these metrics is described in the United States by the National Fenestration Rating Council (NFRC), which mandates the calculation process and the labels that window manufacturers must provide on their windows upon sale to end users. The definition and calculation process of these metrics is adequate for simple window facades that do not exhibit significant angularly or spectrally changing properties. But because the existing approach is based on a single set of environmental conditions, it cannot be used as a reliable measure of annual performance for CFS, as these systems are often highly sensitive to solar position and climate conditions. Thus, there is a need for metrics that utilize the whole BTDF, rather than a single incident condition, and real climate data that changes with location and season in order to reveal the dynamics of complex fenestration systems.
THREE METRICS TO DESCRIBE CFSPERFORMANCE
In order to accomplish the needs described previously, three metrics have been defined to address the three most critical aspects of fenestration system performance mentioned previously, namely: energy efficiency, occupant visual comfort, and view through the facade. Relative Energy Impact (REI)
The Relative Energy Impact or REI metric is defined as the effect on energy load that can be attributed to a particular fenestration system as compared to a base case scenario. The full resolution calculation of the REI metric uses climate data provided by the US Department of Energy and heat transfer and solar heat gain models in order to calculate the absolute value of energy that traverses the facade system [4, 5]. The net direction of energy flow is then identified as contributing to (increasing) or decreasing the energy load of the building’s heating or cooling system. Lighting is accounted for using a simple algorithm that divides the test space into three zones, the perimeter, the middle, and the interior zones. Each zone is considered to have lights on unless all sensor locations within the zone exceed a given illuminance threshold chosen to be 200 lux, whereby the lights are dimmed. If all locations in the zone exceed 300 lux, the lights are turned off. But if the vertical illuminance produces a Daylight Glare Probability of more than 0.47, blinds are assumed to be drawn and lights are turned on, dimmed, again [4]. It is then possible to determine a value for the annual electricity required for the space for the base case window (double pane clear window) scenario and thus for each CFS as compared (normalized) to the base case.
Extent of Comfortable Daylight (ECD)
Meanwhile, although a subjective concept, occupant visual comfort can be described quantitatively using metrics that based on a virtual occupant’s viewpoint in a space [6]. These
metrics are inherently disconnected from the fenestration system and rely on simulations, renderings, or measurements to calculate. The Extent of Comfortable Daylight or ECD has thus been defined to provide a reference of visual comfort as it relates to the particular facade system [4]. It is the percent of time and space which achieves comfortable daylighting conditions – exceeds a minimum illuminance threshold (similar to Daylight Autonomy [7]) and remains below a threshold of glare acceptability (based on Daylight Glare Probability thresholds [5]) – rather than relying on a particular field of view. Using a generic test space, values are calculated over the course of the year to provide a single value that describes the overall visual comfort, again with respect to a base case [4]. The ECD metric is calculated using vertical and horizontal illuminance readings for 300 sensors in the test module. The values for these illuminance sensors are calculated using the genklemsamp command that allows Radiance to use a Klem’s basis BTDF and generate renderings and measurements with its ray-tracing engine [9]. (The same horizontal illuminance values are used to determine lighting loads in the REI metric.) This simulation provides values for each sample at 56 moments of the year, suggested as being representative of the year’s lighting conditions [10]. As with the energy efficiency calculations, the ECD metric will be reported as a comparison to the base case window scenario. This provides a physical reference for how a complex fenestration is performing relative to a standard alternative.
View Through Potential (VTP)
Finally, the visible transmittance is a value that is widely accepted to describe facade systems and also available to users via the labels required by the NFRC. It can be calculated using BTDF values associated to normal incidence of sunlight penetration. Although this value does not change significantly for other incident light angles with conventional systems, angularly selective facades can exhibit large ranges of transmission values.
The View Through Potential addresses this property of a system by measuring its degree of scatter: because direct (undistorted) light, i.e. light that has not been bent or scattered, is required to produce a faithful image, direct light transmission can arguably be used as a proxy for the potential of clear view through a system. A fenestration system may provide a clear view from only one or a few selected view directions, unlike a standard clear window e.g. which would provide a clear view from most angles. In some cases, for example a bathroom window, a clear view may be unnecessary, or even undesirable. Ultimately, an occupant’s most direct connection with a facade is how it looks and feels in a space, so the ability to view through is likely to be a critical performance argument in addition to energy and visual comfort performance.
The VTP metric approximates the capability of view through a façade by using the proportion of direct (undistorted) light transmission compared to non-direct (distorted) transmission as a basic proxy for an occupant’s ability to view an undistorted image through it.
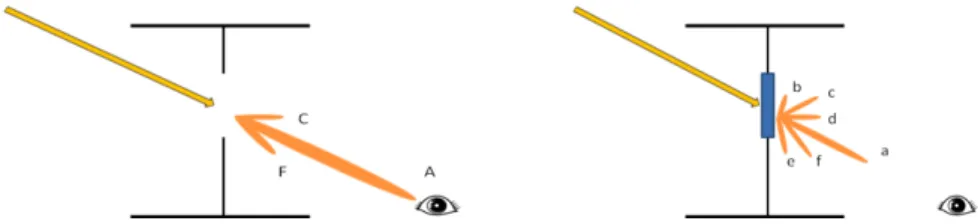
By using the transmission of a hole as a reference, it is possible to determine what portion of a system’s BTDF can be considered as direct transmission: the BTDF of a sample is compared to the measured BTDF of a hole, where the hole represents a perfectly clear and undistorted view and, numerically, the “sharpest” peak in BTDF (Figure 1).
The amount of light that is transmitted in perfect transmission (a hole) is BTDFA, BTDFC, and
BTDFF. The ratios below refer to the drop off associated with ideal transmission.
Figure 1: Visual representation of the BTDF of a hole (left) and a sample system (right) for a given view angle.
The amount of light that is transmitted directly due to the sample façade is a. The amount of light attributed to direct transmission in a given emerging direction is shown below, where BTDFa refers to the amount of light that is being transmitted in the view direction.
(2)
Light that is being transmitted in directions along which it is modified or distorted – i.e. providing light but not view – is shown in Equation 3.
(3)
The light transmitted in the b, d, and e directions is entirely non-direct. Once these fluxes have been separated into the direct and non-direct components (BTDF in Equation 4), the associated direct and non-direct integrated transmission is calculated [12].
(4) The degree of scatter, defined as S in Equation 5 below, is determined by calculating the ratio of direct transmission to scattered (everything but direct) transmission for a particular incident and emerging angle. τ represents the sum of fluxes for a given incident direction.
(5)
The degree of scatter is conducted for each view angle in the generic test space and consolidated into a single VTP value: the VTP metric is calculated using 300 sensor locations at eyelevel in the test module viewing 70 grid locations on the facade system so as to take into account that some view angles will be more relevant than others once the system is considered in a spatial context: while it may appear intuitive to disconnect the fenestration system from the space by identifying direct and diffuse transmission for each of the Klem’s basis angles, integrating the test space in this analysis allows a weighting of view angles depending on their relevance to a user (view directions from a ceiling are typically irrelevant).
The averaging process applied to the room and window locations thus automatically weights the important angles more heavily than grazing angles that are unlikely occurrences for view. Again, normalization with the base case is important for comparison purposes since spaces are undeniably more complex than the test module.
RELATIVE RANKING AND DATA REDUCTION
Each of the metrics were evaluated for a generic space for 5 different systems using detailed hourly climate data and lighting simulation techniques. This full resolution dataset was then used as a benchmark for system performance ranking.
The systems covered a wide range of behaviours and included: a reflective, bi-colour fabric blind, a Holographic Optical Element, curved mirrored blinds, opalescent plexiglas and a prismatic panel, for which measured BTDFs were available [12]. The REI and ECD metrics were calculated using the highest resolution of input parameters for location, climate, and orientation, totalling 300 values for each, and about 120 hours of simulation processing time. The VTP metric was calculated independently of climate and location as it related to light transfer through a system but independently of sky conditions and sun position.
The data reduction procedure aims to reduce the quantity of input conditions by reducing the resolution of each input parameter, without affecting the ranking provided by the benchmark case. Beginning with the benchmark data set, the authors selected a number of reductions in resolution which simplify the process yet do not significantly affect the accuracy of the REI and ECD values. Each level of simplification was added to the previous and the percent difference in REI and ECD value with respect to the full resolution case was calculated and reviewed. If the simplifications caused unacceptable discrepancies compared to the full resolution data, they were revised or eliminated from the process.
Climate zones and heat transfer for REI
The simplification process to the REI metric was conducted in three steps. From the initial fifteen climate zones, cities that consistently produced the same ranking were grouped into a single zone. This initial simplification reduces the number climate zones to eight based on latitude, nearly a 50% reduction in the number of calculations required. The most representative climate zone was identified among those grouped by calculating the mean square variance of each climate zone and selecting the zone that provides the least total mean square variance across all the sample systems. The Maximum Variation column in Table 1 refer to a particular sample and climate location that is worst affected by the data reduction process, even if the ranking of systems remains constant.
Second, although the quantity of heat that passes over the facade varies greatly with climate zone due to indoor and outdoor temperatures, the U-factor remains fairly constant (variance of about 0.02 W/m2 or less). Returning to the NFRC procedure to calculate the U-factor does not affect the overall accuracy of the REI metric substantially. Finally, condensing the solar heat gain factor to be a function of only time of day further increases the maximum variation.
REI simplification Max variation ECD simplification Max variation
Four climate zones 22% Four climate zones 5% NFRC U-factor [8] 27% Perez Intermediate sky [11] 18% SHGF: time of day 35% Direct/diffuse irradiance + sky
clearness: time of day 25%
Table 1: Simplification process and maximum variation from benchmark calculation, south. Latitude and sky conditions for ECD
Similarly, we applied a step by step simplification process to the full resolution calculation of the Extent of Comfortable Daylight (ECD) metric. The climate locations were reduced in the same manner; in this case, only one climate zone per orientation is necessary to produce the accurate ranking. Further simplifying the inputs to the Radiance simulation by defining all skies as Perez Intermediate skies increases the maximum variation to 18%. Finally, reducing the resolution of climate parameters to time of day affects the ECD metric less than the REI metric, but still increases the maximum variation.
Benchmark for VTP
The approach considered for the VTP metric was different. Since the ability to view through the facade is not related to solar position or climate conditions but rather on the degree of scatter of the system from a given view position, the quantitative calculation for VTP will be compared to a human opinion of overall view.
User studies will thus be conducted to validate the occupant ranking of view through by having Participants will be asked to observe various CFS samples and provide a ranking on view clearness going from perfectly clear to no view at all, with intermediate levels such as sense of contrast/distorted view, clear contrast/slightly distorted view, etc. We will then be able to evaluate calculated VTP values for these samples against perceived view through. DISCUSSION
This paper proposed three performance metrics named Relative Energy Impact (REI), Extent of Comfortable Daylight (ECD) and View Through Potential (VTP) that are able to provide a link between optical properties – expressed as BTDFs – and relative benefits or limitations for an application as a façade element. It also proposes a way to reduce the overall complexity of the calculation procedure for determining the REI, ECD, and VTP metrics for CFS. Ultimately, the metrics described will be calculated using an analytical prediction that eliminates the need for annual simulation, such that they can be calculated using only climate data and BTDF values. The ultimate metric system is projected to be a ranking system that does not report absolute metric values but a system’s relative performance (grade e.g.) for each of the input parameters.
The thermal performance that achieves a high ranking in a hot climate will not achieve the same degree of energy performance in a cold climate. The performance could potentially be reported on a specification sheet that accompanies the sale of a CFS, but this approach requires greater initiative from the user than the current metric structure does. In an effort to maintain the current metric reporting structure that is mandated for fenestration systems, the critical information must be represented in an easy-to-use manner at the scale of a label. Rather than being bound to the current value reporting approach, various mechanisms of representing different climate zones and orientations are being explored based on the results of this simplification procedure. Most notably, the reduction of the number of climate zones requires users to identify the location as being only one of four zones as opposed to fifteen. ACKNOWLEDGEMENTS
The financial support for this research was provided by the MIT Energy Initiative Seed Grant (S. Dave) and through MIT and EPFL (Prof. M. Andersen).
REFERENCES
1. Arasteh, D., Apte, J., Huang, Y.J. “Future Advanced Windows for Zero-Energy Homes”, ASHRAE Transactions, 109, 2 (2003). 2. Environmental Information Administration (2008). EIA Annual Energy Outlook.
3. Saxena, M., Heschong, L et. al., “61 Flavors of Daylight, American Council for an Energy Efficient Economy”, ACEEE (2010). 4. Dave, S., Andersen, M. “A comprehensive method to determine performance metrics for complex fenestration systems.” 27th
Conference on Passive and Low Energy Architecture. (forthcoming).
5. Karlsson, J., Karlsson, B., Roos, A., “A simple model for assessing the energy performance of windows,” Energy&Buildgs, 33 (2001). 6. Wienold J. “Dynamic daylight glare evaluation.” Proc. IBPSA Conference, Glasgow, July 27-30, pp. 944-951, (2009).
7. Reinhart, C.F., Walkenhorst, O., “Validation of dynamic RADIANCE-based daylight simulations for a test office with external blinds,” Energy & Buildings, 33 (2001)
8. Saxena, M., Ward, G., Perry, T., Heschong, L., Higa, R. “Dynamic radiance – predicting annual daylighting with variable fenestration optics using BSDFs” SimBuild – forthcoming. (2010).
9. Kleindienst, S., Bodart, M., Andersen, M., “Graphical Representation of Climate-Based Daylight Performance to Support Architectural Design”. LEUKOS - The Journal of the IESNA, 5, 1 (2008).
10. National Fenestration Rating Council. <www.nfrc.org> Accessed 14 October 2010
11. Perez, R., Seals, R., Michalsky, J “All-weather model for sky luminance distribution – preliminary configuration and validation” Solar Energy, 50, 3 (1993).