THE PREDICTORS OF YOUTH EMPLOYMENT IN RURAL SOUTH AFRICA: THE POVERTY ALLEVIATION PILOT STUDY
By
Andra Wilkinson
A paper presented to the faculty of The University of North Carolina at Chapel Hill in partial fulfillment of the requirements for the
degree of Master of Public Health in the Department of Maternal and Child Health.
Chapel Hill, N.C.
2
Abstract
Objectives: Explore predictors of employment among 18-24 year olds in Mpumalanga,
South Africa to inform intervention development.
Method: The Poverty Alleviation Pilot collected quantitative data from 18-24 year olds
randomly sampled from the Agincourt Health and Demographic Surveillance site in rural
South Africa. Logistic regression models were estimated to identify demographic,
qualification, and psychosocial predictors of youth employment.
Results: Youth with working skills were significantly more likely to report employment
and youth reporting greater life dissatisfaction also had slightly greater odds of
employment. Having training was also significantly positively associated with
employment, but for males only.
Conclusions: To decrease youth unemployment, rural youth need access to training and
3
Table of Contents
Abstract………2
Table of Contents………3
Problem Statement………..4
Research Question………...4
Literature Review………5
Methods………..11
Results & Interpretation………18
Policy Implications……….28
Conclusions………31
References……….……….33
4
Problem Statement
Nearly 50% of South African youth (15-24 years old) are unemployed, among the
highest proportion in the world. Youth unemployment in South Africa disproportionately
affects youth who are Black, female, and/or living in a rural area.1–4 Risk of HIV
infection also peaks during youth (18 to 24 years of age) in South Africa.5 Understanding
the economic environment young South Africans face when they leave school and
attempt to enter the workforce is critical for designing poverty alleviation interventions
that can decrease both unemployment and HIV risk among young adults in South Africa.
Research Question
What are the predictors of employment among 18-24 year old males and females
in Mpumalanga, South Africa?
This research question is relevant to maternal and child health because
unemployment in South Africa is higher for young women and increasing. From 2000 to
2008, the percentage of young women looking for work increased from 30 to 50%.2 It is
well documented that socioeconomic vulnerability among women in South Africa also
increases their vulnerability to HIV by increasing their dependence on male partners and
potentially increasing unsafe sexual behaviors.6 In general, young women are 3-4 times
more likely than males their age to become infected in South Africa.5 Thus, improving
the employment options for youth in rural South Africa could have the added benefit of
5
Literature Review
Youth unemployment is a global problem. In 2010, 90% of youth (15-24 years
old) in the world were living in developing countries and two thirds were unemployed.8
High youth unemployment is of greater magnitude in Africa where two thirds of the
continent’s population is under 30.9
In South Africa in particular, youth make up 20% of
the workforce and have the fifth highest unemployment percentage in the world at
49.8%.1,10 Youth unemployment in South Africa varies by certain demographic variables
with unemployment being highest among youth who are Black, female, and/or living in a
rural area.2–4 High youth unemployment has negative consequences in both the short and
long term. In the short term, youth unemployment is correlated with increases in crime,
substance use, and discouragement (no longer seeking work).11 In the long term, a gap
between youth finishing school and finding a first job significantly harms their
employment trajectory and wages.11,12
Though youth unemployment is very high in rural South Africa, there are youth
who manage to find employment. Previous studies have found numerous predictors of
youth employment in South Africa. Starting with sociodemographic characteristics, an
analysis of the 1999 October Household Survey data, based on a national sample that
included 15,453 households with youth (15-30 years of age), found that being married
increased the likelihood of both wage employment and self-employment. In contrast,
being a parent increased the likelihood of being self-employed but inhibited wage
employment, possibly due to limited schedule flexibility. A potential explanation for the
associations between being married and/or a parent and employment is that both
characteristics would increase responsibilities and incentivize entry into the labor market.
6
more likely to stay with the company in the long-term.4 Though this data is nearly 15
years old, the study remains one of the most cited investigations of youth employment in
South Africa and so is important to include.
The relationship between education and employment in South Africa is far less
clear. Data from the 1999 October Household Survey indicate only education beyond
high school (technical training or university) is significantly associated with
employment.4 However, analyses of data from the Cape Area Panel Study (collected from
2002 to 2006) of nearly 5,000 14 to 22 year-olds in Cape Town found completing grade
12 in high school was associated with a 69% higher hazard rate of finding a job,
compared to those who only completed grade 10. For Black South African males
however, completing grade 12 did not make a difference in employment until 20 months
after graduation.3 Though these data came from an urban area, similar results have been
found in rural areas. A 2013 study of the connection between rural youth employment
and old age pensions in KwaZulu-Natal found young men who had passed matriculation
(the exam required to complete grade 12) were 8% more likely to migrate and find work
compared to men without matric, once the elderly members of their households began
receiving old age pensions.13 In short, there seems to be a positive association between
education and employment, though the level of education required and how soon after
graduation the association appears are debated.
The connection between education and employment also relates to the skills youth
have and employers’ perceptions of those skills. For example, the Cape Area Panel Study
found that high scores on numeracy tests (from the self-administered Literacy and
7
because of quality issues in South Africa’s education system having a matric certificate
may not necessarily be correlated with high numeracy scores. In fact, four of five youth
completing high school in South Africa are considered functionally illiterate, meaning
they lack the skills necessary to attend university.4 As employers face high retrenchment
costs (the costs of employee layoffs) in South Africa’s relatively inflexible labor market,
they want to verify a worker’s productivity before hiring them.11
Given the quality issues
in the education system, it is perhaps not surprising that data from the 2005 Labor Force
Survey found unemployment for youth under age 35 was 46.7% for those who had
passed matric but only 27% for those who hadn’t passed matric but who had extra
diplomas or certificates.14 Perhaps in this instance the diplomas and certificates, likely
from training programs, were better proof that the applicants had the necessary skills for
employment than a matric certificate. Such is the motivation behind the Further
Education and Training (FET) college tradition in post-Apartheid South Africa.15,16
Though most vocational and technical training is provided through colleges and
universities, FET colleges in rural areas provide vocational certificates and can connect
students with learnerships, or paid internships designed to lead to employment.16
Before an applicant can present their qualifications to an employer, of course,
they have to know of job openings. Data from the Labor Market Entry Survey in
Gauteng, KwaZulu-Natal and Limpopo found 66% of respondents reported hearing about
job vacancies from social contacts.11 Further, an econometric analysis of professional
networks and youth employment in South Africa found having employed household
members increased employment probabilities among youth by 3-12%.17 This effect may
8
member increased the chances of wage employment but decreased chances of
self-employment.4 Overall, it seems the social networks of youth, including family, are an
important aspect of youth job-seeking (e.g., through providing information on job
opportunities).
Finally, perhaps proximal to all other relevant employment predictors, are
psychological traits of the applicant. In developing countries, including South Africa,
youth tend to be employed in informal sectors or via self-employment.8,11 As
self-employment requires initiative and confidence in your skill sets, youth who are employed
in South Africa likely have greater self-confidence in entrepreneurship and more
empowered attitudes. Finally, youth who are employed would also likely have higher life
satisfaction. Studies of unemployment in South Africa have found lower subjective
well-being among those who are unemployed.4,18,19 For example, of a sample of 381
unemployed people (most between 17 and 30 years of age) from the North West Province
of South Africa, over 80% reported unemployment as unpleasant or very unpleasant.
More specifically, boredom, loneliness, uncertainty about the future, financial concerns,
emptiness and conflict seemed to be key contributors to the unpleasantness. Also, 96% of
the respondents reported work as important, mostly because of the meaning it can
provide.19
In short, based on findings from previous studies, it appears there is a wide range
of potential predictors of youth employment. For demographics, being married or being a
parent could increase the odds of youth employment.4 Completing high school and
passing matric are also likely to increase youth’s ability to obtain work.3,4,13 Though, due
9
be a more important predictor of employment as it can signal to the employer the
presence of more concrete skills.4,11,14 Beyond qualifications, job-seeking behavior is also
important to consider and it seems youth with relatives or friends who are working may
have more information on job vacancies thus increasing their chances of employment.
Finally, with regards to psychology, youth who are more confident in their
entrepreneurial skills are probably more likely to be employed, as employed youth in
South Africa are concentrated in self-employment.8,11 Also, employed youth likely have
higher life satisfaction compared to unemployed youth.4,18,19
This paper is an exploratory analysis of the potential demographic, qualification,
and psychosocial predictors of youth employment in the rural Mpumalanga Province of
South Africa. Figure 1 outlines the conceptual model guiding these analyses. The model
is constrained by the available data source, a quantitative survey conducted with 187
males and females 18-24 years of age in the summer of 2013. Based on the findings of
studies outlined previously, a positive relationship is hypothesized between each of the
predictor variables and employment. It is also likely some of the predictor variables will
be positively associated with each other (e.g., being a parent and being married), and
these relationships are also identified in Figure 1.
10
Though youth unemployment in South Africa has been studied numerous times in
the past decade, this study addresses several gaps in the literature. First, several previous
studies used data from urban provinces.3,11,14 As youth unemployment is acknowledged to
be worse in rural areas, the data for this study allow for new and valuable insights to the
field as they were collected in two villages in the rural Mpumalanga Province. Second,
many previous studies used much broader definitions of youth. For example, Mlatsheni et
al. included people up to age 30 as youth and Burns et al. included persons up to age
35.4,14 Though the government definition of youth in South Africa was expanded in 1994
to range from 14 to 35 years, economic analyses identify the more narrow time of the
transition from school to the first job as a critical time period.12,16 This study, focusing on
youth 18 to 24 years old, provides a more targeted analysis of the school to work
transition period. Third, the present study, as an exploratory analysis, includes a broad
range of potential predictors of employment ranging from demographic characteristics
like parenthood to qualification variables such as training to psychological measures of
Employment in last 4 weeks
Professional Network •Relatives •Friends Parental status Education •Educational attainment •Matric •Diplomas Marital status Psychology •Self-confidence
•Empowerment attitude •Life satisfaction
11
self-confidence and empowerment. Though previous studies have included some of these
predictors, none have included them all.
Methods
Sampling
Data for the Poverty Alleviation Pilot Study were obtained using quantitative
surveys conducted in two different villages in Mpumalanga Province, South Africa. The
two villages were strategically chosen to represent one of the largest (in terms of
population size) and one of the smallest villages, respectively, in the Agincourt Health
and Demographic Surveillance site (AHDSS). The AHDSS conducts an annual census to
collect demographic information on all residents in the study area. The database of
households in this site was used to randomly sample, using random numbers, eligible
households from both villages in a 3:2 ratio to reflect differences in population size.
Inclusion criteria for enrollment were: 18-24 years old and not enrolled in school. The
final sample included 81 males and 106 females for a total sample of 187 youth. The
target sample size was between 150 and 200 to have sufficient power for the analyses. Of
those asked to participate in the study, none refused, yielding a participation rate of
100%. The gender ratio among the 100 respondents from Village A was nearly 1:1, but in
Village B there were over twice as many females sampled as males due the high
prevalence of labor migration among males.20 To increase the probability of capturing
youth who were employed, we included periods of data collection on weekends and
12 Design
The Poverty Alleviation Pilot Study was approved by the Institutional Review
Board of the University of North Carolina at Chapel Hill. The content of the quantitative
survey was informed by the items used in the World Bank Urban Youth Employment
Project Eligibility Screen, the Brac Uganda Adolescent Development Program, the Urban
Youth Baseline Survey Questionnaire from Liberia, and finally the EnCoDe Long-Term
Impact of Nutrition survey from Gambia.21–23 The completed survey included eleven
sections including: a household roster; household assets; demographics; education history
(e.g., educational attainment, passing matric, diplomas outside of school, etc.);
employment history (items for 15 different types of employment); job environment
perceptions and expectations; professional network (a list of up to three friends who are
working); loans and savings (e.g., access to banking and loans, saving behaviors, etc.);
job skills and training; a test of financial literacy; and three scales to assess
self-confidence in entrepreneurship, empowerment attitude, and overall life satisfaction.
The survey was written in English and then translated into Shangaan, the local
language. The pilot study lacked sufficient time and resources for formal back translation
of the questionnaire but during training the fieldworkers were asked to verbally translate
the questions from Shangaan into English as a proxy.
Data collection
Once the household samples were obtained, packets were put together containing
a tracking sheet identifying all eligible members of the household and their asset quintile,
13
identification number and this was used to order the survey packets by their geographic
distribution in the village. From this distribution, the survey packets were organized into
walkable “neighborhoods” for each fieldworker to maximize the efficiency of data
collection. After identifying a household, the fieldworker was to approach the head of the
household and verify whether the first eligible household member listed on the tracking
sheet was indeed eligible. Specifically, the fieldworker double-checked that the
household member was not enrolled in school, was between 18 and 24 years of age, was
a permanent resident of the village (lived there at least six months out of the year), and
was mentally competent. If a household member was determined to be ineligible, for
example they had moved away to find work, the fieldworker inquired about the next
eligible household member listed on the tracking sheet, if there was one. If instead the
household member was confirmed eligible but was not available to complete the survey,
the fieldworker obtained the phone number of the potential respondent and tried to set a
specific appointment with them for the next day. If they were unable to set an
appointment, the fieldworker was to return to the household the next day at a different
time if possible. If a potential respondent was deceased or refused to participate, the
fieldworker was to proceed to the next household. In total there were five fieldworkers,
all adult women from the region and fluent in the local language, and it took them one
14 Measures
Outcome: Employment.Employment status was assessed by asking participants
whether they had performed a range of employment activities in the past four weeks (e.g.,
skilled trade, transportation, etc.). If a participant responded ‘yes’ for any activity, they
were considered to be employed. Though wage employment was included as an option,
the vast majority of the employed respondents were self-employed, meaning they did not
work in an office or for a formal employer, so the two categories were collapsed in
analyses.
Demographic Predictors: Marriage and parenthood. As a very small proportion
of the sample reported being widowed, divorced or cohabiting, we collapsed marital
status into a binary variable and only counted those who reported being currently married
as married. Being a parent was also a binary variable generated from responses to the
question of “How many living children do you have?”
Qualification Predictors: Educational attainment, passing matriculation,
diplomas outside of school, having working skills, and training.Educational attainment
was assessed on a range from no education at all to university attendance. The majority of
the sample clustered around less than high school or completing high school and so
education was coded as a binary variable with less than high school used as the referent.
Passing the matriculation exam (matric) was assessed separately and included passing
with and without university exemption, meaning qualifications to enter a South African
university. As university attendance was very low in the sample, everyone who passed
was coded the same, regardless of university exemption. Respondents were also asked if
15
similar institution connecting training and employment.15 Two binary variables were
generated for completed diploma and work towards a diploma in progress. For working
skills, respondents were asked if they possessed any of a range of skills (e.g., computer
skills) and were also able to list others. The skill list was adapted from the World Bank
Urban Youth Employment Project Eligibility Screen; respondents who listed any working
skills were counted as having working skills in a binary variable.22 Finally, respondents
had the opportunity to list two training or apprenticeship opportunities they had
completed and one completed business training. Respondents who completed any
training opportunity in these categories were identified as receiving training in a binary
training variable.
Psychosocial Predictors: Professional network, self-confidence in
entrepreneurship, empowerment attitude, and overall life satisfaction.To assess the
professional networks of respondents and their association with employment, two
variables were created .The first is intended to measure the professional network
respondents have among relatives. This variable was created from the household roster at
the beginning of the survey that asked about employment in the past week for all
household members. Though the relationship to the respondent was not collected in the
household roster, if a household member reported employment the respondent was
identified as having a professional network among relatives. Counting employed
household members as a respondent’s professional network is consistent with previous
analyses.17 The survey also asked respondents to list up to three friends who were
working. If a respondent listed at least one friend who was working, the respondent was
16
The three psychological constructs (see Table 1) used in the survey were obtained
from the Brac Uganda Adolescent Development Program.21 The first scale assessed
self-confidence in entrepreneurial tasks (Cronbach’s alpha=0.83) by asking participants to
rank, on a scale of 1-10 (10 being high), their ability to do ten tasks (e.g., “manage
financial accounts”). Using the same scaling system, the empowerment attitude scale
(Cronbach’s alpha=0.76) asked respondents to rank how true ten statements were for
themselves (e.g., “I often make plans for the future”). The overall life satisfaction
questions (Cronbach’s alpha=0.58) asked participants to rank on a scale of 1-7 (1 being
high) their happiness with certain aspects of their lives (e.g., friends, house, etc.). For
each of the three psychology scales, answers were summed. As a higher summed score
on the life satisfaction scale indicates greater dissatisfaction, in this paper it will
subsequently be identified as the life dissatisfaction scale. Information on scale validity is
not available.
Sociodemographic characteristics: Age, asset quintile, and gender.Age, asset
quintile and gender were used as control variables in these analyses. The asset quintile
gives a score ranging from one to five (one being the lowest quintile) to households based
on their assets; this serves as a proxy measure for socioeconomic status and was
pre-populated from the AHDSS census records. Though racial identity data were collected,
they were not used as all respondents identified as Black/African and all but two
identified as South African. Also, data were collected from two villages but as all
respondents reported no job skills or business training in their communities, the data from
17
TABLE 1 – Items in psychology scales, Poverty Alleviation Pilot, 2013 Self-confidence in Entrepreneurial Tasks (10-100)
Rate your ability to do task from 1-10, 1: cannot do activity, 10: definitely can
Run your own business
Identify business opportunities to start up new business
Obtain credit to start up new business or expand existing business Save in order to invest in future business opportunities
Make sure that your employees get the work done properly Manage financial accounts
Bargain to obtain cheap prices when you are buying anything for business (inputs) Bargain to obtain high prices when you are selling anything for business (outputs) Protect your business assets from harm by others
Collecting the money someone owes you
Empowerment Attitude (10-100)
Rate how true each statement is to yourself, 1: not at all 10: a lot
If I start working on a task, I definitely see the end of it no matter how difficult it is. While doing any task, it is important for me to do it better than others.
If I have the chance, I would make a good leader. I want to be a respected person in my village.
I do not care what others think about my success or failure I am in control of what happens in my life
I save regularly
A person can get rich by taking risksa I often make plans for the future
I believe that my future is determined by luck no matter how hard I worka
Overall Life Satisfaction (7-49)
Rate how happy you are with each aspect of your life, 1: completely happy, 7: not at all happy
Your education level? Your family?
Your friends?
Your job or employment prospects? Your earnings/income?
The house you live in? Life as a whole?
a
Reverse coded to align with overall scale
Data analysis
Both bivariate associations and logistic regression models were used to analyze
these data. For the bivariate associations between the predictors and employment,
18
tabulations. To maximize cell counts many of the previously ordinal variables were made
into binary variables, as outlined previously. Fisher’s Exact Test was also used to test for
associations between certain predictor variables expected to be associated (e.g., being
married and being a parent) to identify the possibility of collinearity in the regression
models.
Logistic regression models were built to test the association between each
individual predictor and employment. Each model included control variables and a
separate model was used for each individual predictor both to avoid potential collinearity
between the variables and to capture the largest possible pool of relevant predictors. This
method also provides a better answer to the research aim, which is to identify all possible
predictors of unemployment, rather than the relative strengths of some predictors over
others. Next, the models were stratified by gender. The referent groups for the logistic
regressions were chosen as the variable expected to share the least positive relationship
with employment (e.g., not passing matric is the referent to examine the effect of passing
matric on the odds of being employed).
Results & Interpretation
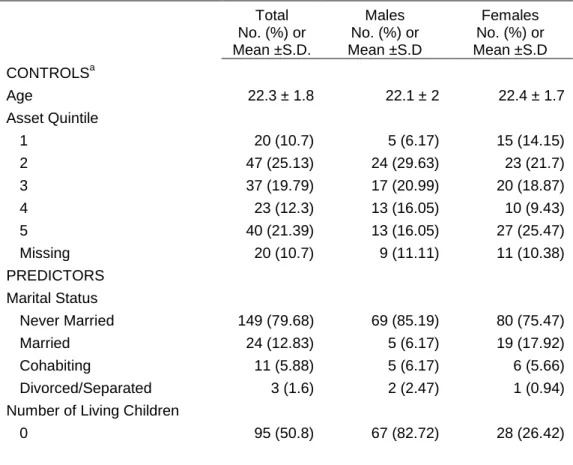
More than half of the sample was female (54%) and the average age was 22.3
years. Though 56% of the sample had passed matric, fewer than one quarter of
respondents were employed. The national average of unemployment (just under 50%) is
significantly lower than the 75% unemployment in this sample but this higher estimate
aligns with analyses of census data in South Africa that revealed 76.39% of 15-24
19
largest difference between males and females was seen on the parent variable; over 70%
of female respondents reported having at least one child compared to only 14% of males.
The most likely explanation for this discrepancy is that it is common for females to
partner with older men meaning the fathers of the female’s children are likely not
represented in this sample due to age constraints, also a greater percentage of females
reported being married.24 Other notable gender differences included a higher percentage
of men reporting completing high school or being in university compared to females.
Men were also much more likely than females to report having working skills and
receiving skills or business training. Relatedly, the proportion of males reporting current
employment (38.27%) was more than twice as high as the proportion for females
(12.26%). Table 2 provides further descriptive statistics on the sample.
TABLE 2 -- Characteristics of the Sample, Poverty Alleviation Pilot, 2013
Total Males Females No. (%) or
Mean ±S.D.
No. (%) or Mean ±S.D
No. (%) or Mean ±S.D CONTROLSa
Age 22.3 ± 1.8 22.1 ± 2 22.4 ± 1.7 Asset Quintile
1 20 (10.7) 5 (6.17) 15 (14.15)
2 47 (25.13) 24 (29.63) 23 (21.7) 3 37 (19.79) 17 (20.99) 20 (18.87) 4 23 (12.3) 13 (16.05) 10 (9.43) 5 40 (21.39) 13 (16.05) 27 (25.47) Missing 20 (10.7) 9 (11.11) 11 (10.38) PREDICTORS
Marital Status
Never Married 149 (79.68) 69 (85.19) 80 (75.47) Married 24 (12.83) 5 (6.17) 19 (17.92) Cohabiting 11 (5.88) 5 (6.17) 6 (5.66) Divorced/Separated 3 (1.6) 2 (2.47) 1 (0.94) Number of Living Children
20 1 61 (32.62) 8 (9.88) 53 (50.00)
2 27 (14.44) 6 (7.41) 21 (19.81)
3 4 (2.14) - 4 (3.77)
Educational Attainment
Some primary 5 (2.67) 2 (2.47) 3 (2.83) Completed primary 6 (3.21) 5 (6.17) 1 (0.94) Some high school 69 (36.9) 25 (30.86) 44 (41.51) Completed high school 102 (54.55) 46 (56.79) 56 (52.83) University or technikon 5 (2.67) 3 (3.70) 2 (1.89) Passed matric 105 (56.15) 45 (55.56) 60 (56.6) Completed diplomas outside of
school 40 (21.39) 15 (18.52) 25 (23.58) Completing diplomas outside
of school 19 (10.16) 5 (6.17) 14 (13.21) Employment
Currently employed 44 (23.53) 31 (38.27) 13 (12.26) Seeking work in past 3 months 129 (68.98) 64 (79.01) 65 (61.32) Have working skills 86 (45.99) 50 (61.73) 36 (33.96) Received skills training 47 (25.13) 30 (37.04) 17 (16.04) Received business training 42 (22.46) 23 (28.4) 19 (17.92) Network
Relatives working 168 (89.84) 74 (91.36) 94 (88.68) Friends working 75 (40.11) 40 (49.38) 35 (33.02) Psychology
Self-confidence in
entrepreneurship 81.5 ± 13.6 82.7 ± 13.9 80.6 ± 13.4 Empowerment attitude 84.2 ± 11.4 84.0 ± 13.4 84.3 ± 9.7 Life dissatisfaction 31.0 ± 9.7 30.6 ± 9.7 31.2 ± 9.7 N=106 Females, 81 Males
a
The entire sample identified as Black or African eliminating the need to control for race;
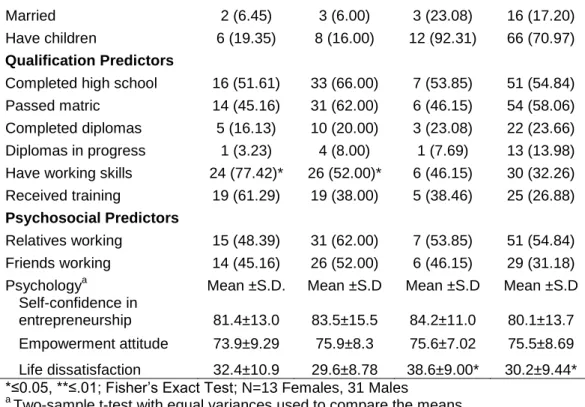
The results of the bivariate associations between the predictor variables and being
employed are in Table 3. Having working skills was significantly associated with being
employed for males. Also, life dissatisfaction was significantly associated with
employment for females.
TABLE 3 – Demographic, qualification, and psychosocial characteristics of employed and unemployed males and females, Poverty Alleviation Pilot, 2013
Males Females
Employed Unemployed Employed Unemployed No. (%) No. (%) No. (%) No. (%)
21 Married 2 (6.45) 3 (6.00) 3 (23.08) 16 (17.20)
Have children 6 (19.35) 8 (16.00) 12 (92.31) 66 (70.97)
Qualification Predictors
Completed high school 16 (51.61) 33 (66.00) 7 (53.85) 51 (54.84) Passed matric 14 (45.16) 31 (62.00) 6 (46.15) 54 (58.06) Completed diplomas 5 (16.13) 10 (20.00) 3 (23.08) 22 (23.66) Diplomas in progress 1 (3.23) 4 (8.00) 1 (7.69) 13 (13.98) Have working skills 24 (77.42)* 26 (52.00)* 6 (46.15) 30 (32.26) Received training 19 (61.29) 19 (38.00) 5 (38.46) 25 (26.88)
Psychosocial Predictors
Relatives working 15 (48.39) 31 (62.00) 7 (53.85) 51 (54.84) Friends working 14 (45.16) 26 (52.00) 6 (46.15) 29 (31.18) Psychologya Mean ±S.D. Mean ±S.D Mean ±S.D Mean ±S.D
Self-confidence in
entrepreneurship 81.4±13.0 83.5±15.5 84.2±11.0 80.1±13.7 Empowerment attitude 73.9±9.29 75.9±8.3 75.6±7.02 75.5±8.69 Life dissatisfaction 32.4±10.9 29.6±8.78 38.6±9.00* 30.2±9.44* *≤0.05, **≤.01; Fisher’s Exact Test; N=13 Females, 31 Males
a
Two-sample t-test with equal variances used to compare the means
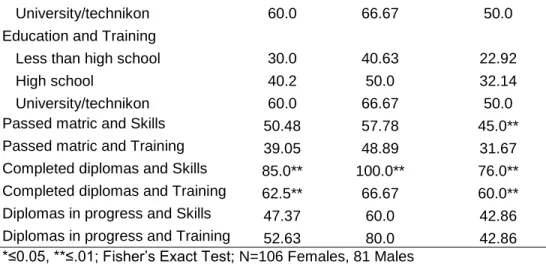
The associations among some of the predictors are outlined in Table 4; only the
predictors that were hypothesized to be connected to each other, as outlined in to the
conceptual model, were tested. Being married and being a parent were significantly
associated with each other, both in the total sample and for males. Also, passing the
matriculation exam and reporting having working skills were associated for females.
Finally, diplomas completed outside of school were strongly associated with self-report
of both receiving training and having working skills, though this association went away
for respondents who reported diplomas in progress. These associations confirm the
decision to include only one predictor in each regression model.
TABLE 4 – Bivariate associations between predictor variables, Poverty Alleviation Pilot, 2013
Total % Male % Female % Marital status and Children 87.5** 80** 89.47 Education and Skills
Less than high school 40.0 62.5 25.0
22 University/technikon 60.0 66.67 50.0
Education and Training
Less than high school 30.0 40.63 22.92
High school 40.2 50.0 32.14
University/technikon 60.0 66.67 50.0 Passed matric and Skills 50.48 57.78 45.0** Passed matric and Training 39.05 48.89 31.67 Completed diplomas and Skills 85.0** 100.0** 76.0** Completed diplomas and Training 62.5** 66.67 60.0** Diplomas in progress and Skills 47.37 60.0 42.86 Diplomas in progress and Training 52.63 80.0 42.86 *≤0.05, **≤.01; Fisher’s Exact Test; N=106 Females, 81 Males
Table 5 presents results for the overall adjusted logistic regression analyses, as
well as those stratified by gender. In the adjusted model, if a respondent reported having
working skills, they had 2.29 times the odds of being employed. In the gender-stratified
adjusted model, it seems this association was driven largely by the males in the sample.
Similarly, if a male respondent reported receiving training he had 3.01 times the odds of
being employed. Finally, greater life dissatisfaction was significantly associated with
employment, though this relationship seems to be driven mostly by the females.
Though most of the predictor variables did not show a significant association with
employment, some of the point estimates were markedly different for males and females
and warrant some attention. For example, the ORs for being married and for having
children were in the expected direction of increasing the odds of employment, but the
gender-stratified models revealed marriage may be relevant only for males and
parenthood may be more relevant for females than males. Also, the ORs for completing
high school and having diplomas in progress were only above one for females. However,
it is important to note the confidence intervals for these associations were quite wide,
23
Interestingly, some predictors in Table 5 produced ORs that indicated an inverse
relationship with employment, contrary to the hypotheses. For example, passing matric
produced consistent ORs less than one in the overall and gender-stratified models with
tight confidence intervals indicating decreased odds of employment among youth who
passed matric. Finally, having relatives or friends who are working seems to be
associated with decreased odds of employment in the overall model and for males,
though not for females.
Overall, the differences in these point estimates indicate that for females, being a
parent, completing high school, and working towards a diploma may be important
predictors of employment. For males, it appears being married, having skills, or receiving
training may be important predictors of employment. It is important to note that some of
these associations may be endogenous. For example, men who are married may be more
attractive to employers and therefore more likely to be employed or men who are
employed may be more attractive to potential partners and thereby more likely to be
married.4
TABLE 5 – Odds ratios for odds of employment for demographic, qualification and psychosocial predictors, Poverty Alleviation Pilot, 2013
Adjusted OR (95% CI)a
Males Adjusted OR (95% CI)
Females Adjusted OR (95% CI)
Demographic Predictors
Marital Status
Not Married 1.00 1.00 1.00
Married 1.15 (0.33, 4.00) 1.94 (0.25, 15.2) 0.88 (0.17, 4.62) Number of Living Children
None 1.00 1.00 1.00
At least 1 1.66 (0.60, 4.62) 1.44 (0.36, 5.76) 3.63 (0.43, 30.7)
Qualification Predictors
Educational Attainment
24 High school or more 0.78 (0.36, 1.70) 0.52 (0.19, 1.43) 1.77 (0.47, 6.7)
Did not pass matric 1.00 1.00 1.00
Passed matric 0.53 (0.25, 1.15) 0.52 (0.20, 1.38) 0.76 (0.20, 2.85) No completed diplomas 1.00 1.00 1.00
Completed diplomas 0.62 (0.22, 1.76) 0.53 (0.14, 2.05) 0.77 (0.14, 4.21) No diplomas in progress 1.00 1.00 1.00
Diplomas in progress 0.49 (0.10, 2.44) 0.30 (0.03, 3.07) 1.17 (0.12, 11.9)
No working skills 1.00 1.00 1.00
Have working skills 2.29 (1.02, 5.12)* 3.22 (1.06, 9.83)* 1.76 (0.48, 6.49)
No training 1.00 1.00 1.00
Received training 2.03 (0.94, 4.40) 3.01 (1.07, 8.46)* 1.57 (0.40, 6.12)
Psychosocial Predictors
Network
No relatives working 1.00 1.00 1.00 Relatives working 0.82 (0.39, 1.74) 0.65 (0.25, 1.70) 1.24 (0.34, 4.51)
No friends working 1.00 1.00 1.00
Friends working 0.95 (0.44, 2.05) 0.85 (0.32, 2.29) 1.78 (0.48, 6.56) Psychology
Self confidence in
entrepreneurship 1.00 (0.97, 1.03) 0.99 (0.96, 1.03) 1.04 (0.98, 1.10) Empowerment attitude 0.98 (0.94, 1.03) 0.98 (0.92, 1.03) 1.00 (0.93, 1.08) Life dissatisfaction 1.05 (1.00, 1.09)* 1.03 (0.98, 1.08) 1.11 (1.02, 1.21)* *≤0.05, **≤.01; N=81 Males, 106 Females
a
Covariates in adjusted model were age, asset quintile, and sex though only sex was significant at p<0.001 and in the inverse direction with male as the referent; age and asset quintile remained covariates in the models stratified by sex and remained non-significant.
Though these data are cross-sectional and thereby preclude us from making causal
inferences, the associations reported here lend themselves to informative interpretations.
First, males who reported having working skills or receiving training had increased odds
of being employed. This association was not significant for females. As these data are
cross-sectional, this association could go in either direction. In South Africa, learnerships,
or paid training provided by employers, are a common way for youth to find
employment.16 In this way, the training would precede the employment. For working
skills, youth could obtain these through employment or past employment changing the
25
prevalence of labor migration to urban centers, especially among males, many of the
most-skilled youth were probably not captured in the sample.20
Second, for females only, greater life dissatisfaction was associated with higher
odds of employment, contrary to the hypothesis. Again, the directionality could lead from
or to employment. Perhaps youth who are more dissatisfied with their lives are more
likely to seek opportunities like training or employment to improve their lives. Other
analyses of the data revealed most of the sample expected to be in clerical work when
they were thirty. Thus, it is also possible that youth currently in informal employment
consider it underemployment or that they are not on track to meet their goals thus leading
to dissatisfaction. A 2012 report from the International Labour Office (ILO) emphasizes
that youth who are employed in developing countries are often ‘working poor’ meaning
they are working for survival and are stuck in low-wage and low-productivity jobs in the
informal sector. The ILO goes on to say that employed youth in developing countries
often fare worse than youth who are not in education, employment, or training because
employed youth can be stuck in a cycle of poverty.8 As the majority of the employed
youth in this study sample were in the informal sector, perhaps their membership in the
‘working poor’ contributed to their dissatisfaction. Though the association was only
significant for females, the lower limit of the confidence intervals was 1.02 for females
and 0.98 for males indicating the association between life dissatisfaction and employment
is modest and does not seem to differ substantially between males and females.
The remaining majority of predictor variables were not significant in the logistic
regression models, violating the hypotheses of a positive association between the
26
size. While the sample included sufficient numbers of youth per the initial power
calculations, unemployment in the sample was 50% higher than expected thereby
constricting the proportion of the sample who are employed. The limited sample size,
especially of employed youth, likely widened the confidence intervals of the associations
thereby decreasing their precision and chances of being significant. It is also possible,
however, that some of the predictor variables are not associated with employment, which
would be contrary to previous studies.
It is interesting to note, however, that some OR point estimates indicate negative
associations between the predictor variable and employment. For example, the OR for
passing the matriculation exam indicated that this decreases respondents’ odds of being
employed, though not significantly so. A possible explanation is that the vast majority of
employed respondents worked in informal sectors or were self-employed (e.g., braiding
hair), a common situation in South Africa even into young adulthood.11 In Mpumalanga,
South Africa most formal employers require a matriculation certificate (verifying a
passing score) from all applicants.11 Unfortunately, in the villages where the respondents
were living, there were few formal employers. Thus, if the respondents who passed their
matriculation are targeting the limited formal employment opportunities, their odds of
employment might be lower than respondents without a matriculation certificate whose
only option is informal or self-employment, which were much more common in the
sample. Also, as South Africa’s economy has shifted to value more skilled, rather than
unskilled labor, entry level positions are rare and competitive. A 2010 study from the
International Food Policy Research Institute hypothesizes that a matriculation certificate
27
produced OR point estimates less than one for both genders, the OR for completing high
school for females was greater than one indicating a possible differential effect by
gender. This may be because, compared to males, female youth in the sample were less
likely to complete high school and overall there is a lower proportion of females
participating in the labor force in South Africa.25 Together, these factors may combine to
mean completing high school, even without matric, may still give females an edge on
qualifying for employment.
Finally, the point estimates were less than one for having friends or relatives who
are working in both the overall model and for males, indicating an inverse relationship
with employment, contrary to the hypothesis. However, the point estimates of these
measures were greater than one for females and the estimate for working friends was
noticeably higher than that for working relatives. Similar results on differences between
friends and relatives have been found in other studies. For example, analyses of data from
the Labor Market Entry Survey in South Africa in 2010 found friends were identified as
the contact for finding work much more often than a household family member, 34% vs.
13% respectively.11 Further, analyses of data from the 1999 October Household Survey
discovered having an employed household member actually decreased a respondent’s
odds of being self-employed, which was most of the employment reported in this
sample.4 A possible explanation for these differences is the employed friends identified
by the respondents were likely working in youth-friendly industries or self-employment
and thus better able to connect the respondents to employment than working household
members who may be in more formal, and less youth-friendly, industries. Alternatively,
28
thus less pressure to seek employment. Previous analyses of these data revealed that of
the 83 respondents without a household member working, 63.85% reported their
household financial situation as poor or extremely poor. By comparison, only 31.07% of
the 103 youth with employed household members reported being poor or extremely poor,
most reported “just getting by.”
Policy Implications
Identifying predictors of youth unemployment can have important implications
for policy development in South Africa. In all, the South African government has 114
policies related to unemployment and yet youth employment has remained consistently
high for nearly a decade.1,26 From these analyses, the significant predictors of
employment were having working skills, greater life dissatisfaction, and, for males only,
receiving training. The importance of skills and training is an intuitive finding, though the
fact that 30% or 45 of South Africa’s unemployment policies are focused on skills
development and nearly 50% of the sample reported having working skills and less than
half of these were employed indicates there are other factors at play.11 Also, the positive
relationship between greater life dissatisfaction and employment is not an intuitive
finding and merits further investigation.
A 2012 report from the ILO examining youth unemployment in 46 developing
countries encountered eight common barriers to youth employment, including: slow
economic growth, low quality jobs for youth (e.g., temporary), deficient skills among
youth, inadequate job matching (e.g., employers don’t advertise available positions,
29
lack access to capital for entrepreneurship, limited youth involvement in policy
formation, and social discrimination.8 Starting in 1994, after the end of Apartheid, South
African policymakers took many positive steps to reduce some of these barriers including
improving and unifying the education system, designing and implementing a national
skills development framework, and setting quotas for youth participation in some
government interventions.16 Unfortunately, unemployment in South Africa is considered
structural. The new economy needs fewer workers with greater skills and thus there are
millions of lower-skilled unemployed. Also, due to increases in worker protections and
labor unions, wages for low-skilled workers have increased dramatically, outpacing
productivity gains and increasing market rigidity.14,25 When these factors are combined
with sluggish economic growth in South Africa youth unemployment seems nearly
intractable.
If these analyses are correct in that having working skills is the most significant
predictor of employment for youth, it seems increased focus on youth skill development
in South Africa is a good intervention as demand for low-skill workers will likely remain
low in the long-term.14,25 A 2007 meta-analysis by the World Bank on youth employment
interventions from 84 countries found skills training programs, the most common
intervention, can increase employment and be cost effective.26
However, youth skill development will not work in isolation. Employers face high
retrenchment costs, especially in a slow economy, meaning they are understandably wary
to hire youth without previous employers to verify their productivity.11 This is why the
ILO has recommended wage subsidies that incentivize employers to hire by decreasing
30
consumption demand in a slow-growing economy.8,14 In 2011, a bill was crafted in South
Africa that gave a tax break to employers for hiring youth. For the past few years this bill
has been tabled as a battle has ensued between the Treasury and trade unions who are
fearful the bill would encourage employers to fire older workers in favor of young ones.
In late October, 2013, a diluted version of the bill was passed (1.3 billion Rand tax break,
less than the original 5 billion Rand proposal) and is expected to take effect in January.
The National Union of Metalworkers of South Africa vows to strike if the bill is
implemented so the conflict is far from over but South Africa is taking a step in the right
direction.27 Unfortunately, in rural areas, the lack of formal employers who could benefit
from this tax break could minimize the bill’s impact on rural youth unemployment.
To navigate a dearth of formal employers, promoting youth entrepreneurship is a
growing trend in areas with high youth unemployment. The Entrepreneurship
Development Programme in Nigeria extols the benefits of youth entrepreneurship as:
youth will employ other youth; gain meaning; develop skills, resilience, and innovation;
provide more goods and services in communities; and be more flexible to demand in the
market.9 In the World Bank meta-analysis, entrepreneurship programs had the highest
positive impact rating, though few of these interventions were included, thereby
inhibiting generalizability to other similar interventions.26 Despite the potentially positive
results of increased youth entrepreneurship, a 2010 study of unemployment in South
Africa from the International Food Policy Research Institute says “job creation in the
formal sector is crucial to the well-being of South Africans today” because earnings are
higher in formal sectors compared to informal sectors and past experience in the formal
market decreases one’s future chances of unemployment.14
31
the success rate for youth enterprises remains low as do the wages. Also, it is not always
reasonable to expect high risk-taking among youth, who often have low access to
capital.8
Regarding how to increase skill training for South African youth, two key
issues emerge. First, what skills should youth have? The ILO recommends
demand-driven training or training that is informed by South African employers and industries.8
The Monyetla training initiative is a good current example of this. Through this initiative,
South African youth are being trained in communication technology to handle business
process service outsourcing for companies looking to decrease costs.10 The second key
issue in providing skills training to youth is how they will access it. In the sample for this
pilot, all of the youth reported no training programs available in their communities. In
rural areas especially, searching for work is capital-intensive because it necessitates travel
to use computers, attend trainings, etc. So training programs will need to ease
transportation issues and/or cost if rural youth are to participate in a meaningful way.
Conclusions
From these analyses, it seems South Africa is making good strides to reduce youth
unemployment by focusing on youth skill development.11 However, as evidenced by the
consistently high youth unemployment, the current policies are inadequate.1 The youth
employment meta-analysis from the World Bank found programs that target
disadvantaged youth are as good, if not better, than general programs.26 As youth
unemployment is highest among rural, Black, and female youth, more programs need to
32
invest extra resources into increasing access to the program for rural youth by decreasing
transportation costs and making sure their advertising reaches the youth. The World Bank
meta-analysis also found youth employment programs were made less effective by
inflexible labor markets so introducing measures, like the recent wage subsidy bill, could
incentivize more hiring by employers and stimulate demand in the economy.11,14,26
Finally, the lack of formal employers in rural areas could keep youth unemployment high
even if youth have more skills and employers have incentives to hire them. Promoting
and supporting entrepreneurship among youth could be an effective measure to decrease
youth unemployment while rural areas continue developing. However, youth
entrepreneurship provides low wages and concentrates risk in a vulnerable population
meaning it cannot be a broad or long-term solution to youth unemployment in South
Africa.8,26 In 2010, 90% of the 15-24 year olds in the world were living in developing
countries. South Africa and many other developing countries stand poised to benefit from
the youth dividend, or a large new generation of workers, if they can facilitate meaningful
33
References
1. Central Intelligence Agency. South Africa. World Factbook. 2013. Available at: https://www.cia.gov/library/publications/the-world-factbook/geos/sf.html. Accessed August 5, 2013.
2. Collinson M, Wittenberg M, Antobam K, Kahn K, Tollman S. Labour and migration in the rural sub-district of Agincourt Mpumalanga Province, South Africa, 2000-2008. In progress.
3. Lam D, Leibbrandt M, Mlatsheni C. Human capital, job search, and unemployment among young people in South Africa. In: IZA/World Bank on Employment and
Development. Cape Town; 2010. Available at:
http://www.iza.org/conference_files/worldb2010/lam_d5998.pdf.
4. Mlatsheni C, Rospabe S. Why is youth unemployment so high and unequally spread in South Africa? Development Policy Research Institute. Working paper 02/65. 2002. Available at: http://dspace.cigilibrary.org/jspui/bitstream/123456789/7553/1/Why is Youth Unemployment so High and Unequally spread in South Africa.pdf?1.
5. Pettifor A, Rees H, Kleinschmidt I, et. al. Young people’s sexual health in South Africa: HIV prevalence and sexual behaviors from a nationally representative household survey. AIDS. 2005;19:1525–34.
6. Booysen F, Summerton J. Poverty, risky sexual behavior, and vulnerability to HIV infection: Evidence from South Africa. J Heal. Popul Nutr. 2002;20(4):285–88.
7. Bärnighausen T, Hosegood V, Timaeus IM, Newell M-L. The socioeconomic
determinants of HIV incidence: Evidence from a longitudinal, population-based study in rural South Africa. AIDS. 2007;21(Suppl 7):S29–38.
8. International Labour Office. Working with youth: Addressing the youth employment challenge. Geneva, Switzerland; 2012. Available at:
http://www.ilo.org/wcmsp5/groups/public/---ed_emp/---ed_emp_msu/documents/publication/wcms_181907.pdf.
9. Awogbenle AC, Iwuamadi KC. Youth unemployment: Entrepreneurship development programme as an intervention mechanism. African J. Bus. Manag. 2010;4(6):831–835.
10. Rogan M, Diga K, Valodia I. Labour market analysis and business process services for South Africa: Poverty reduction through Information and Digital Employment Initiative; 2013. Available at: http://sds.ukzn.ac.za/files/SDS_RB1_SA_FINAL.pdf.
34
http://policyresearch.limpopo.gov.za/bitstream/handle/123456789/749/The Challenges that Young South Africans Face in Accessing Jobs.pdf?sequence=1.
12. Freeman R, Wise D. Front Matter. In: Freeman R, Wise D, eds. The Youth Labor Market Problem: Its Nature, Causes, and Consequences. Chicago: University of Chicago Press; 1982. Available at: http://www.nber.org/chapters/c7868.
13. Ardington C, Barnighausen T, Case A, Menendez A. Social protection and labour market outcomes of youth in South Africa. Southern Africa Labour and Development Research Unit; 2013. Available at: http://www.opensaldru.uct.ac.za/handle/11090/612.
14. Burns J, Edwards L, Pauw K. Wage Subsidies to Combat Unemployment and
Poverty: Assessing South Africa’s Options. International Food Policy Research Institute; 2010. Available at:
http://www.opensaldru.uct.ac.za/bitstream/handle/11090/73/2010_45.pdf?sequence=1.
15. McGrath S. Reviewing the development of South African Further Education and Training college sector ten years after the end of Apartheid. J. Vocat. Educ. Train. 2004;56:137–160.
16. Mayer MJ. Towards a youth employment strategy for South Africa. Development Bank of South Africa, Development Planning Division. Working paper 28; 2011. Available at: http://www.africaneconomicoutlook.org/fileadmin/uploads/aeo/PDF/DPD No28.pdf.
17. Burns J, Godlonton S, Keswell M. Social networks, employment and worker discouragement: Evidence from South Africa. Labour Econ. 2010;17(2):336–344.
18. Lloyd N, Leibbrandt M. New Evidence on Subjective Wellbeing and the Definition of Unemployment in South Africa. Southern Africa Labour and Development Research Unit, University of Cape Town. Working paper 94; 2013. Available at:
http://opensaldru.uct.ac.za/handle/11090/610.
19. Witte H De, Rothmann S, Jackson L. The psychological consequences of
unemployment in South Africa. South African J. Econ. Manag. Sci. 2012;15(3):235–252.
20. Collinson M, Wolff B, Tollman S, Kahn K. Trends in internal labour migration from the rural Limpopo Province, male risk behaviour, and implications for spread of
HIV/AIDS in rural South Africa. J. Ethn. Migr. Stud. 2006;32(4):633–648.
21. Bandiera O, Burgess R, Narayan C Das, et al. BRAC’s Adolescent Development Programme in Uganda and Tanzania. In: CEPR/ESF Workshop on Micro-Finance and Entrepreneurship. Oxford; 2009. Available at:
35
22. The World Bank. Urban Youth Employment Project. 2013. Available at: http://www.worldbank.org/projects/P114042/urban-youth-employment-project?lang=en&tab=overview.
23. Medical Research Center. The Gambia Unit. 2013. Available at: http://www.mrc.gm/.
24. Shefer T, Strebel A. Deconstructing the “sugar daddy”: A critical review of the constructions of men in intergenerational sexual relationships in South Africa. Gender, Ageing & Intergenerationality. 2012;26(4).
25. Banerjee A, Galiani S, Levinsohn J, McLaren Z, Woolard I. Why has unemployment risen in the New South Africa? Econ. Transit. 2008;16(4):715–740.
26. Betcherman G, Godfrey M, Puerto S, Rother F. A Review of Interventions to Support Young Workers: Findings of the Youth Employment Inventory. World Bank; 2007. Available at: http://www.youth-employment-inventory.org/downloads/1.pdf.
27. Sapa. Parliament passes youth wage subsidy bill. Mail & Guardian.
36
Acknowledgements
The Poverty Alleviation Pilot Study and this paper would not have been possible
without Dr. Audrey Pettifor, Assistant Professor in the Department of Epidemiology and
Primary Investigator for the study. Also, my advisor, Dr. Carolyn Halpern, Professor in
Maternal and Child Health and my preceptor at the Carolina Population Center, was
indispensable. Together Dr. Pettifor and Halpern mentored and informed the study, data
analyses, and completion of this paper. Drs. Halpern and Pettifor also served as the first
and second readers for this paper, respectively. A great deal of gratitude is owed to the
Carolina Population Center, which supported the Pilot Study and my time, as well as the
Department of Epidemiology for providing the technology required for this project.
None of this work would have been feasible, of course, were it not for the
partnership with the Medical Research Council/Wits Rural Public Health and Health
Transitions Research Unit at the University of Witwatersrand in South Africa. What
made this partnership work was the incredible staff. Molly Rosenberg, who served as
Project Site Co-Manager, laid an incredible foundation for the study with activities
ranging from questionnaire and sampling design to managing the IRB application.
Amanda Selin and Floidy Wafanawaka were both gifted logisticians and allies
throughout the project as was Rhian Twine who tirelessly facilitated the connections the