Virginia H. Bacon. The relative effectiveness of print and digital formats for motivational notice signage in libraries. A Master’s Paper for the M.S. in L.S. degree. April, 2011. 38 pages. Advisor: Rebecca Vargha
This study compared the relative effectiveness of print and digital formats for a
motivational notice sign in the School of Information and Library Science library of the University of North Carolina at Chapel Hill. A quasi-experiment was conducted to
determine if a digital sign placed at the unstaffed circulation desk was more effective than a print sign at getting patrons to go to the library workroom for assistance. The number of patrons who went to the workroom for assistance when the digital sign was displayed was higher than the number when the print sign was displayed. However, the difference was not found to be statistically significant. More research is needed to determine if digital signage is more effective than print signage in some contexts.
Headings:
College and university libraries Digital signs
THE RELATIVE EFFECTIVENESS OF PRINT AND DIGITAL FORMATS FOR MOTIVATIONAL NOTICE SIGNAGE IN LIBRARIES
By
Virginia H. Bacon
A Master’s paper submitted to the faculty of the School of Information and Library Science of the University of North Carolina at Chapel Hill
in partial fulfillment of the requirements for the degree of Master of Science in
Library Science.
Chapel Hill, North Carolina April 2011
Approved by
Table of Contents
I. Introduction………..2
II. Literature Review……...………4
III. Methodology………19
IV. Results……….………23
V. Discussion………..………...26
VI. Conclusion………...29
Bibliography………..30
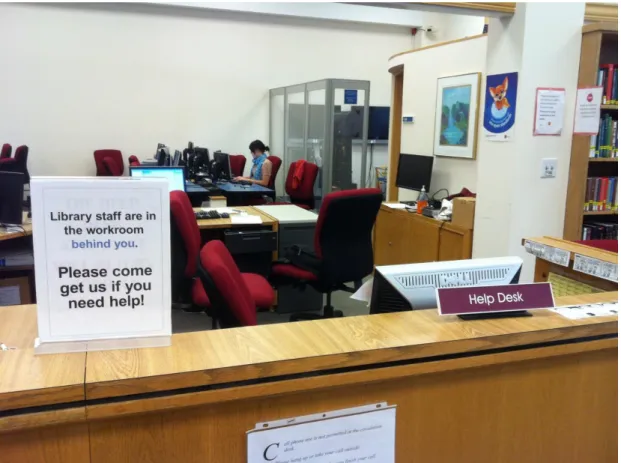
Appendix A: Print sign displayed at circulation desk………..35
I. Introduction
Libraries are well-known for being confusing, maze-like places (Downs, 1979). The frustration that library patrons experience in locating materials, services and facilities can create anxiety and a negative impression of their library experience. One way to make libraries less confusing to patrons is to implement an effective directional sign system that allows patrons to find their way around the library without difficulty or help from library staff (Spencer & Reynolds, 1977). Other kinds of library signs promote patron anxiety if they are unclear; two examples are signs about library policies or instructional signs for library equipment and systems. These kinds of signs also require good design in order for patrons to notice and understand them. In an effort to make notice signs more noticeable, some libraries have already begun replacing print notice signs with digital ones.
off of anecdotal evidence rather than formal data collection. Despite the recognition in library literature of the importance of taking user needs into consideration when
II. Literature Review
Although literature about signage is plentiful, there is no specific literature about motivational signage in the context of libraries, as the literature about digital signage is focused on signage in a marketing context. Therefore, this literature review must treat the topics of digital signage, library signage, and motivational signage separately in order to fully describe the context of this study. First, it describes what digital signage is, and how it is addressed in the marketing literature. Then, it presents the literature on best practices for signage in libraries, implementation of digital sign systems in libraries, and studies about signage and wayfinding in libraries. Finally, it describes the literature on
motivational signage in the context of automobile safety and encouraging use of staircases.
What is digital signage?
McClendon & Blackistone (1982) define a sign as “a graphic device which conveys specific information or meaning” (p.9). Following McClendon & Blackistone’s
Furthermore, they have greater functionality than print signs, with the possibility of supporting touch screen and mobile device interactions, two-way communication, and display of content from multiple information sources at once (Barclay et al., 2010; Kelsen, 2010; Lundström, 2008; Schaeffler, 2008).
While a screensaver on a library computer that reminds users about food and drink policy can be considered a digital sign, digital signage experts view such simple digital signs as virtual equivalents of traditional print signs because they do not take advantage of all that digital signage has to offer. Lundström (2008) argues that “digital signage” is not an ideal term for the type of media described because it does not convey
the vast possibilities for content and functionality of such media. Schaeffler (2008) agrees, and notes that the term is only being used because it was the first term applied by the industry, and has not since changed. Until now, digital signage has largely been a technology implemented by marketing and retail sectors, so Schaeffler further argues that non-commercial use of simple digital signs should actually be referred to as “digital displays” in order to differentiate them from more complex commercial and retail usages.
Since digital signage is the same term which has been adopted in the library world, the terms digital signs and digital signage will be used in the context of this research paper to describe even simple digital displays of information (Barclay et al., 2010; Larson & Quam, 2010).
(2008) focuses on the technology and software behind implementing a centrally
controlled and networked digital signage system. The book author envisions a system of digital signs for which content depends on the sign’s specific location, time of day, and
viewer, and which can be changed instantaneously across an entire continent. Schaeffler (2008) focuses on the business side of digital signage implementation, and how
businesses which use digital signage systems can measure their return on investment. Schaeffler and Lundström both emphasize the advantage of the flexibility and
adaptability of digital signage when compared to traditional print signage, and the costs of updating digital signage are much less than updating print signage, though the costs of maintaining a centrally managed digital signage network can be significant.
In a more recent work, Kelsen (2010) also writes about digital signage from a marketing perspective, describing digital signage as the “fifth screen” through which
advertisers can reach consumers, the other four screens being movies, television,
computers, and mobile phones. He identifies the three locations where digital signage is effective: point-of-sale, point-of transit, and point-of-wait. The primary focus of his book is about how to create the most effective digital signage content for specific contexts, as well as describing how to measure the effectiveness of signage content. Each of these works about digital signage was written by a digital signage expert with years of experience in the field, and they support their suggestions for best practice with case studies and interviews with other experts. However, they do not cite any specific
Signage in Libraries
A seminal work on library signage, Spencer & Reynolds’ (1977) Directional
signing and labeling in libraries and museums: A review of current theory and practice
provides evidence-based guidelines for the creation of sign systems for library and museum professionals who have little design experience. The authors based their guidelines on interviews with experts such as architects, designers and psychologists, examinations of in situ sign systems in over 50 different locations, as well as a survey of the relevant literature. Their research led them to suggest that libraries and museums adopt a “visually coordinated system of graphics,” a system which they found to be
lacking in most of the locations they visited for their research. They suggest that such a sign system would help create a visual identity for the library, generate confidence in library visitors, raise the morale of staff by reducing the volume of repetitive directional questions, reduce vandalism, and be cost efficient.
Spencer & Reynolds (1977) also provide the first division of signage into
functional categories: directional, orientational, identificational, mandatory, warning, and informative. They argue that the first three types of signs are the basis of directional signing systems, while the other three types of signs provide visitors with other
information that they need in order to effectively use the library. Another type of sign that they describe is the “notice,” which is “generally informative, mandatory or warning”
introducing the concept of a signage system and describing the categories of signs, the remainder of the volume is devoted to giving readers explicit guidelines and justifications for all the aspects of signage systems, including sign content, typography and layout, use of symbols and color, choice of materials, placement of signs and considerations of building use and audience. Even though they give comprehensive guidelines for the creation of signage systems, the authors recognize that much more research needs to be done in order to understand and design sign systems that are useful to library visitors and staff in different locations and contexts.
The other foundational work of library signage is Pollet and Haskell’s Sign
Systems for Libraries (1979), which brings together a collection of chapters written by different authors in an attempt to provide guidance to library professionals about creating sign systems which facilitate library patron wayfinding. The volume begins with chapters on the theory and research behind library wayfinding and the human visual system, and then follows with chapters that address the processes of creating and evaluating sign systems, give tips and guidelines for creating systems for specific categories of libraries, and discuss coordinating sign systems with other aspects of building design. In a chapter about orientation needs of library patrons, Loomis & Parsons (1979) describe orientation, or wayfinding, as a process which involves figuring out one’s location in a particular
anxiety. They additionally point out that “a priori assumptions about the relative
effectiveness of orientation aids… are apt to be inadequate without investigating the requirements for a particular space and a particular audience” (Loomis & Parsons, 1979,
p.13). Research needs to be done into the needs of users in different contexts in order to design the most effective sign systems for those contexts.
After the publication of these two major works on library signage in the late 1970s, several shorter works focused on giving very specific guidance for the creation of a sign system were published in the early 1980s. Inspired by the findings of Spencer & Reynolds (1977), Reynolds & Barrett (1981) created a guide specifically for libraries about how to design, implement and maintain a coordinated sign system. Much more visually oriented, this work condenses the findings of Spencer & Reynolds (1977) into a more accessible handbook with large numbers of illustrations to demonstrate the concepts presented in the text. In 1980, the Western Australian Institute of Technology Library created and implemented a new sign system for which a sign manual was created to guide library staff in the maintenance of the system; this manual was published as Henderson’s
(1982) Sign Manual. A similar volume, Mallery & Devore’s (1982) A Sign System for Libraries, was published after a new sign system for the Western Maryland Public Libraries was implemented. Both volumes present the different components of the newly designed systems, but do not provide design justifications or explain the decision making process involved in creating the system, and so have limited use to other library
professionals who want to create sign systems for a different context.
signage for their own libraries (Ragsdale & Kenney, 1995). A survey was distributed to 119 member libraries, and had a response rate of 67%. The survey demonstrated the variety in approaches to signage among the different libraries, and found that 60% of responding libraries did not have a sign system, sign manual or official guidelines for library signage. In addition, only 23 libraries had systematically evaluated their library signage. Along with the survey results, the SPEC Kit included signage materials
submitted by responding libraries, including two sets of institution guidelines, a signage task force report, two sign manuals, two sets of guidelines and instructions, and two sets of sign specifications.
More recent guidelines for library signage appear in sections or chapters of books about designing an entire library, and do not address designing sign systems as
Library signage is also frequently addressed in library trade journals, and articles include anecdotal case studies of particular sign system implementations as well as signage tips and suggestions from library professionals. The articles which give tips and suggestions for sign systems are divided into two categories: articles which advocate using signage to create a friendlier and more welcoming atmosphere in the library (Johnson, 2011; Schmidt, 2011; White, 2010), and articles which emphasize how improvements to signage can increase patron wayfinding success (Brandon, 2002; Johnson, 1993; Yeaman, 1989). White and Johnson (2011) discourage the user of negative wording on signage, suggesting that the number of regulatory signs should be reduced, and that remaining signs should be reworded with a positive message. Echoing the seminal works on library signage, several of these articles also encourage library professionals to consult patrons about their needs and continually evaluate their sign systems to ensure that they remain helpful to patrons (Johnson, 1993; Schmidt 2011; White 2010). Brandon reminds library professionals to anticipate the need to change signs as the collection grows and is rearranged, and to select flexible and easily modified signage.
suggests they require. Larson & Quam describe the implementation of a digital signage system at the Krueger Library of Winona State University which was created in reaction to “ubiquitous sign and media saturation” that they felt was reducing the effectiveness of print signage (p.37). They purchased flat screen TVs that were connected to the library’s
local area network which allowed them to centrally coordinate the content displayed on the screens. They used these screens to display announcements and event information. Even after implementing a digital signage system to display notices throughout the library, students still requested a place to post paper fliers, and library employees still found it necessary to use whiteboards and paper to create temporary signs notifying students of problems such as broken printers or downtime for library systems.
Barclay et al. (2010) discuss the implementation of a digital signage system at another academic library at the University of California (UC) - Merced. Librarians at UC-Merced were planning a new library, and decided to incorporate digital signage into their plans in order to increase more communication, learning, and engagement between the library and the campus community. They purchased 17 devices to run electronic
slideshows throughout the library, and attempted to keep content varied and interesting in order to sustain the attention of library patrons. Content of the slides ranged from
did not have to return to the use of print signage, and 2) received slide contributions from outside of the library. While this demonstrates that digital signage is probably an
adequate replacement for print signage, it does not necessarily demonstrate that it is more effective than print signage.
Public libraries have also begun to experiment with digital signage systems; McMorran & Reynolds (2010) provide an anecdotal account of an implementation of such a system at the New City Library in New York. Their goal in implementing a new sign system was to remove the sign clutter around service desks by replacing paper signs with a single digital picture frame that ran a slide show of different library notices. These smaller signs supplemented a new large screen over the circulation desk which was installed during a recent library remodel and displayed content that included RSS feeds, video, and dynamic web pages. Like the UC-Merced librarians, the employees of New City Library strove to create interesting and attention grabbing slides that would keep their patrons interested in the content of the displays. McMorran & Reynolds judged the new sign system to be a success; they were able to eliminate most of the paper signs used in the library, and felt that the reduction in clutter around the service desk created a more pleasant atmosphere for library patrons and staff. They also received many positive comments about the new signage from the patrons themselves.
looking for. The authors conducted a sign inventory to identify potential signage problem areas, surveyed their patrons about library signage, and unobtrusively observed patrons’ behavior. Survey data was skewed towards frequent library users, with data indicating that patrons were typically searching for library departments, materials or facilities. Students were found to have a higher success rate (90%) at finding what they were looking for than faculty (64%). In addition, more frequent library users were more successful than first time library users, who had a success rate of 64%. Library materials were the most difficult to find, with a success rate of 80%, as opposed to a success rate of 98% for finding departments and 99% for finding facilities. Finally, memory was judged to be the most helpful library finding aid, with 84% of those surveyed judging it to be helpful. Signs and labels were found to be helpful by 62% and 52% of patrons,
respectively. Patrons were also unobtrusively observed for approximately 1 hour and 45 minutes in five different sessions at five different sign locations. Observers noted whether or not patrons seemed to look at the sign, and noted any interaction patrons seemed to have with the signs. It was found that a small percentage of patrons stopped to observe the signs, with numbers for individual signs ranging between 5% and 19% of those who passed by. The authors’ findings are inconclusive, as they note that even though most
patrons were successful in their wayfinding, the sample was skewed towards frequent library users. However, they recommend that special attention be paid to signs which direct patrons to materials, and that signs be designed for flexibility because of the frequency of changes in the organization of the collection.
was motivated by a desire of IUN librarians to create a more user-friendly environment in which library patrons could easily access the library’s materials and services. The authors
surveyed library patrons about their needs and perceptions of current library signage to prove that effective signage is an important component of a user-friendly environment. The library’s signs were updated according to patron feedback, and another survey was
conducted two years later, after major updates to the library’s sign system, and results were compared with those of the first survey. There were overall gains in the average ratings of different signs, however, the gains were small, and satisfactory ratings remained prevalent. In addition, the authors did not state whether the differences were found to be statistically significant. However, the IUN librarians felt that the comments elicited from students allowed them to better understand their users’ perspectives, as well
as to focus on library signage problem areas. They concluded that using patron feedback to measure signage effectiveness was marginally successful.
In 2006, a graduate student at the School of Information and Library Science (SILS) at UNC Chapel Hill conducted an experiment which sought to determine the influence of stack end signage on user success in finding library materials, focusing on the content of the signage (Carr, 2006). She recruited 19 student volunteers from SILS classes, and each week for three weeks gave them three items to find in the Sloane Art Library. After locating the items, the participants filled out a survey about their
order to limit interference from bad sign design practices, the author followed best practice guidelines from library signage literature when creating the new stack end signs. The results of the surveys indicated that participants had less difficulty finding items during weeks 2 and 3 than during week 1, but there was no difference in participant success between weeks 2 and 3. However, no statistical analysis is given, so it is not clear if these results are statistically significant. Based off of survey comments, Carr suggests that LC call numbers are most important for known item searches, whereas subject headings are more helpful for browsing. Participant comments from the surveys also indicated ways in which the library could be better organized to improve the patron wayfinding experience.
Even though there is extensive literature on library signage, the majority consists of guidelines and suggestions for designing, implementing and maintain sign systems. Despite the recognition among library professionals that a visually coordinated system of signs is important to create a welcoming and easy-to-use library, many libraries still have not created such a system. Some libraries have begun to implement digital sign systems for notice signs, but have not attempted for formally measure the effectiveness of these new systems. The research that has been done on sign systems is focused on the
Motivational Signage
Numerous studies have shown that signage can be an effective way to encourage people to take a specific action and/or modify their behavior (Cox & Cox, 2000;
Grimstvedt et al., 2010; Kerr, Eves & Carroll, 2001). These types of signs are called motivating signage (Cox & Cox, 2000) as well as point-of-choice (Nocon,
Müller-Riemenschneider, Nitzschke, & Willich, 2010) or point-of-decision prompts (Soler et al., 2010). Such signs are specifically designed to change a behavior of interest (Soler et al., 2010).
Cox & Cox (2000) tested the effect of motivational road signs which read “Buckle up, stay safe” on the seat belt use of drivers exiting senior communities. They
observed 2 sets of 25 drivers leaving 5 different locations before putting up the new signs at stop sign intersections to get a baseline of seat belt use. They then observed 25 drivers leaving each of the locations one week after signs were posted and six months after signs were posted. They found that after signs were posted, drivers who left the stop buckled increased from an average of 68% and 72% to 94%, and 86% of those who arrived at the stop sign unbuckled left buckled. Six months after the signs were installed, 88% of drivers were leaving the intersection with their seat belt buckled. The increases in safety belt buckling were found to be statistically significant. The authors suggest further research into variations of sign content and sign location in order to better understand these factors’ relationship to sign effectiveness.
Motivational signage has also been studied extensively in the public health
of elevators or escalators. Two recent reviews of such studies concluded that point-of-decision signage is an effective way to increase stair use in public places such as transport stations, shopping malls and office buildings (Nocon et al., 2010; Soler et al., 2010). Nocon et al. concluded that a “one size fits all” approach is not effective when
designing and implementing point-of-choice motivational signage. Instead, it is necessary to consider the audience and setting of the signs when they are designed. Soler et al. point out that the increase in stair usage caused by motivational signage is modest, but they and Nocon et al. both recommend the use of signage to encourage people to use stairs instead of elevators and escalators.
A common theme found in all of the signage literature, whether digital, motivational or library signage, is the importance of understanding the audience and context for each sign system. There are many guidelines and recommendations available to those who wish to improve their signage systems, however there is little research available to support these guidelines in a library context. Additionally, there has been no formal research on digital signage in libraries, nor on library notice signage or
III. Methodology
The research objective of this study was to test the relative effectiveness of print and digital motivational notice signage. In order to test the effectiveness of these sign formats, a quasi-experiment was conducted between alternating print and digital signs at the circulation desk of the School of Information and Library Science (SILS) Library at the University of North Carolina at Chapel Hill. The SILS Library primarily serves the students, faculty and staff of SILS, but is also frequently used by students from the School of Education and the English department, as well as students across campus plus members of the UNC Chapel Hill community. The circulation desk is located in the main reading room of the library, and its staff is responsible for checking books in and out, answering directional and simple reference questions, and otherwise assisting library patrons. The SILS computer lab is located in the same space as the library reading room, with the lab help desk facing in the opposite direction of the circulation desk into the computer lab, but sharing behind-the-desk space with the circulation desk.
use of a motivational notice sign at the library circulation desk provided an opportunity to compare the effectiveness of print and digital versions of a motivational sign.
In order evaluate the effectiveness of each type of sign, a comparison of the number of people that each type of sign persuaded to behave in a certain way was
initiated in the context of the SILS Library. Specifically, this means counting the number of patrons who ask for help from staff in the library workroom after seeing the sign at the circulation desk. For the purposes of this study, time limitations made it unfeasible to confirm with each patron who asked for help whether or not they actually saw and were persuaded by the displayed sign. Instead, each patron who asked for help from staff in the workroom was counted, with a few exceptions which are described below. It is assumed that for each sign, about the same number of patrons went to the workroom to ask for help without seeing it first.
used to keeping track of the number of patrons coming to the workroom for assistance, as well as to clear up any questions about what should be tallied and what should not.
The decision was made that the LTA would count any faculty, students or campus workmen who came to the workroom for assistance, as they were likely to have seen the sign at the circulation desk. She was not to count SILS office staff, as they routinely came to the workroom to ask for assistance, and usually bypassed the circulation desk
altogether. She also did not count SILS computer lab staff whom patrons had asked for library-related assistance when the circulation desk was unstaffed. Data were collected Monday through Friday, with each day split into two equal time periods, 8:00 a.m. to 12:00 p.m. and 12:00 p.m. to 4:00 p.m. Data were not collected on weekends or during the evenings because the LTA does not work during those hours, and because there are fewer people who visit the library during these times. The average number of patrons who visited the library each day, Monday through Friday, during the weeks that data was collected was 323; however, this number includes patrons who visited the library during evening hours when data was not collected. Other library staff knew that the study was taking place, and were asked to record a tally mark if they were in the work room when a patron asked for assistance and the LTA was not here. No data was collected this way.
Starting the second week, the circulation desk staff alternated a print sign and a digital sign when they left the desk unstaffed. During the first four hour time period, one sign was used, and then would be switched for the other sign during the second four hours. The next day, the order that the signs were displayed in were switched. Alternating the signs this way ensured that each sign was used equally during mornings and
evening and on weekends, individual employees chose which sign to display, so there was no consistent pattern of sign use during these hours.
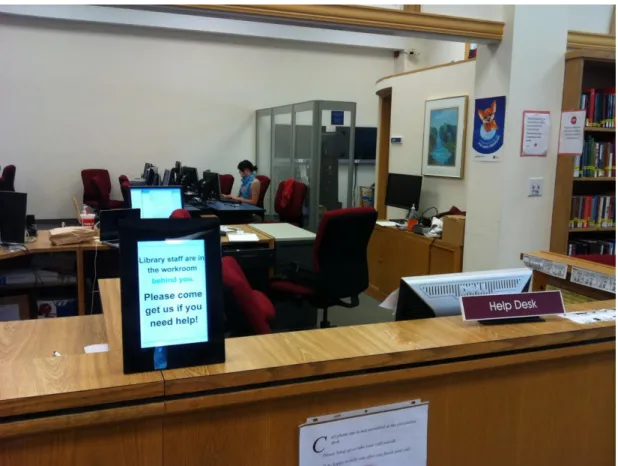
In order to reduce the number of variables affecting the effectiveness of the signs, the digital sign was made to appear as similar to the print sign as possible. The print sign was printed on a standard 8.5” by 11” sheet of paper in black and blue ink and stands horizontally in a clear plastic frame. The digital sign is displayed in a 6.5” by 10” Sony
digital picture frame, with a solid black border and a display size of 4.5” by 7”. The digital file used to create the print sign was displayed on the screen of the digital sign.1 The digital sign was created for the purposes of this study, but the print sign was already in use by SILS staff.
After the completion of data collection, the data were compiled in an Excel
spreadsheet, and a t test for independent means was applied to evaluate significance at the .05 level. A second t test was applied to the data after removing outliers that occurred during exceptional circumstances at the library. One sign is considered more effective than the other if significantly more patrons go to the workroom to ask for assistance when it is being displayed than when the other is being displayed. It was expected that the digital sign would be more effective than the print sign in motivating patrons to go to the workroom for assistance. An analysis of the data as it was compiled in the Excel
spreadsheet follows in the next section.
1
IV. Results
The data collected, as shown in Table 1, indicates that the mean number of people who asked for assistance from staff in the workroom when the print sign was displayed was 1.65. The mean number of people for the digital sign was 2.05, a 25% increase from the print sign. However, the first t test applied to the data resulted in a p value of .543, which is much higher than the .05 value needed to indicate a significant difference between the two signs.
Table 1
Number of patrons seeking assistance in workroom by day and sign type
Day 1 2 3 4 5 6 7 8 9 10 11 12 13 14 15 16 17 18 19 20 Mean
Print 3 0 1 0 1 0 0 1 1 2 7 0 0 1 3 0 7 3 1 2 1.65
Digital 0 1 3 0 0 4 0 4 2 8 1 2 1 3 0 3 4 1 3 1 2.05
were probably a result of the high traffic at the circulation desk caused by the cataloging midterm, and can be removed from data analysis. The outlier on day 17 occurred when a circulation desk employee was unable to work her shift, and no other employee could be found to cover the hours from 9:00 a.m. to 11:00 a.m. that day. Because there was no staff at the circulation desk for those 2 hours, any patron wanting assistance had to go to the workroom, and as a result the number of patrons asking for help from workroom staff was unusually large. This outlying number can also be removed from data analysis because of the unusual circumstances during which it occurred.
Table 2
Number of patrons seeking assistance in workroom by day and sign type, outliers removed
Day 1 2 3 4 5 6 7 8 9 10 11 12 13 14 15 16 17 18 19 20 Mean
Print 3 0 1 0 1 0 0 1 1 2 - 0 0 1 3 0 - 3 1 2 1.056
Digital 0 1 3 0 0 4 0 4 2 - 1 2 1 3 0 3 4 1 3 1 1.737
V. Discussion
The purpose of this study was to determine if a digital sign was more effective than a print sign in the context of a motivational notice sign in a library. Although library literature has long emphasized the importance of researching the effectiveness of
different signs in different contexts, there is still a paucity of formal research on library signage. Digital signage is becoming more and more common in libraries; this study determined if digital signage was more effective than traditional print signage in order to inform library professionals who might be considering incorporating digital signage into their libraries’ sign systems. Digital signage was expected to be more effective than print
signage because of its higher visibility as compared to print signage.
The primary limitation of this study was the small sample size; with a larger sample size, it would have been clearer whether a difference really existed between the print and digital signs. Another limitation is that this study does not provide any evidence about why one sign might be more effective than the other. Did more people notice the digital sign because it inherently more attention-grabbing, or did they notice it because of the novelty of digital signage? Is visibility of the sign the most important variable in getting more patrons to go the workroom for assistance, or are there other factors
involved in motivating patrons to do what the sign suggests? Other factors, such as daily variability in patron traffic and the amount of time circulation desk staff are away from the desk may have skewed the results. Additionally, people who saw the sign at the circulation desk and who wanted to go to the workroom for assistance may not have been able to locate the workroom, which also could have affected the results of the study. This study is also only relevant to a small category of signs, motivational signage. While such motivating signs fall into the sign category of notices, notices are so variable in content and purpose that it is hard to draw any broader conclusions about them as a whole. Effective signage is also essential to successful library wayfinding, and this study does not address the effectiveness of digital signs in a wayfinding context.
the transition to digital signage is worth the costs of equipment and installation. It would also be useful to examine whether the best practice guidelines for print signage apply to comparable digital signage, or if digital signage requires different color schemes, content, typography, and so on. Studies should also investigate the use of digital signage for directional and locational signs. For example, it might be possible to create networked stack end signage that could be updated from a central location every whenever shifting or rearrangement of the collection takes place, greatly reducing the time it takes for library employees to update print signage manually. Finally, it is important to explore users’ perceptions of print and digital signage in order to create a library environment
VI. Conclusion
There has been a sparse amount of formal research on library signage, and none which compares print and digital signage, so library professionals have little evidence on which to base the creation or modification of sign systems. The objective of this study was to determine the relative effectiveness of print and digital signs in the context of a motivational notice in a library. A print and a digital sign indicating that patrons should ask for help in the library workroom were alternated at the circulation desk of the SILS library whenever it was unstaffed. The number of patrons who went to the workroom for assistance were counted and compared. Though the number of patrons was greater when the digital sign was displayed, the difference was not significant. However, another study with a larger sample size may yield significant results. Future research on library signage, both print and digital, needs to be done in many different contexts so that library
References
Barclay, D. A., Bustos, T., & Smith, T. (2010). Signs of success: Digital signage in the library. College & Research Libraries News, 71(6), 299-302.
Bosman, E., & Rusinek, C. (1997). Creating the user-friendly library by evaluating patron perception of signage. RSR: Reference Services Review, 25(1), 71-82.
Brandon, K. C. (2002). Wayfinding in libraries. PNLA Quarterly, 66(4), 7-8.
Brown, C. R. (2002). Interior design for libraries: Drawing on function & appeal. Chicago: American Library Association.
Bryan, C. (2007). Managing facilities for results: Optimizing space for services. Chicago: American Library Association.
Carr, A. R. (2006). An experiment with art library users, signs, and wayfinding. (Unpublished master’s paper). University of North Carolina at Chapel Hill,
Chapel Hill, NC.
Cox, B. S., & Cox, A. B. (2000). Motivating signage prompts safety belt use among drivers exiting senior communities. Journal of Applied Behavior Analysis, 33(4), 635.
Eaton, G., Vocino, M., & Taylor, M. (1993). Evaluating signs in a university library. Collection Management, 16(3), 81-101.
Grimstvedt, M. E., Kerr, J., Oswalt, S. B., Fogt, D. L., Vargas-Tonsing, T., & Yin, Z. (2010). Using signage to promote stair use on a university campus in hidden and visible stairwells. Journal of Physical Activity & Health, 7(2), 232-238.
Henderson, J. (1982). Sign manual. Bentley, W.A: Western Australian Institute of Technology.
Johnson, C. R. (1993). Signs of the times: Signage in the library. Wilson Library Bulletin, 68, 40-42.
Johnson, D. (2011). Signs of a welcoming library. Library Media Connection, 29(5), 106.
Kelsen, K. (2010). Unleashing the power of digital signage: Content strategies for the 5th screen. Amsterdam; Boston: Focal Press.
Kerr, J., Eves, F. F., & Carroll, D. (2001). The influence of poster prompts on stair use: The effects of setting, poster size and content. British Journal of Health Psychology, 6(4), 397.
Loomis, R. J., & Parsons, M. B., (1979) Orientation Needs and the Library Setting. In D. Pollett, & P.C. Haskell, (Eds.), Sign systems for libraries: Solving the wayfinding problem. New York: Bowker.
Lundström, L. (2008). Digital signage broadcasting: Content management and distribution techniques. Amsterdam; Boston: Focal Press.
Mallery, M. S., & Devore, R. E. (1982). A sign system for libraries. Chicago: American Library Association.
Mandel, L. H. (2010). Toward an understanding of library patron wayfinding: Observing patrons' entry routes in a public library. Library & Information Science Research, 32(2), 116-130.
McLendon, C. B., & Blackistone, M. (1982). Signage: Graphic communications in the built world. New York: McGraw-Hill.
McMorran, C., & Reynolds, V. (2010). Sign-a-palooza. Computers in Libraries, 30(8), 6-9, 47.
Murphy, T. (2007). Library furnishings: A planning guide. Jefferson, N.C.: McFarland & Co.
Pollett, D., & Haskell, P. C. (Eds.). (1979). Sign systems for libraries: Solving the wayfinding problem. New York: Bowker.
Ragsdale, K.W., & Kenney, D. J. (1995). Effective library signage: A SPEC kit. Washington, DC: Association of Research Libraries, Office of Management Services.
Reynolds, L., & Barrett, S. (1981) Signs and guiding for libraries. London: Bingley.
Schaeffler, J. (2008). Digital signage: Software, networks, advertising, and displays: A primer for understanding the business. Amsterdam; Boston: Focal Press.
Schmidt, A. (2011). Signs of good design. Library Journal (1976), 136(2), 17.
Soler, R. E., Leeks, K. D., Buchanan, L. R., Brownson, R. C., Heath, G. W., & Hopkins, D. H. (2010). Point-of-decision prompts to increase stair use: A systematic review update. American Journal of Preventive Medicine, 38(2, Supplement 1), S292-S300.
Spencer, H., & Reynolds, L. (1977). Directional signing and labelling in libraries and museums: A review of current theory and practice. London: Readability of Print Research Unit, Royal College of Art.
White, L. L. (2010). Better none than bad. American Libraries, 41(8), 23.
Appendix A
Appendix B