Journal of Industrial and Systems Engineering
Vol. 8, No. 2, pp 30-53
Spring 2015
An Improved DPSO Algorithm for Cell Formation Problem
Ashkan Hafezalkotob
1*, Maryam Amiri Tehranizadeh
2, FatemehSarani Rad
3,
Mohammad Kazem Sayadi
41,,4 Industrial Engineering College, Islamic Azad University, South Tehran Branch, Tehran, Iran
[email protected], [email protected]
2,3 Department of Decision Science and Knowledge Engineering, University of Economic Sciences, Tehran, Iran
[email protected], [email protected]
Abstract
Cellular manufacturing systems have been considered as an effective method to increase productivity in industries. For designing of cellular manufacturing systems, several mathematical models and various algorithms have been proposed in the literature. In the present article, we propose an improved version of discrete particle swarm optimization (PSO) to solve manufacturing effectively this problem. When a local optimal solution is reached with PSO, all particles gather around it, and escaping from this local optimum becomes more difficult. To avoid premature convergence of PSO, we present a new hybrid evolutionary algorithm, called discrete particle swarm optimization-simulated annealing (DPSO-SA), based on the idea that PSO ensures fast convergence, while SA brings search out of local optimum. To illustrate the behavior of the proposed model and verify the performance of the algorithm, some numerical examples are introduced. The performance evaluation shows the effectiveness of the DPSO-SA.
Keywords: Particle swarm optimization, simulated annealing, cellular manufacturing problem, meta-heuristic algorithms.
1*Corresponding Author
ISSN: 1735-8272, Copyright c 2015 JISE. All rights reserved
1 - Introduction
Cellular manufacturing (CM) utilizes the principle of group technology (GT) to decompose a production system into a couple of independent and manageable manufacturing cells. GT is a manufacturing philosophy that has established the potential to contribute positively in batch-type production. The primary aim of the GT is to combine the flexibility of the job production system with the high productivity of the
flow production system. In the GT, parts with the same manufacturing processes are grouped together and are produced in the same manufacturing cell. To reduce the number of inter-cell movements, most of the machines required for a part family are also allocated together to form a manufacturing cell , or also called a machine cell (Shunk,1985; Shafer and Meredith,1990).
The first step in the design of cellular manufacturing systems is cell formation (CF). The primary goal of cell formation is to form independent part families and machine cells to minimize exceptional elements or inter-cellular movements.
The cell formation problem (CFP) has been widely studied in the past decades. The CFP is known as NP-hard (Burbidge, 1989), (Dimopoulos& Zalzala, 2000). This type of problem has a significant computational complexity. Therefore, achieving optimal solution is not possible in large size problems with reasonable amount of time. There are several approaches to find approximate solutions for NP-hard problems through a polynomial time. The meta-heuristic methods have been widely applied to solve the optimization problems of this kind. For example, popular methods such as simulated annealing (Pailla, et al. 2010), genetic algorithms (Zhao and Wu, 2000), ant colony optimization (Li et al., 2010), scatter search (Tavakkoli-Moghaddam et al., 2010), tabu search (Sun et al., 1995; Aljaber, et al.1997) and particle swarm optimization (Kao & Lin, 2012) have been widely used.
Considering computational complexity of the CFP, the purpose of this paper is to provide a hybrid meta-heuristic that finds best solution in the real world problems and convergence faster than other existing approaches. Our proposed methodology combines PSO and SA approaches to take advantage of the capabilities of both. In this paper, the high efficiency of our method is tested on a large number of common examples.
The paper is organized as follows. The relevant literature is reviewed in Section 2. Section 3 consists of a discussion of the problem and its notations. Section 4 formulates our methodology as a DPSO-SA. Section 5 presents some computational results and their sensitivity analysis in order to draw some meaningful managerial insights. The paper concludes in Section 6 with some directions for the future research in this context.
2 - Literature review
There are many works for solving CFP in the literature. Kusiak (1987) proposed a p-median model to solve the problem. A mathematical model for solving Group Cell Formation Problem (GCFP) was presented by Sankaran and Ksilngam (1990). Hwang and Ree (1996) used a two stage method for solving process routing selection and part family formation. Nagi, Harhalakis and Proth (1990) proposed a heuristic algorithm for machine cell formation and routing selection. Sofianopoulou (1999) applied a two-dimensional simulated annealing algorithm to assign each part type to a particular process routing and assign each machine type to a particular machine cell sequentially. An iterative method which applies a simulated annealing algorithm to partition machines into cells and a branch-and-bound algorithm to assign one of routings to each part was used by Caux, Bruniaux and Pierreval (2000). Wu, Low and Wu (2004) showed that part assignment is the sub problem of CFP which has high computational time and applied a tabu search algorithm to solve that. Wu, Chung and Chang (2009) proposed an algorithm that is based on advantage of genetic algorithm and simulated annealing. Their algorithm explores a larger solution space and accelerates the search process. Nouri and Hong
(2013) investigate the bacteria foraging optimization (BFO) algorithm to the cell formation (CF) problem. Their paper attempt was made to solve the cell formation problem while considering cell load variations and a number of exceptional elements. Mahdavi, Teymourian, Baher and Kayvanfar (2013) present a new integrated mathematical model considering cell formation and cell layout simultaneously. The goal of their model is to group similar parts and corresponding different machines in the same cells. Machines sequence in each cell and cell positions is also specified in the system. Moreover, their proposed model considers forward and backtracking movements as well as new assumptions for distances between cells using sequence data and production volume.
Shiyas and Madhusudanan Pillai (2014) adopted GA as a mathematical model for the design of manufacturing cells which considers two conflicting objectives such as the heterogeneity of cells and the inter-cell movements. A genetic algorithm (GA) based solution methodology is developed for the model which is also solved using an optimization package.
Table1 shows some recent papers that concentrated on solving the CFP .This table compares some literature model in terms of some parameters. The parameters are considered in the following:
• Operation sequence.
• Processing times.
• Minimizing inter-cell movements.
• Costs.
• Maximum size of MPIM (Machine Part Incidence Matrix).
• Compared with other existing methodologies.
• Methodology.
In this paper, a new hybrid particle swarm optimizations, DPSO-SA, is proposed to solve CFP. To the best of our knowledge, there are very few studies using PSO to solve the CFP. Kao and Lin (2012) used PSO to partition machines into different cells. But it may be trapped into local optima if the global best and local best positions are equal to the position n of particle over a number of iterations (Niknam, 2006; Olamaei et al., 2008).To overcome this shortcoming, this paper presents a novel hybrid evolutionary optimization method based on Discrete PSO and SA, called DPSO-SA for optimally cell formation, which not only has a better response but also converges more quickly than ordinary evolutionary algorithms. Proposed algorithm uses the advantages of each algorithm to overcome the disadvantages of both algorithms. We assess and compare the performance of the DPOS-SA algorithm with the original PSO, SA and Firefly algorithms on different examples.
3 - Cell formation problem
In cell formation problem the following notations are introduced:
M
the number of machines;
P
the number of parts;
C
the number of cells (cell size);
max
Table1. Comparison studies in cell formation problem. Ref Operatio n Sequence Processin g Times Minimizin g Inter-cell Movement s Cost s Maximu m Size of
MPIM Compared with other Existing Methodologie s Methodology
Kao & Lin,2012 × × × 26×28 ×
Particle Swarm Optimizatio
n
Zhao& Wu,2000 × × × × 16×43 × Genetic
Algorithm
Li et al,2010 × 50×150 ×
Ant Colony Optimizatio
n
Tavakkoli-Moghaddam,2012 × × × × 15×13 × Scatter
Search
Tavakkoli-Moghaddam,2010 × × × × 20×15 × Scatter
Search
Sun et al,1995 × × × 15×60 × Tabu Search
Aljaber et al,1997 × × 30×40 × Tabu Search
Nouri& Hong,2013 × × × 24×40 ×
Bacteria Foraging Optimizatio
n (BFO) Algorithm
Mahdavi et al,2013 × × × 20×20 ×
Integrated Mathematica
l Model Shiyas&MadhusudananPillai,20
14 40×100 ×
Genetic Algorithm
Chu &Hayya,1991 16×43 ×
Fuzzy C-Mean Clustering
Gonçalves&Resende,2004 × 40×100 ×
Local Search Heuristic
with a Genetic Algorithm
Table1. Continued
Ref Operation
Sequence Processing Times Minimizing Inter-cell Movements Costs Maximum Size of MPIM Compared with other Existing Methodologies Methodology
Li et al,2007 × 150×300 ×
An Improved Fuzzy Clustering
Algorithm
Noktehdan et al,2010 × 37×53 ×
Grouping Genetic Algorithm (GGA), Grouping Version of Differential Evolution (GDE) Algorithm and its Hybridized Version with a Local Search
Algorithm (HGDE)
Wu et al,2009 × 40×100 ×
Hybrid Heuristic Algorithm (Boltzmann Function from Simulated Annealing and the Mutation operator from the genetic Algorithm) ij
A = a M×Pmachine-part incidence matrix (MPIM), where aij is 1 if part j requires process on machine i, otherwise 0.
Our aim is to find the best clusters for machines and parts to have the least exceptional elements. Exceptional elements (nonzero values in the off diagonal blocks) impede the formation of independent machine cells by increasing inter cells material handling. Exceptional elements are the results of bottleneck parts that require to be processed on machines assigned to two or more machine cells, or bottleneck machines that must process the parts found in two or more part families (Sayadi et al, 2013; Won, 2000). Rows and columns of MPIM are rearranged to generate part families and machine cells in such a way that exceptional elements are minimized and did not contain more than maximum number of machines per cell.
1
0
ik
if machine i cell k
y
otherwise
∈
=
1
0
jk
if part j
family k
z
otherwise
∈
=
The CFP can be formulated as follow:
1 1 1
(1
)
C M P
ij jk ik
k i j
Minimize
∑ ∑ ∑
= = =a z
−
y
, (1)Subject to
11
C ik ky
i
== ∀
∑
, (2)1
1
C jk kz
j
== ∀
∑
, (3)max 1
M ik i
y
M
k
=
≤
∀
∑
, (4)The objective function of the CFP can be express as Equation (1). The number of exceptional elements can be computed by this function. Constraint (2) ensures that each machine must be assigned to one cell. Constraint (3) indicates that each part type must be assigned to one family and constraint (4) means that each cell cannot contain more than Mmax machines (Sayadi et al, 2013).
3 - Methodology
3 - 1 Particle Swarm Optimization (PSO)
PSO is a population based optimization approach that is inspired of the behaviors in bird flocks and fishes. PSO is introduced by Kennedy and Eberhart ( 1995). Since then it has been widely used to solve a wide range of optimization problems. In a N-dimensional search space, the position and velocity of particle P are represented as the vectorsXp=
{
xp1,xp2,...,xpN}
andVp={
vp1,vp2,...,vpN}
.In the PSO, Pbestrepresents the best position of particle P and Gbestrepresent the best position that has been achieved so far by whole of population. By tracking two best values, i.e. PbestandGbest, the global optimal might be reached by this optimization technique. The change of velocity and position of each particle can be calculated with the following formulas:
1
1 ( ) 2 ( )
k k k k k k
p p p p p
V + = ×ω V + ×c rand× Pbest −X +c ×rand× Gbest −X
,
(5)
1 1
, 1, 2,...
k k k
p p p
X + =X +V + p= P
,
(6)
Wherec1 and c2are acceleration constants that control the maximum step size and pull each particle toward Pbest and Gbest positions. The inertia weight
ω
controls the impact of the previous velocity of the particle on its current one. Vpkis the velocity of particle p in iteration k, Xkpis the position of particle p in iteration k, Pbestk is the best value of fitness function that has been achieved by particle p before iteration k, Gbestk is the best value of fitness function that has been achieved so far by any particle, rand means a random variable between 0.0 to 1.0.3 - 2 Simulated Annealing (SA)
SA is a probabilistic variant of the local search method, which can escape from local optima
and finds global solution. SA is founded upon an analogy taken from thermodynamics: In order
to grow a crystal, material is heated until it reaches its molten state. Then temperature is
gradually reduced till crystal structure is formed. SA begins by generating an initial solution at
random. At initial stages, a small random change is made in the current solution
(sc). Afterwards,
the objective function value of the new solution
(sn)is calculated and compared with that of
current solution. A move is made to the new solution if it has better or if the probability function
implemented in SA has a higher value than a randomly generated number. Otherwise, a new
solution is generated and evaluated. The probability of accepting a new solution is given as
follow:
1,
( )
( )
0
( )
( )
exp(
),
n c
n c
if f s
f s
p
f s
f s
otherwise
T
−
<
=
−
−
,(7)
Parameter T in this probability is temperature index. The rate of reduction of T should be slow. Therefore, at the start of the algorithm, bad moves may be accepted, but in the end only improving moves are allowed (Bertsimas &Tsitsiklis, 1993;Kirkpatrick et al, 1983).
3 – 3 - Discrete PSO-SA method (DPSO-SA)
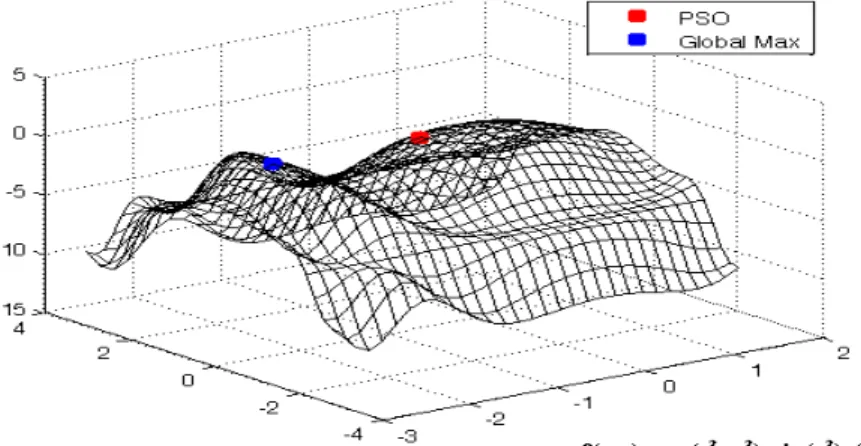
3 – 3 - 1 Why DPSO-SAAll researches proof that the particle swarm optimization (PSO) should be considered as a powerful approach, which is efficient enough to solve various kinds of nonlinear optimization problems. Nevertheless, it may be trapped into local optima if the global best and local best positions are equal to the position of particle over a number of iterations (Niknam, 2006; Olamaeiet al., 2008). PSO leads to search with high efficiency and fast convergence but while PSO finds a local optimum solution, all particles gather around it and running away from this local optima become difficult. For example, figure 1 shows a typical function that PSO trapped in local optima. PSO algorithm for this function is converged to 0.57386 while the maximum is 1.3909.
Figure 1.An example of local optima problem in PSO.
To compensate this shortcoming this article uses a hybrid evolutionary optimization method based on PSO and SA, called PSO-SA, which not only has a better response but also converges more quickly than ordinary evolutionary algorithms (Niknam et al, 2009).The basic idea is to study around the global solution by SA and to increase the information exchange among particles using a mutation operator to escape local optima.
SA is meta-heuristic method designed for finding a near optimal solution of combinatorial optimization problems. The negative point of Meta heuristic algorithms is that they can be easily trapped
in local minima. The SA technique solves this problem by allowing bad moves based on a model of the annealing process in the physical world. SA can escapes from local optima and find global solution. DPSO-SA algorithm combines the advantages of both PSO and SA. This hybrid approach makes full use of the exploration ability of PSO and the exploitation ability of SA, so the hybrid algorithm is capable of escaping from a local optimum.
3 – 3 – 2 - Proposed algorithm
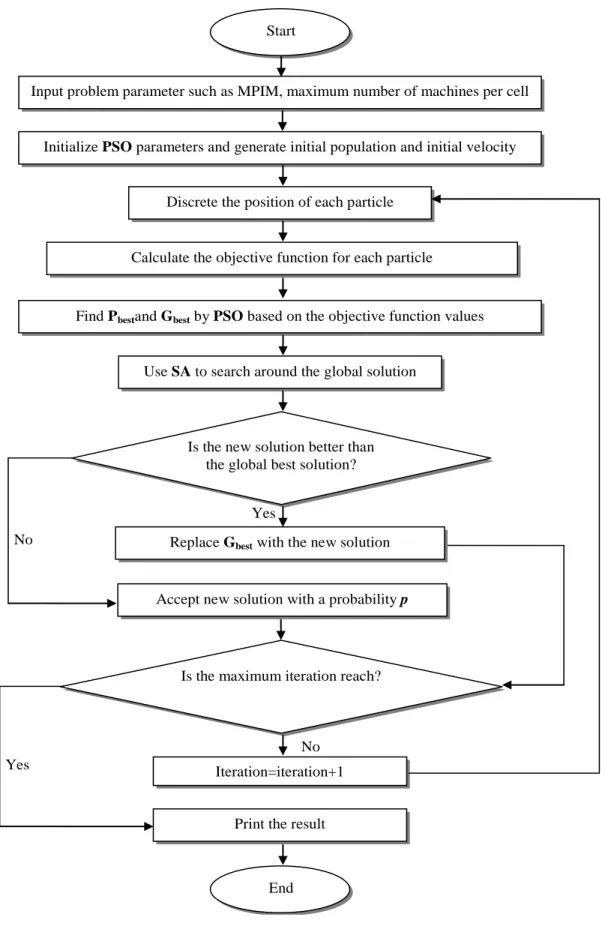
The flowchart of the proposed algorithm is shown in figure 2.To apply DPSO-SA to solve cell formation problem, the following steps have to be applied:
Step 1: Define problem’s parameters such as MPIM and maximum number of machines per cell.
Step 2: Declare PSO parameters and generate the initial population and velocity of each particle.
Step 3: In the proposed algorithm when particle i moves toward particle j the position of particle i changes from a binary number to a real number. So in this step of algorithm the real number of position is replaced with a binary number by using the following sigmoid function. The position value is constrained to the interval [0,1]:
1
( )
1 exp(
)
S x
x
=
+
−
(8)
WhereS x( ) denotes the probability of positionx taking 1.
Step 4: Calculate objective function for each particle based on equation 1.
Step 5: Find Pbestand Gbestby PSO based on objective function values.
Step 6: After calculation of Gbest for all the particles of generation, SA algorithm is applied and a series of particles in the neighborhood of Gbestare generated.
Step 7: If the value of objective function for new particles is better than the objective function of
best
G continue otherwise go to step 9.
Step 8: Gbest is replaced with the new solution.
Step 9: new solution is accepted using the probability function of SA algorithm. As it was mentioned previously, the random movements of this algorithm lead to resolving the problem of local minimum.
Step 10: If the maximum number of iteration is reached, go to step 12 otherwise go to step 11.
Step 11: Increase the iteration number, go to step 3.
Step 12: Get the result.
Step 13
: End.
By determining the machine cells partition, each part is assigned to a family/cell that contains the majority of the required machines. By using this approach, exceptional elements will be minimized [33].The position for the i−th particle in the t−th generation can be defined as
11 12
( , ,..., )
t t t t
i i i imc
Y = y y y .
1 if machine of particle is placed in the cell at generation
0 otherwise
t ijk
j i k th t th
y =
− −
By moving any particle toward the better solution, its position changes from binary number to a real number. This real number shall be converted to the changes of probabilities by the following sigmoid function:
1
( )
1 exp( )
ijk ijk S y y = + −
Where
S y( ijk)represents the probability of
yijktaking the value 1.
Figure 2.The Flowchart of proposed algorithm. Calculate the objective function for each particle
Find Pbestand Gbest by PSO based on the objective function values
Input problem parameter such as MPIM, maximum number of machines per cell
Initialize PSO parameters and generate initial population and initial velocity
Use SA to search around the global solution
Replace Gbest with the new solution
Is the new solution better than the global best solution?
Print the result
Is the maximum iteration reach? Discrete the position of each particle
Iteration=iteration+1 Start
End Yes No
No Yes
4 - Computational experiments
To illustrate the efficiency of the proposed algorithm, it is applied to four MPIM matrices and best cell arrangements for each example are obtained. Table A.1 shows the first example that is taken from (Nair & Narendran, 1998). The size of this matrice is 20*8 and the maximum number of machines in each cell is Mmax=4. The size of second example’s matrice is 20*20 and the maximum number of machines in
each cell is Mmax=5. This example is illustrated in Table A.2 (Nair & Narendran, 1998). Example No 3 is
demonstrated in Table A.3 (Albadawi et al, 2005). The MPIM’s size in this example is 10*15 and Mmax=4.The MPIM matrice of fourth example is illustrated in Table A.4, this matrice is taken from
(Albadawi et al, 2005). The size of this example is 7*5, maximum machine in each cell in this example is Mmax=4.TablesA.5, A.6, A.7 and A.8 shows the results obtained by applying DPSO-SA to the examples.
The proposed algorithm for the first example leads to 8 exceptional elements that equals to the exceptional elements obtained by (Sayadi et al, 2010). Our results is better than minimum exceptional elements obtained by (Nair & Narendran, 1998) and (Boulif&Atif, 2006). The exceptional elements calculated from second example in our algorithm are 15 and are better than the results obtained by (Sayadi et al, 2010) and also by (Nair &Narendran, 1998). The exceptional elements found in these papers are 16 and 18. DPSO-SA leads to 0 exceptional elements for third example that is equal to those obtained by (Albadawi et al, 2005). Finaly for the last example, exceptional elements by proposed algorithm are 2 that equals to the exceptional elements obtained by (Albadawi et.al, 2005). In Table 2 all results are compared with the best results obtained by PSO and SA algorithms. Also run times are reported (in seconds).
As shown in Table 2 our algorithm (DPSO-SA) leads to fewer exceptional elements compared to two other algorithms (PSO and SA) in all examples. By comparing the results of the PSO algorithm and the proposed algorithm it could be seen that the PSO is converged to local minima and proposed algorithm has better result in terms of exceptional elements and CPU time, so the mentioned reasons show that the proposed algorithm can be mentioned as good as previous methods.
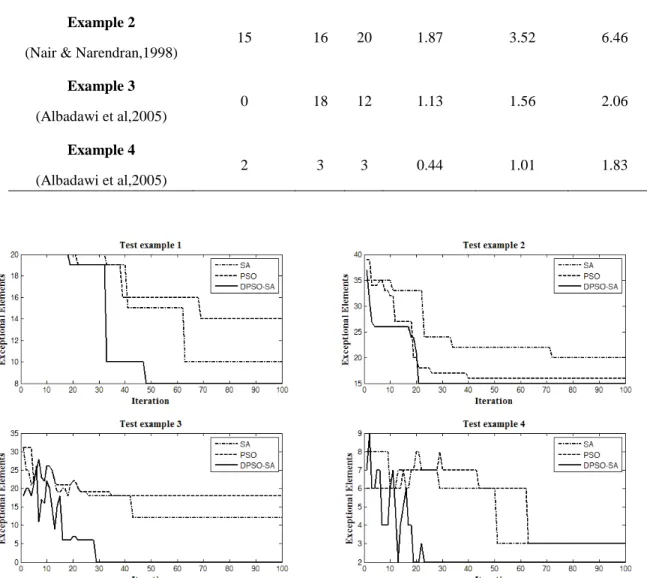
Figures 3 illustrates the progress of convergence of PSO, SA and DPSO-SA algorithms on test examples. It can be seen obviously that the use of proposed algorithm (DPSO-SA) can effectively avoid to local minima in the test examples. Moreover, by looking at Figures 3 it can be seen that DPSO-SA requires fewer iteration numbers than PSO and SA to obtain the best solutions for our examples.
Table 2. Computational results obtained by DPSO-SA, PSO and SA
(DPSO-SA) PSO SA
DPSO-SA
Time (Sec)
PSO
Time (Sec)
SA
Time (Sec)
Example 1
(Nair & Narendran,1998)
8 14 10 2.31 2.50 2.45
Example 2
(Nair & Narendran,1998)
15 16 20 1.87 3.52 6.46
Example 3
(Albadawi et al,2005)
0 18 12 1.13 1.56 2.06
Example 4
(Albadawi et al,2005)
2 3 3 0.44 1.01 1.83
Figure 3.Comparison between algorithms on test examples.
5 - Evaluation of performance
To evaluate the performance of the proposed algorithms, three mostly used criteria in the literature for CFP are selected. These criteria are the percentage of exceptional elements, machine utilization, and group efficiency (Albadawi et al, 2005; Hachichaet al, 2008).
5 – 1 - Percentage of Exceptional Elements
The first criterion is percentage of exceptional elements (PE) and is the ratio of the number
of exceptional elements to the total number of unity elements in entry matrice. This measure is
normalized with respect to the problem size (Albadawi et al, 2005; Hachichaet al, 2008).
100
number of exceptional elements
PE
total number of operations
=
×
,
(10)
5.2 Machine Utilization
The next criterion is Machine Utilization (MU) that indicates the percentage of time the
machines within the cluster are used in production:
1 C k k k N MU m p = =
∑
,
(11)
Where N is the total number of one numbers within the part family-machine cells, Q is the number of cells, where mk and pk denote, respectively, the number of machines in cell k and number of parts in
family k. generally the higher value of MU shows the better machine utilization (Albadawi et al, 2005; Hachichaet al, 2008).
5 – 3 - Grouping efficiency
The third criterion is Grouping Efficiency (GE) and is defined as:
1 1
(1 ) 1
C C
k k k k
k k
N NE
GE
m p MN m p
α
α
= = = + − − − ∑
∑
,
(12)
The weight α is assigned to reveal the relative importance of each term, though a value of 0.5 is commonly used. MN is the size of MPIM and NE is the number of exceptional elements (Albadawi et al, 2005; Hachichaet al, 2008).
Unfortunately, due to the lack of data about p, m in the previous work we can’t evaluate the MU and GE on test examples.
6 - Computational results
For validation of the proposed approach, two examples from the literature with different size are solved by DPSO-SA. Table 3 shows the examples with their parameters and the results obtained by the proposed algorithm. The problem size (number of parts
and number of
machines), the number of cells,the maximum number of machines in each cell are listed in table 3. It can be clearly seen that for both examples our method leads to exceptional elements lower than the best result in the literature. Particularly the best solution for example No1 in the literature is 8 and for example No2 is 51, while DPSO-SA obtained 7 exceptional elements for example No1 and 50 for example No 2.
Table 3. Examples used for tests and obtained results
Part/Machine Reference
Number of Part
Number of Machine
Number of Cells
MaximumNum. Machine in Cell
Our Algorithm Exceptional
Elements
Literature Exceptional
Elements
1
(Yang & Yang,2008;Sayadi
et al,2010)
15 15 4 5 7 8
2
(Yang & Yang,2008)
35 28 6 6 50 51
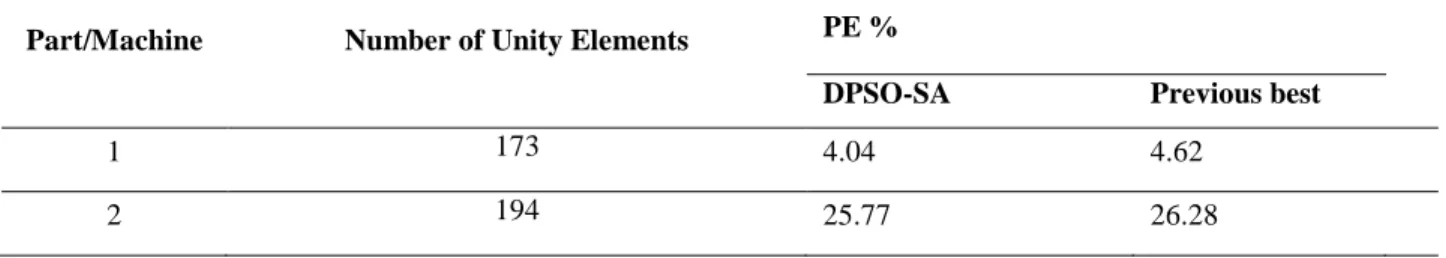
To evaluate the obtained results of proposed algorithm on pervious example, PE criterion is used. The evaluation results based on PE criterion are shown in Table 4. Better formation result in a smaller PE. According to the Table 4 it can be concluded that the proposed DPSO-SA algorithm improves the PE criterion in both example. The results of this table show the effectiveness of the proposed algorithm.
Table 4. Evaluation results based on PE
Part/Machine Number of Unity Elements PE %
DPSO-SA Previous best
1 173 4.04 4.62
7 - Conclusion
In this paper, DPSO-SA algorithm is introduced for solving cell formation problems. The proposed algorithm contribute some functions of SA and PSO algorithm in such a way that it share speedy nature of SA algorithm and optimization of PSO algorithm simultaneously, so that the new algorithm will result on optimum answer in speedy way and do not hang out on local optimum point.
The obtained results from test examples show that DPSO-SA performs better than previous algorithms and can find global optima. Compared to previous algorithms, it seems that the new algorithm would cause to lowest exceptional elements on several cases which resulted in functional improvement at each cell and system. Although this paper focuses on the minimization of exceptional elements and best formation solution only, it can adapt to more realistic manufacturing parameters such as setup cost, sequence and alternative routings. Future works may be carried out to develop efficient formulations to handle such parameters.
References
Albadawi, Z., Bashir, H. A., & Chen, M. (2005).A mathematical approach for the formation of manufacturing cells. Computers & Industrial Engineering,48(1), 3-21.
Aljaber, N., Baek, W., & Chen, C. L. (1997).A tabu search approach to the cell formation problem. Computers & industrial engineering, 32(1), 169-185.
Banks, A., Vincent, J., &Anyakoha, C. (2008).A review of particle swarm optimization. Part II: hybridisation, combinatorial, multicriteria and constrained optimization, and indicative applications. Natural Computing, 7(1), 109-124.
Bertsimas, D., &Tsitsiklis, J. (1993).Simulated annealing. Statistical science,8(1), 10-15.
Boulif, M., &Atif, K. (2006).A new branch-&-bound-enhanced genetic algorithm for the manufacturing cell formation problem. Computers & operations research,33(8), 2219-2245.
Caux, C., Bruniaux, R., &Pierreval, H. (2000). Cell formation with alternative process plans and machine capacity constraints: A new combined approach. International Journal of Production Economics, 64(1), 279-284.
Chu, C. H., &Hayya, J. C. (1991).A fuzzy clustering approach to manufacturing cell formation. The international journal of production research, 29(7), 1475-1487.
Dimopoulos, C., &Zalzala, A. M. (2000). Recent developments in evolutionary computation for manufacturing optimization: problems, solutions, and comparisons. Evolutionary Computation, IEEE Transactions on, 4(2), 93-113.
Gonçalves, J. F., &Resende, M. G. (2004).An evolutionary algorithm for manufacturing cell formation. Computers & Industrial Engineering, 47(2), 247-273.
Hachicha, W., Masmoudi, F., &Haddar, M. (2008). Principal component analysis model for machine-part cell formation problem in group technology. arXiv preprint arXiv:0803.3343.
Hwang, H., &Ree, P. (1996).Routes selection for the cell formation problem with alternative part process plans. Computers & industrial engineering, 30(3), 423-431.
Kao, Y., & Lin, C. H. (2012).A PSO-based approach to cell formation problems with alternative process routings. International Journal of Production Research,50(15), 4075-4089.
Kennedy, J., &Eberhart, R. (1995).Particle swarm optimization.Proceeding of IEEE International Conference on Neural Networks, 4, 1942-1948.
Kirkpatrick, S., Gelatt, C. D., &Vecchi, M. P. (1983).Optimization by simmulated annealing. science, 220(4598), 671-680.
Kusiak, A. (1987). The generalized group technology concept. International journal of production research, 25(4), 561-569.
Li, J., Chu, C. H., Wang, Y., & Yan, W. (2007).An improved fuzzy clustering method for cellular manufacturing. International journal of production research,45(5), 1049-1062.
Li, X., Baki, M. F., &Aneja, Y. P. (2010).An ant colony optimization metaheuristic for machine–part cell formation problems. Computers & Operations Research, 37(12), 2071-2081.
Nagi, R., Harhalakis, G., &Proth, J. M. (1990). Multiple Routings and Capacity Consideration in Group Technology Applications. International Journal of Production Research,28, pp. 2243-2257.
Nair, G. J., &Narendran, T. T. (1998). CASE: A clustering algorithm for cell formation with sequence data. International Journal of Production Research, 36(1), 157-180.
Niknam, T. (2006, November). An approach based on particle swarm optimization for optimal operation of distribution network considering distributed generators. In IEEE Industrial Electronics, IECON 2006-32nd Annual Conference on (pp. 633-637).IEEE.
Niknam, T., Amiri, B., Olamaei, J., &Arefi, A. (2009). An efficient hybrid evolutionary optimization algorithm based on PSO and SA for clustering.Journal of Zhejiang University Science A, 10(4), 512-519.
Noktehdan, A., Karimi, B., &HusseinzadehKashan, A. (2010). A differential evolution algorithm for the manufacturing cell formation problem using group based operators. Expert Systems with Applications, 37(7), 4822-4829.
Nouri, H., & Hong, T. S. (2013). Development of bacteria foraging optimization algorithm for cell formation in cellular manufacturing system considering cell load variations. Journal of Manufacturing Systems, 32(1), 20-31.
Mahdavi, I., Teymourian, E., Baher, N. T., &Kayvanfar, V. (2013).An integrated model for solving cell formation and cell layout problem simultaneously considering new situations. Journal of Manufacturing Systems,32(4), 655-663.
Olamaei, J., Niknam, T., &Gharehpetian, G. (2008). Application of particle swarm optimization for distribution feeder reconfiguration considering distributed generators. Applied Mathematics and computation, 201(1), 575-586.
Pailla, A., Trindade, A. R., Parada, V., & Ochi, L. S. (2010). A numerical comparison between simulated annealing and evolutionary approaches to the cell formation problem. Expert Systems with Applications, 37(7), 5476-5483.
Paydar, M. M., &Sahebjamnia, N. (2009).Designing a mathematical model for cell formation problem using operation sequence. Journal of Applied Operational Research, 1(1), 30-38.
Poli, R., Kennedy, J., & Blackwell, T. (2007). Particle swarm optimization.Swarm intelligence, 1(1), 33-57.
Saeidi, S., Solimanpur, M., Mahdavi, I., &Javadian, N. (2014).A multi-objective genetic algorithm for solving cell formation problem using a fuzzy goal programming approach. The International Journal of Advanced Manufacturing Technology, 70(9-12), 1635-1652.
Sankaran, S., &Kasilngam, R. G. (1990).An integrated approach to cell formation and part routing in group technology manufacturing systems.Engineering Optimization+ A35, 16(3), 235-245.
Sayadi, M. K., Hafezalkotob, A., &Naini, S. G. J. (2013). Firefly-inspired algorithm for discrete optimization problems: An application to manufacturing cell formation. Journal of Manufacturing Systems, 32(1), 78-84.
Shafer, S. M., & Meredith, J. R. (1990).A comparison of selected manufacturing cell formation techniques. The international journal of production research, 28(4), 661-673.
Shiyas, C. R., &MadhusudananPillai, V. (2014).A mathematical programming model for manufacturing cell formation to develop multiple configurations. Journal of Manufacturing Systems, 33(1), 149-158.
Shunk, D. L. (1985). Group Technology Provides Organized Approach to Realizing Benefits of CIMS.Industrial Engineering, 17, 74-81.
Sofianopoulou, S.(1999). Manufacturing cells design with alternative process plans and/or replicate machines. International Journal of Production Research,37(3), 707-720.
Sun, D., Lin, L., &Batta, R. (1995).Cell formation using tabusearch.Computers& industrial engineering, 28(3), 485-494.
Tavakkoli-Moghaddam, R., Javadian, N., Khorrami, A., &Gholipour-Kanani, Y. (2010).Design of a scatter search method for a novel multi-criteria group scheduling problem in a cellular manufacturing system. Expert Systems with Applications, 37(3), 2661-2669.
Tavakkoli-Moghaddam, R., Ranjbar-Bourani, M., Amin, G. R., &Siadat, A. (2012).A cell formation problem considering machine utilization and alternative process routes by scatter search. Journal of Intelligent Manufacturing, 23(4), 1127-1139.
Won, Y. (2000).Two-phase approach to GT cell formation using efficient p-median formulations. International Journal of Production Research, 38(7), 1601-1613.
Wu, T. H., Chang, C. C., &Yeh, J. Y. (2009).A hybrid heuristic algorithm adopting both Boltzmann function and mutation operator for manufacturing cell formation problems. International Journal of Production Economics, 120(2), 669-688.
Wu, T. H., Chung, S. H., & Chang, C. C. (2009). Hybrid simulated annealing algorithm with mutation operator to the cell formation problem with alternative process routings. Expert Systems with Applications, 36(2), 3652-3661.
Wu, T. H., Low, C., & Wu, W. T. (2004). A tabu search approach to the cell formation problem. The International Journal of Advanced Manufacturing Technology, 23(11-12), 916-924.
Yang, M. S., & Yang, J. H. (2008). Machine-part cell formation in group technology using a modified ART1 method. European Journal of Operational Research, 188(1), 140-152.
Zhao, C., & Wu, Z. (2000).A genetic algorithm for manufacturing cell formation with multiple routes and multiple objectives. International Journal of Production Research, 38(2), 385-395.
Appendix A.
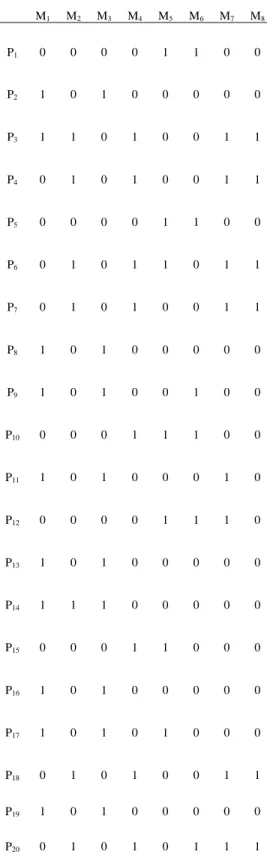
Table A.1 MPIM of first example
M1 M2 M3 M4 M5 M6 M7 M8
P1 0 0 0 0 1 1 0 0
P2 1 0 1 0 0 0 0 0
P3 1 1 0 1 0 0 1 1
P4 0 1 0 1 0 0 1 1
P5 0 0 0 0 1 1 0 0
P6 0 1 0 1 1 0 1 1
P7 0 1 0 1 0 0 1 1
P8 1 0 1 0 0 0 0 0
P9 1 0 1 0 0 1 0 0
P10 0 0 0 1 1 1 0 0
P11 1 0 1 0 0 0 1 0
P12 0 0 0 0 1 1 1 0
P13 1 0 1 0 0 0 0 0
P14 1 1 1 0 0 0 0 0
P15 0 0 0 1 1 0 0 0
P16 1 0 1 0 0 0 0 0
P17 1 0 1 0 1 0 0 0
P18 0 1 0 1 0 0 1 1
P19 1 0 1 0 0 0 0 0
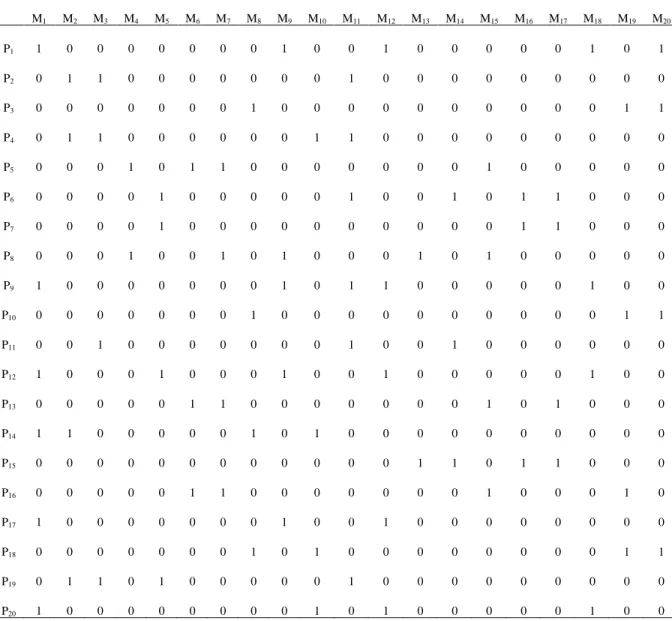
Table A.2MPIM of second example
M1 M2 M3 M4 M5 M6 M7 M8 M9 M10 M11 M12 M13 M14 M15 M16 M17 M18 M19 M20
P1 1 0 0 0 0 0 0 0 1 0 0 1 0 0 0 0 0 1 0 1
P2 0 1 1 0 0 0 0 0 0 0 1 0 0 0 0 0 0 0 0 0
P3 0 0 0 0 0 0 0 1 0 0 0 0 0 0 0 0 0 0 1 1
P4 0 1 1 0 0 0 0 0 0 1 1 0 0 0 0 0 0 0 0 0
P5 0 0 0 1 0 1 1 0 0 0 0 0 0 0 1 0 0 0 0 0
P6 0 0 0 0 1 0 0 0 0 0 1 0 0 1 0 1 1 0 0 0
P7 0 0 0 0 1 0 0 0 0 0 0 0 0 0 0 1 1 0 0 0
P8 0 0 0 1 0 0 1 0 1 0 0 0 1 0 1 0 0 0 0 0
P9 1 0 0 0 0 0 0 0 1 0 1 1 0 0 0 0 0 1 0 0
P10 0 0 0 0 0 0 0 1 0 0 0 0 0 0 0 0 0 0 1 1
P11 0 0 1 0 0 0 0 0 0 0 1 0 0 1 0 0 0 0 0 0
P12 1 0 0 0 1 0 0 0 1 0 0 1 0 0 0 0 0 1 0 0
P13 0 0 0 0 0 1 1 0 0 0 0 0 0 0 1 0 1 0 0 0
P14 1 1 0 0 0 0 0 1 0 1 0 0 0 0 0 0 0 0 0 0
P15 0 0 0 0 0 0 0 0 0 0 0 0 1 1 0 1 1 0 0 0
P16 0 0 0 0 0 1 1 0 0 0 0 0 0 0 1 0 0 0 1 0
P17 1 0 0 0 0 0 0 0 1 0 0 1 0 0 0 0 0 0 0 0
P18 0 0 0 0 0 0 0 1 0 1 0 0 0 0 0 0 0 0 1 1
P19 0 1 1 0 1 0 0 0 0 0 1 0 0 0 0 0 0 0 0 0
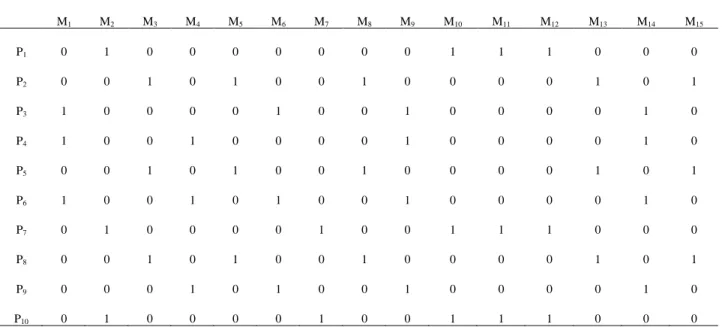
Table A.3 MPIM of third example
M1 M2 M3 M4 M5 M6 M7 M8 M9 M10 M11 M12 M13 M14 M15
P1 0 1 0 0 0 0 0 0 0 1 1 1 0 0 0
P2 0 0 1 0 1 0 0 1 0 0 0 0 1 0 1
P3 1 0 0 0 0 1 0 0 1 0 0 0 0 1 0
P4 1 0 0 1 0 0 0 0 1 0 0 0 0 1 0
P5 0 0 1 0 1 0 0 1 0 0 0 0 1 0 1
P6 1 0 0 1 0 1 0 0 1 0 0 0 0 1 0
P7 0 1 0 0 0 0 1 0 0 1 1 1 0 0 0
P8 0 0 1 0 1 0 0 1 0 0 0 0 1 0 1
P9 0 0 0 1 0 1 0 0 1 0 0 0 0 1 0
P10 0 1 0 0 0 0 1 0 0 1 1 1 0 0 0
Table A.4 MPIM of forth example
M1 M2 M3 M4 M5
P1 0 0 1 1 0
P2 1 0 1 0 0
P3 0 1 0 1 1
P4 1 0 1 0 1
P5 0 1 0 0 1
P6 0 0 0 1 1
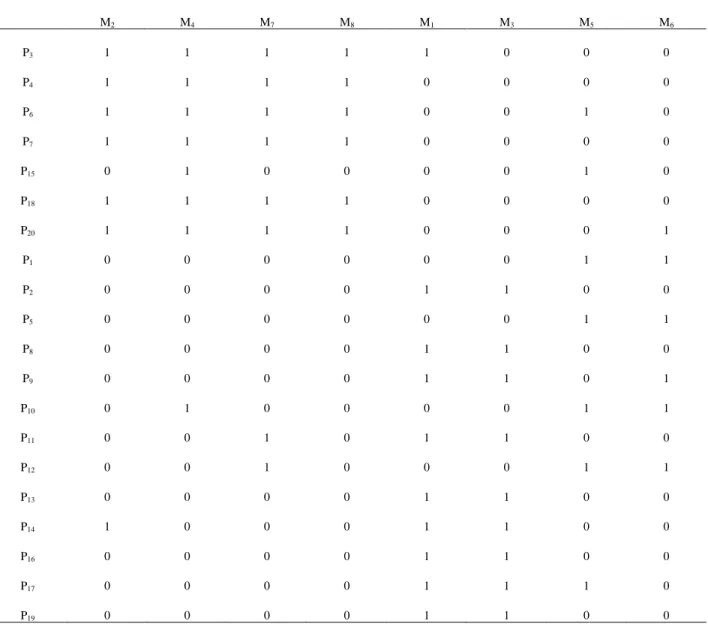
Table A.5 Obtained result by DPSO-SA (example No 1)
M2 M4 M7 M8 M1 M3 M5 M6
P3 1 1 1 1 1 0 0 0
P4 1 1 1 1 0 0 0 0
P6 1 1 1 1 0 0 1 0
P7 1 1 1 1 0 0 0 0
P15 0 1 0 0 0 0 1 0
P18 1 1 1 1 0 0 0 0
P20 1 1 1 1 0 0 0 1
P1 0 0 0 0 0 0 1 1
P2 0 0 0 0 1 1 0 0
P5 0 0 0 0 0 0 1 1
P8 0 0 0 0 1 1 0 0
P9 0 0 0 0 1 1 0 1
P10 0 1 0 0 0 0 1 1
P11 0 0 1 0 1 1 0 0
P12 0 0 1 0 0 0 1 1
P13 0 0 0 0 1 1 0 0
P14 1 0 0 0 1 1 0 0
P16 0 0 0 0 1 1 0 0
P17 0 0 0 0 1 1 1 0
Table A.6 Obtained result by DPSO-SA (example No 2)
M2 M3 M5 M11 M14 M8 M16 M17 M19 M20 M4 M6 M7 M13 M15 M1 M9 M10 M12 M18
P2 1 1 0 1 0 0 0 0 0 0 0 0 0 0 0 0 0 0 0 0
P4 1 1 0 1 0 0 0 0 0 0 0 0 0 0 0 0 0 1 0 0
P11 0 1 0 1 1 0 0 0 0 0 0 0 0 0 0 0 0 0 0 0
P19 1 1 1 1 0 0 0 0 0 0 0 0 0 0 0 0 0 0 0 0
P6 0 0 1 1 1 0 1 1 0 0 0 0 0 0 0 0 0 0 0 0
P3 0 0 0 0 0 1 0 0 1 1 0 0 0 0 0 0 0 0 0 0
P7 0 0 1 0 0 0 1 1 0 0 0 0 0 0 0 0 0 0 0 0
P10 0 0 0 0 0 1 0 0 1 1 0 0 0 0 0 0 0 0 0 0
P15 0 0 0 0 1 0 1 1 0 0 0 0 0 1 0 0 0 0 0 0
P18 0 0 0 0 0 1 0 0 1 1 0 0 0 0 0 0 0 1 0 0
P5 0 0 0 0 0 0 0 0 0 0 1 1 1 0 1 0 0 0 0 0
P8 0 0 0 0 0 0 0 0 0 0 1 0 1 1 1 0 1 0 0 0
P13 0 0 0 0 0 0 0 1 0 0 0 1 1 0 1 0 0 0 0 0
P16 0 0 0 0 0 0 0 0 1 0 0 1 1 0 1 0 0 0 0 0
P1 0 0 0 0 0 0 0 0 0 1 0 0 0 0 0 1 1 0 1 1
P9 0 0 0 1 0 0 0 0 0 0 0 0 0 0 0 1 1 0 1 1
P12 0 0 1 0 0 0 0 0 0 0 0 0 0 0 0 1 1 0 1 1
P14 1 0 0 0 0 1 0 0 0 0 0 0 0 0 0 1 0 1 0 0
P17 0 0 0 0 0 0 0 0 0 0 0 0 0 0 0 1 1 0 1 0
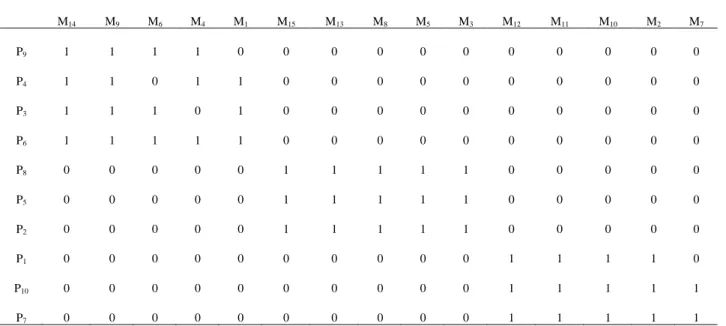
Table A.7 Obtained result by DPSO-SA (example N0 3)
M14 M9 M6 M4 M1 M15 M13 M8 M5 M3 M12 M11 M10 M2 M7
P9 1 1 1 1 0 0 0 0 0 0 0 0 0 0 0
P4 1 1 0 1 1 0 0 0 0 0 0 0 0 0 0
P3 1 1 1 0 1 0 0 0 0 0 0 0 0 0 0
P6 1 1 1 1 1 0 0 0 0 0 0 0 0 0 0
P8 0 0 0 0 0 1 1 1 1 1 0 0 0 0 0
P5 0 0 0 0 0 1 1 1 1 1 0 0 0 0 0
P2 0 0 0 0 0 1 1 1 1 1 0 0 0 0 0
P1 0 0 0 0 0 0 0 0 0 0 1 1 1 1 0
P10 0 0 0 0 0 0 0 0 0 0 1 1 1 1 1
P7 0 0 0 0 0 0 0 0 0 0 1 1 1 1 1
Table A.8 Obtained result by DPSO-SA (example No 4)
M2 M5 M4 M1 M3
P5 1 1 0 0 0
P3 1 1 1 0 0
P6 0 1 1 0 0
P7 0 0 0 1 1
P2 0 0 0 1 1
P4 0 1 0 1 1

![8H Chromeno[2′,3′:4,5]imidazo[2,1 a]isoquinoline](data:image/gif;base64,R0lGODlhAQABAIAAAP///wAAACH5BAEAAAAALAAAAAABAAEAAAICRAEAOw==)