Library System. A Master’s Paper for the M.S. in L.S degree. April, 2009. 61 pages. Advisor: Ronald Bergquist.
This paper explores the idea that Library 2.0 technologies will help libraries reach patrons deterred by distance. In library location research there is a belief that as distance
increases from the library, use decreases. The standard found in past studies indicates that most library users live within two miles of the library. Using geographic information systems to map address data of library card holders, this study collected median distance traveled by patrons and measured the populations of cardholders living near the library. The study compared the median distance to branch specific statistics to determine
possible correlations. While there was not enough evidence to support the effect of using a Library 2.0 service model on the distance patrons travel, it did find that Wake County patrons are more dispersed than the accepted tenet suggests. It found the average median distance significantly broader and populations of cardholders not as concentrated around the library.
Headings
Public Libraries – Use Studies – Distances -- United States Public services (Libraries) – United States
Libraries and community – United States User-generated content
MARKET AREA OF THE WAKE COUNTY PUBLIC LIBRARY SYSTEM
by
Siobhan C. Loendorf
A Master’s paper submitted to the faculty of the School of Information and Library Science of the University of North Carolina at Chapel Hill
in partial fulfillment of the requirements for the degree of Master of Science in
Library Science.
Chapel Hill, North Carolina April 2009
Approved by
ACKNOWLEDGEMENTS
I would like to offer my sincere thanks to the following people:
• Theresa Cummings of the Wake County libraries information technology department for the datasets used in this study.
• All of the librarians at West Regional who helped me collect statistics for the branches.
• My advisor and professor Dr. Bergquist for his support and guidance through the process of writing this paper. It was his seminar in public libraries that sparked my interest in the public library resulting in this paper.
• Amanda Henley of the GIS department at Davis library at UNC- Chapel Hill for all of her assistance in creating and manipulating the geographic information systems.
TABLE OF CONTENTS
Acknowledgements... 1
Table of Contents ... 2
List of tables... 3
List of Maps ... 4
Introduction... 5
Literature Review... 12
Methods... 14
Data Collection ... 16
Limitations of the study ... 26
Findings... 27
Implications... 29
Conclusion ... 31
References... 33
Glossary ... 36
LIST OF TABLES
Table 01: Wake County Public Libraries... 9
Table 02: Data from NC Annual Statistical Report, 2007-2008... 17
Table 03: Wake County Branch Service Statistics ... 18
Table 04: Address Matching Results 2008 dataset ... 20
Table 05: Buffer Population... 21
Table 06 Point Distance Statistics... 22
Table 07 Distribution of the distances Cameron Village Regional Library ... 23
Table 08 Median Distance to all Wake County Library System Branches ... 24
Table 09 Bivariate Correlation... 25
Table 10: Buffer Populations ... 26
LIST OF MAPS
Map 01: One mile buffer overlap... 39
MAP 02: Three mile buffer overlap ... 39
Map 03: Five mile buffer overlap ... 40
Map 04: Athens Drive Community Library Patron Distribution... 41
Map 05: Cameron Village Regional Library Patron Distribution ... 42
Map 06: Cary Branch Library Patron Distribution... 43
Map 07: Duraleigh Road Library Patron Distribution ... 44
Map 08: Electronic Information Center Patron Distribution ... 45
Map 09: East Regional Library Patron Distribution ... 46
Map 10: Eva Perry Regional Library Patron Distribution ... 47
Map 11: Fuquay-Varina Library Patron Distribution ... 48
Map 12 Green Road Library Patron Distribution ... 49
Map 13: Holly Springs Library Patron Distribution ... 50
Map 14: North Regional Library Patron Distribution... 51
Map 15: Olivia Raney Local History Library Patron Distribution ... 52
Map 16:Richard B. Harrison Library Patron Distribution ... 53
Map 17: South East Regional Library Patron Distribution... 54
Map 18: Southgate Library Patron Distribution ... 55
Map 19: Wake Forest Library Patron Distribution ... 56
Map 20: Wendell Branch Library Patron Distribution ... 57
Map 21:West Regional Library Patron Distribution... 58
INTRODUCTION
In 2004 Tim O’Reilly of O’Reilly Media sponsored a Web 2.0 conference in San Francisco where participants explored the concept of Web 2.0. Loosely defined it represents a shift in the services and applications offered on the internet. There were many criteria for a site being considered Web 2.0 such as having a search function, or links within the site, authoring or really simple syndication capabilities are just a few. Stephen Abram further defined it in saying: “Web 2.0 is about the more human aspects of interactivity. It’s about conversations, interpersonal networking, personalization, and individualism” (2006).
In another interview, Michael Casey refers to Library 2.0 in saying that “it’s about taking the time to examine all you’re doing and finding out what we can do to welcome an entirely new group of users into our wonderful libraries” (Casey, 2005). Thomas Brevik further defines the concept in saying that “Library 2.0 is the natural evolution of library services to a level where the library user is in control of how and when he/she gets access to the services he/she needs and wants” (Brevik, n.d.).
In order to better explain Library 2.0 a quick definition of Library 1.0 may be helpful. This concept was also discussed on Library Crunch where Michael Casey stated:
Library 1.0 really is whatever point you are at now. The crowds we are serving now are the crowds that we have served for some time. Using the long tail Concept, most libraries have become quite adept at serving the
users who populate the left axis – we know them well, we know their needs, and we have tailored our collections and services to meet the majority of their desires. However, as the long tail idea illustrates, as needs begin to differ and as that tail expands out to the right, the number of users and the diversity of needs grows. The reality is that the number of users who have needs that are not being met outnumbers those whose needs we are meeting. In other words, we are offering services that are not wanted by a majority of our population (2005).
technologies do provide a venue for libraries to reach out to niche markets but they represent only a fraction of what a library can do to allow its users more control over their library experience. Library 2.0 represents a new service model where the library focuses not only on the current patrons but on those that don’t typically use the library. This idea of reaching out to niche markets formerly unserved is the idea behind the economic concept known as the ‘long tail’ by Chris Anderson (2006). Library 2.0 is a service model aimed at reaching the long tail by providing a wide range of services and access points so that the library attracts those patrons who normally would not take advantage of library services.
One population that has traditionally not taken advantage of the library is the population living more than two miles from the library facility. Specifically, in the case of a suburban system it has been found that 76.7% of library patrons live within a two mile radius of the library (Palmer, 1981). A more recent distance study conducted in 2004 concurred with the 1981 findings, citing 61% of library patrons living within three miles of the library (Kinikin, 2004). Ironically, this last study was conducted about the same time that Tim O’Reilly began to talk about Web 2.0 and a year before Library 2.0 was ever mentioned. So what effect has this new service model known as Library 2.0 had on the distance people are willing to travel to the library?
distance has historically been a barrier that kept people from using the public library. In 2001 Christina Koontz compiled a summary of research regarding the effect of distance on library use. From that research she ascertained that “use of the library decreases as distance from the library facility increases” (Koontz, 2001). This implies that the area encompassing a library’s active cardholders, otherwise defined as the geographic market area, is limited to the two miles surrounding the library. In order to test the concept of distance as a deterrent and how using a Library 2.0 service model may decrease the effect of that deterrent, we looked at the situation in a single suburban library system – Wake County, North Carolina.
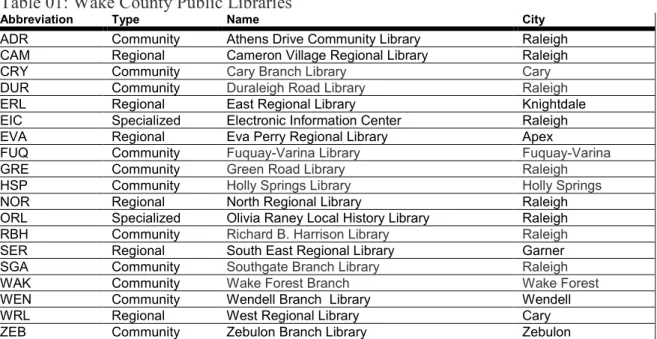
Wake County Library System
This study looks at current library card holders in the Wake County, North Carolina, public library system to determine where they live in relation to library
facilities. To understand the system under study, a few comments about the Wake County Public Library are in order.
The Wake County Library system located in North Carolina is presently
Table 01: Wake County Public Libraries
Abbreviation Type Name City
ADR Community Athens Drive Community Library Raleigh
CAM Regional Cameron Village Regional Library Raleigh
CRY Community Cary Branch Library Cary
DUR Community Duraleigh Road Library Raleigh
ERL Regional East Regional Library Knightdale
EIC Specialized Electronic Information Center Raleigh
EVA Regional Eva Perry Regional Library Apex
FUQ Community Fuquay-Varina Library Fuquay-Varina
GRE Community Green Road Library Raleigh
HSP Community Holly Springs Library Holly Springs
NOR Regional North Regional Library Raleigh
ORL Specialized Olivia Raney Local History Library Raleigh
RBH Community Richard B. Harrison Library Raleigh
SER Regional South East Regional Library Garner
SGA Community Southgate Branch Library Raleigh
WAK Community Wake Forest Branch Wake Forest
WEN Community Wendell Branch Library Wendell
WRL Regional West Regional Library Cary
ZEB Community Zebulon Branch Library Zebulon
The Wake County Library system has a centralized administrative office where technical services for the entire system such as cataloging, collection development and information technology are conducted. Management for interlibrary loan is not located at the main administrative office, but rather is centralized through the Cameron Village Regional location. The website for the Wake County Library system presents a
centralized location for patrons to obtain information twenty-four hours a day wherever they may be. Through this website patrons can determine their own library experience from options such as browse the catalog, reserve a book, or listen to a podcast. Of the normally expected Library 2.0 technologies the Wake library website offers blogs, podcasts and an online library catalogue enhanced with Library Thing for Libraries1. In addition to those applications the library offers access to a variety of book reviews and book lists offering a broad range of topics from the classics to graphic novels. They offer
1
the suite of resources offered through NC Live2 as well as access to special collections located at libraries within the system. For example, patrons can access photographs from the Mollie Huston Lee African American collection located at the Richard B. Harrison library or look at family history files located at the Olivia Raney local history library, all without leaving the comfort of their own home. The ability to remotely perform these activities takes both distance and hours of operation away as barriers to access to the library’s resources.
Moreover, the Wake County system has extended the Library 2.0 service model from the web to the individual library facilities offering users more autonomy and convenience when they visit the physical library. For example at the West Regional library there are several online catalog stations where patrons can look for a resource, then upon finding a selection check it out from the library using one of eight
self-checkout stations. Additionally, for those patrons that have reserved a book online there are special self-service shelves by the entrance where those materials are pulled and held under the patron’s name allowing for patrons to come into the library, pick up their books, check them out and be gone in just a matter of minutes. Over half of the libraries in the Wake County system offer self-checkout stations (see table 03).
As previously mentioned the Wake County system manages collection
development from a central office to create a floating collection that is shared throughout the system. A floating collection means that library resources such as books do not belong to one particular branch, but are shared by all the branches. For the user, the
2
floating collection means that they can request resources from any other branch in the system. Once that requested item arrives at the pick-up location it will become a part of that branch’s collection until it is once again transferred out on another patron request. Consequently, by requesting materials, patrons are participating in collection
development for their own branch. Depending on the demographics and preferences of the branch cardholders some branches have extensive holdings in certain area such as foreign languages or home school resources. Moreover, cardholders have library privileges at all of the Wake County libraries and are allowed to check out and return materials at any of the nineteen locations. This policy allows users an expanded choice of locations to use allowing them to control where they obtain their library resources.
In the past 10 years the Wake County system has grown and evolved with the times. It has experienced a 50% increase in legal service population and almost doubled the number of items circulated in a year. In 1998, public internet access was not offered at the library and today the system offers patrons free internet access using 622 personal computers.
LITERATURE REVIEW
As mentioned, the idea of reaching a niche market of underserved customers by offering a unique and diverse offering is the idea behind the economic concept of the ‘long tail’ by Chris Anderson (2006). By adopting the user focused service model of Library 2.0, libraries can enhance and build upon traditional services with the goal of reaching new populations of formerly underserved customers. A successful “librarian 2.0” should “base all planning and proposals for services, materials and outreach on user needs and wants” (Stephens, 2006). This service model seeks to connect users with the library from “wherever they may be, breaking down the barriers of space, time and outdated policy” (Casey, n.d.).
Optimizing library use by achieving the correct placement of public library facilities within the community has been a consistent aim of library related location research. Historically, it was thought better to have more libraries closer to the users as evidenced by “American Libraries Association, Post War Standards for Public Libraries (1943) which set a limit of one mile for optimal service in urban areas” (Palmer, 1981). However, as a result of research, the 1950s saw a new focus placed on centralized library service. One report from the Los Angeles Bureau of Budget and Efficiency promoted the consolidation of facilities. This proposal was reinforced by the publication of Robert Leigh’s Public Library Inquiry in 1950 which also recommended consolidation of facilities. (Palmer, 1981)
important principles in library related location research. The first principle on the list was “proximity to a facility increases use”. This was based on her review of studies done by Berleson (1949/1975); Palmer (1981) and Waples (1927). In 2001 Koontz reviewed a compilation of distance research gathered by Susan Palmer in 1981. From that review Koontz established that “use of the library decreases as distance from the library facility increases” (Koontz, 2001). In a dispersed or suburban system 76.7% of library patrons live within the two mile radius of the library branch while in urban areas 90% of the patrons reside within the two mile radius (Palmer, 1981). Further studies conducted with Hayes (1983) and the Los Angeles County library system supported this finding with data indicating that most library patrons live within a two mile radius of the library facility.
disaggregate data and summarize data based on various spatial relationships” (Ottensmann, 1997).
Dr. Christine Koontz, director of the Geolib research program at Florida State University, has geocoded with her team 16,000 public libraries in the United States to create the Public Library Geographic Database map3. This interactive map makes it possible to focus in on a particular library and capture census statistics for the purposes of analyzing the market area. Her research has shown that the best method for determining a true branch market area is to plot the actual addresses of the library card holders on to a map (Koontz, 2002).
METHODS
Step One.
The first step in this case study of the Wake County Public library system was to obtain the address information for all of the current cardholders in the system. A current cardholder is defined as a library card holder of any age that has had activity on their library account in the past three years. Additionally, each cardholder is associated with a library branch, which is usually the branch that issued the card but not always. Once collected, the cardholder addresses were imported into a geographic information system so that the address information could be converted into spatial information. The spatial information allowed for the creation of maps and the comparison of distances between patrons and the libraries.
3
Step Two
This study builds on the methods used by Palmer and Hayes in Los Angeles as well as those of Ottensmann and Kinikin. Each of these researchers studied the effect of distance on library use by plotting library patron addresses on a map and assigning incremental buffers to measure the number of points within those buffers. In a similar fashion this study has created a center point at each library location and drawn concentric circles irradiating out from the library at one, three and five mile intervals. The rings were overlaid onto the map showing cardholder addresses and a count of the points in each ring or buffer was recorded. This measurement was done for each branch
individually based on the library designated in the cardholder record. The resulting map will illustrate the dispersion of card holders around the given library.
Step Three.
Step Four.
A secondary goal of this research is to explore the effect use of Library 2.0 as a service model has had on the distance patrons in the Wake County system are willing to travel to the library. Towards this goal, the researcher collected as much statistical information regarding the Wake County Library system as possible. Library statistics were evaluated in terms of their relationship to the concept of Library 2.0.
DATA COLLECTION
Card holder addresses.
The Wake County library system information technology department provided nineteen datasets that form the basis for this study. Each dataset is comprised of the current cardholder address information and the branch associated with that card.
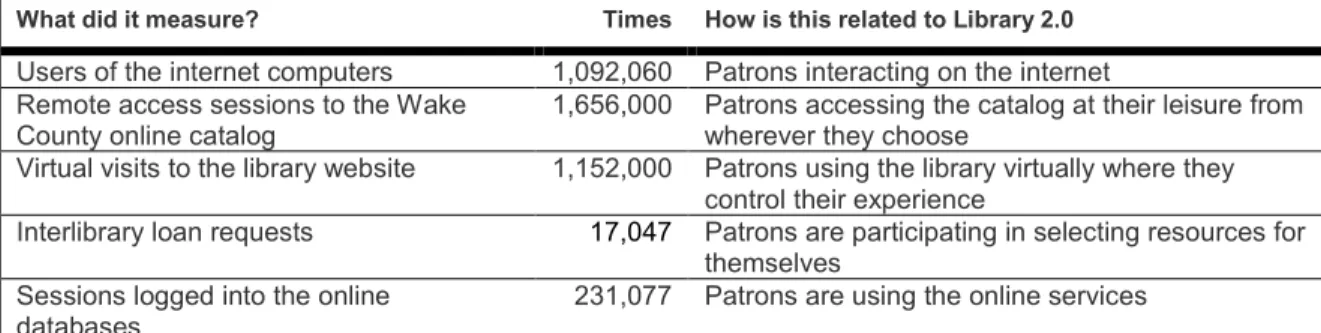
Wake County System-wide statistics
Table 02: Data from NC Annual Statistical Report, 2007-2008
What did it measure? Times How is this related to Library 2.0
Users of the internet computers 1,092,060 Patrons interacting on the internet Remote access sessions to the Wake
County online catalog
1,656,000 Patrons accessing the catalog at their leisure from wherever they choose
Virtual visits to the library website 1,152,000 Patrons using the library virtually where they control their experience
Interlibrary loan requests 17,047 Patrons are participating in selecting resources for themselves
Sessions logged into the online databases
231,077 Patrons are using the online services
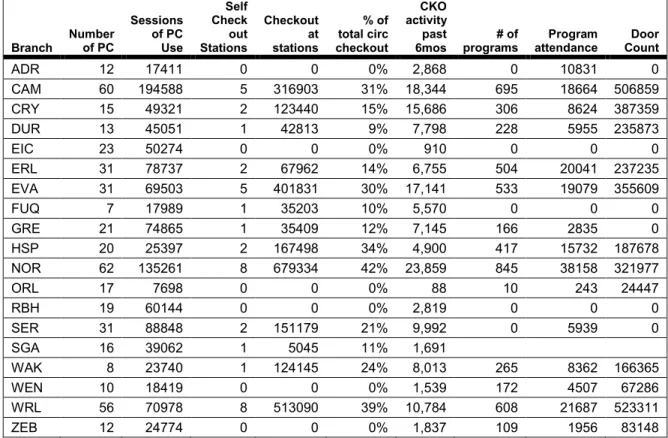
Wake County Branch Statistics
are features that allow patrons to control their own library experience. Checkout activity in the past six months, program statistics and door count were also selected as they speak to how many patrons are physically using the library.
Table 03: Wake County Branch Service Statistics
Branch Number of PC Sessions of PC Use Self Check out Stations Checkout at stations % of total circ checkout CKO activity past 6mos # of programs Program attendance Door Count
ADR 12 17411 0 0 0% 2,868 0 10831 0
CAM 60 194588 5 316903 31% 18,344 695 18664 506859
CRY 15 49321 2 123440 15% 15,686 306 8624 387359
DUR 13 45051 1 42813 9% 7,798 228 5955 235873
EIC 23 50274 0 0 0% 910 0 0 0
ERL 31 78737 2 67962 14% 6,755 504 20041 237235
EVA 31 69503 5 401831 30% 17,141 533 19079 355609
FUQ 7 17989 1 35203 10% 5,570 0 0 0
GRE 21 74865 1 35409 12% 7,145 166 2835 0
HSP 20 25397 2 167498 34% 4,900 417 15732 187678
NOR 62 135261 8 679334 42% 23,859 845 38158 321977
ORL 17 7698 0 0 0% 88 10 243 24447
RBH 19 60144 0 0 0% 2,819 0 0 0
SER 31 88848 2 151179 21% 9,992 0 5939 0
SGA 16 39062 1 5045 11% 1,691
WAK 8 23740 1 124145 24% 8,013 265 8362 166365
WEN 10 18419 0 0 0% 1,539 172 4507 67286
WRL 56 70978 8 513090 39% 10,784 608 21687 523311
ZEB 12 24774 0 0 0% 1,837 109 1956 83148
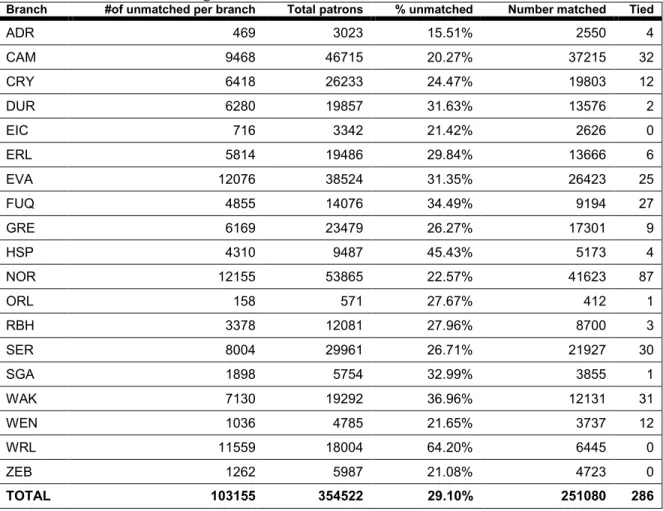
Preparing Datasets for GIS
In order to plot the cardholder address information and create maps it was
necessary for the raw data from Wake County to first be processed. To this purpose each of the nineteen datasets containing address data from Wake County was imported into a Microsoft Excel spreadsheet and then refined to delete any null or empty fields,
Table 04: Address Matching Results 2008 dataset
Branch #of unmatched per branch Total patrons % unmatched Number matched Tied
ADR 469 3023 15.51% 2550 4
CAM 9468 46715 20.27% 37215 32
CRY 6418 26233 24.47% 19803 12
DUR 6280 19857 31.63% 13576 2
EIC 716 3342 21.42% 2626 0
ERL 5814 19486 29.84% 13666 6
EVA 12076 38524 31.35% 26423 25
FUQ 4855 14076 34.49% 9194 27
GRE 6169 23479 26.27% 17301 9
HSP 4310 9487 45.43% 5173 4
NOR 12155 53865 22.57% 41623 87
ORL 158 571 27.67% 412 1
RBH 3378 12081 27.96% 8700 3
SER 8004 29961 26.71% 21927 30
SGA 1898 5754 32.99% 3855 1
WAK 7130 19292 36.96% 12131 31
WEN 1036 4785 21.65% 3737 12
WRL 11559 18004 64.20% 6445 0
ZEB 1262 5987 21.08% 4723 0
TOTAL 103155 354522 29.10% 251080 286
Creating buffers and populations
The library facilities were also geocoded with 100% matching ratio. Then using each facility as a center point, buffers were created in concentric circles irradiating out at one, three and five mile intervals. Branch locations and cardholder locations were mapped together and a count of cardholders residing within each of the buffer areas as well as outside the five mile buffer was taken. The resulting maps (page 43) illustrate the dispersion of card holders around their affiliated Wake County library branch. By
area for each library facility. Furthermore, for comparative analysis of the branch facilities, table 05 on the following page provides the totals for the number of patrons living within each of the buffer zones otherwise referred to as the buffer population.
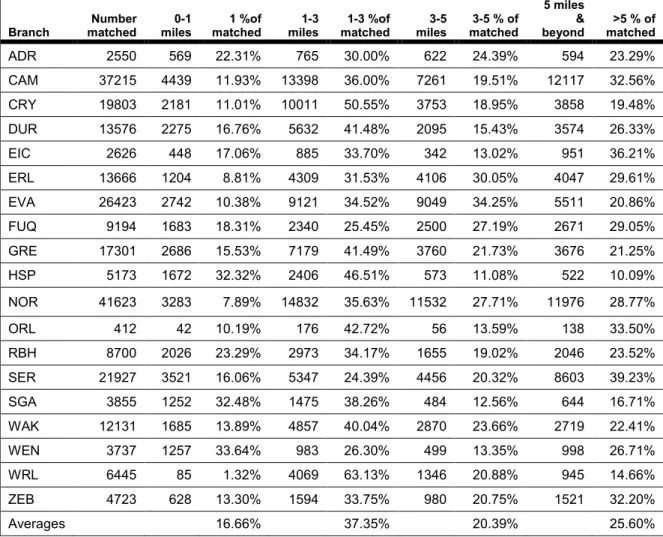
Table 05: Buffer Population
Branch Number matched 0-1 miles 1 %of matched 1-3 miles 1-3 %of matched 3-5 miles
3-5 % of matched
5 miles & beyond
>5 % of matched
ADR 2550 569 22.31% 765 30.00% 622 24.39% 594 23.29%
CAM 37215 4439 11.93% 13398 36.00% 7261 19.51% 12117 32.56%
CRY 19803 2181 11.01% 10011 50.55% 3753 18.95% 3858 19.48%
DUR 13576 2275 16.76% 5632 41.48% 2095 15.43% 3574 26.33%
EIC 2626 448 17.06% 885 33.70% 342 13.02% 951 36.21%
ERL 13666 1204 8.81% 4309 31.53% 4106 30.05% 4047 29.61%
EVA 26423 2742 10.38% 9121 34.52% 9049 34.25% 5511 20.86%
FUQ 9194 1683 18.31% 2340 25.45% 2500 27.19% 2671 29.05%
GRE 17301 2686 15.53% 7179 41.49% 3760 21.73% 3676 21.25%
HSP 5173 1672 32.32% 2406 46.51% 573 11.08% 522 10.09%
NOR 41623 3283 7.89% 14832 35.63% 11532 27.71% 11976 28.77%
ORL 412 42 10.19% 176 42.72% 56 13.59% 138 33.50%
RBH 8700 2026 23.29% 2973 34.17% 1655 19.02% 2046 23.52%
SER 21927 3521 16.06% 5347 24.39% 4456 20.32% 8603 39.23%
SGA 3855 1252 32.48% 1475 38.26% 484 12.56% 644 16.71%
WAK 12131 1685 13.89% 4857 40.04% 2870 23.66% 2719 22.41%
WEN 3737 1257 33.64% 983 26.30% 499 13.35% 998 26.71%
WRL 6445 85 1.32% 4069 63.13% 1346 20.88% 945 14.66%
ZEB 4723 628 13.30% 1594 33.75% 980 20.75% 1521 32.20%
Averages 16.66% 37.35% 20.39% 25.60%
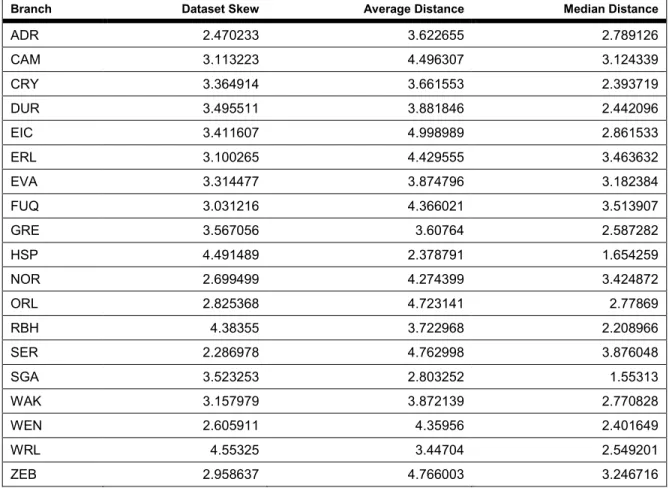
less than or equal to sixty miles was established. As a result 301 data points were rejected representing only 12% of the total matched data points. The following table 06 contains a summary of the results of the distance analysis for each branch.
Table 06 Point Distance Statistics
Branch Dataset Skew Average Distance Median Distance
ADR 2.470233 3.622655 2.789126
CAM 3.113223 4.496307 3.124339
CRY 3.364914 3.661553 2.393719
DUR 3.495511 3.881846 2.442096
EIC 3.411607 4.998989 2.861533
ERL 3.100265 4.429555 3.463632
EVA 3.314477 3.874796 3.182384
FUQ 3.031216 4.366021 3.513907
GRE 3.567056 3.60764 2.587282
HSP 4.491489 2.378791 1.654259
NOR 2.699499 4.274399 3.424872
ORL 2.825368 4.723141 2.77869
RBH 4.38355 3.722968 2.208966
SER 2.286978 4.762998 3.876048
SGA 3.523253 2.803252 1.55313
WAK 3.157979 3.872139 2.770828
WEN 2.605911 4.35956 2.401649
WRL 4.55325 3.44704 2.549201
ZEB 2.958637 4.766003 3.246716
Straight-line Distance Traveled.
Using the library branches as the center point this study used Arc GIS to measure the straight-line distance from each branch to all of its affiliated cardholders. The
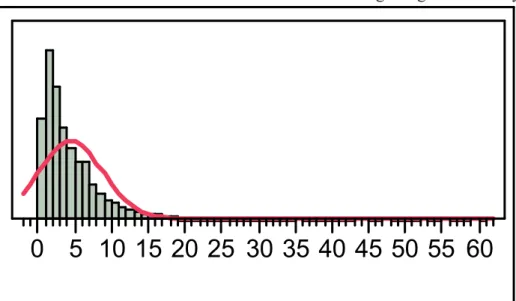
while the central tendency can be measured by the average or mean distance, the median will be a more reliable measure because the averages are being skewed or inflated by outliers. When plotted on a standard distribution curve data skewed to the right will show a normal curve with a longer tail on the right hand side. Table 07 below is an example using the distance data from the Cameron Village Regional Library where the mean was found to be 4.496 miles but the median was only 3.124 miles. The mean or average is inflated by the number of outliers who live further away from the library. These outliers make up the long tail representing the niche market of people normally underserved (Anderson, 2006).
Table 07 Distribution of the distances Cameron Village Regional Library
0
5 10 15 20 25 30 35 40 45 50 55 60
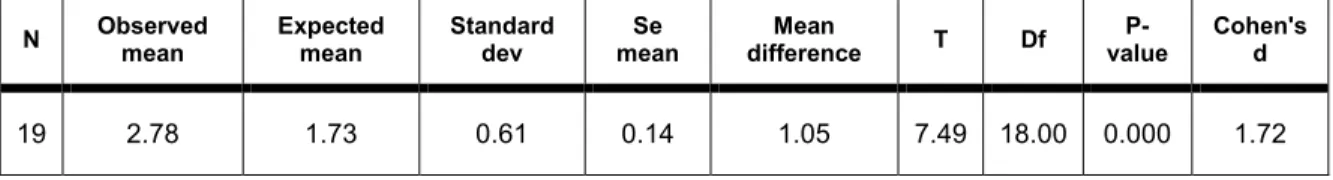
The average median for the Wake County libraries (6 regionals and 13 branches) was calculated at is 2.78 miles. These measurements were compared using a standard one sample means test (t-test) to determine statistical significance with the following results:
Table 08 Median Distance to all Wake County Library System Branches
N Observed mean Expected mean Standard dev Se mean Mean
difference T Df P-value
Cohen's d
19 2.78 1.73 0.61 0.14 1.05 7.49 18.00 0.000 1.72
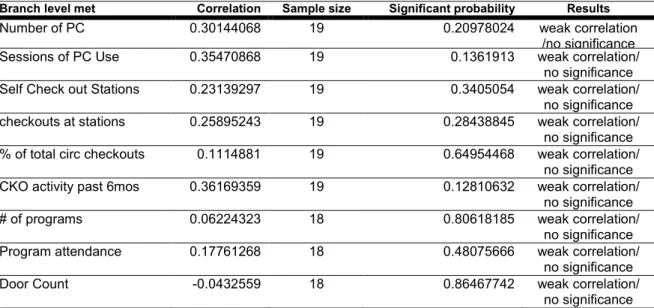
Variable Effects on Distance
correlation, it is not significant. Therefore this study cannot say that any of these branch level variables has an effect on the distance patrons live from the library.
Table 09 Bivariate Correlation
Branch level met Correlation Sample size Significant probability Results
Number of PC 0.30144068 19 0.20978024 weak correlation
/no significance
Sessions of PC Use 0.35470868 19 0.1361913 weak correlation/
no significance
Self Check out Stations 0.23139297 19 0.3405054 weak correlation/
no significance
checkouts at stations 0.25895243 19 0.28438845 weak correlation/
no significance
% of total circ checkouts 0.1114881 19 0.64954468 weak correlation/
no significance
CKO activity past 6mos 0.36169359 19 0.12810632 weak correlation/
no significance
# of programs 0.06224323 18 0.80618185 weak correlation/
no significance
Program attendance 0.17761268 18 0.48075666 weak correlation/
no significance
Door Count -0.0432559 18 0.86467742 weak correlation/
no significance
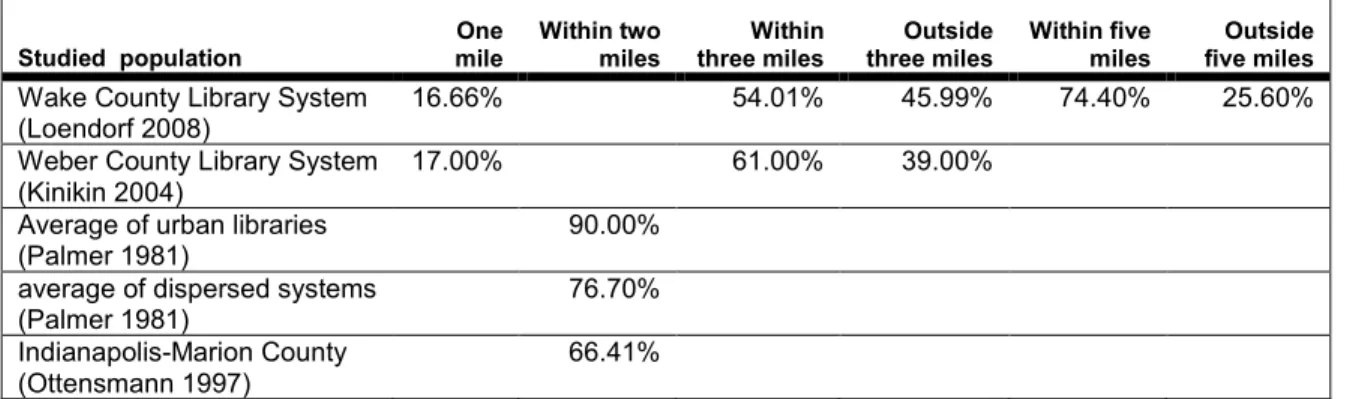
Proximity Distance- Buffer Populations
Much of the research studying the effect of distance on library use measures results based
on the percentage of library patrons that live within a proximity of the library using
buffers or concentric circles as a unit of measure. The following table is a comparison of
results from this study of the Wake County system and historical distance studies. The
figures found on table 10 represent the percentage of patrons that live within the given
Table 10: Buffer Populations4
Studied population
One mile Within two miles Within three miles Outside three miles Within five miles Outside five miles
Wake County Library System (Loendorf 2008)
16.66% 54.01% 45.99% 74.40% 25.60%
Weber County Library System (Kinikin 2004)
17.00% 61.00% 39.00%
Average of urban libraries (Palmer 1981)
90.00%
average of dispersed systems (Palmer 1981)
76.70%
Indianapolis-Marion County (Ottensmann 1997)
66.41%
The buffer population data was further defined and sorted to provide a different perspective on the distribution within the Wake County system. Table 11 displays the buffer population results for the Wake County library system based on the type of facility. Separating out these measurements highlighted the difference between where branch and regional library patrons reside.
Table 11: Buffer population Branch verses Regional facility.
Type One mile 1-3 miles 3-5 miles >5 miles
Branches 20.01% 37.26% 18.06% 24.67%
Regionals 9.40% 37.53% 25.45% 27.62%
LIMITATIONS OF THE STUDY
This study was conducted using the Wake County Public library system. While this is a large system including both urban and rural locations it is still just one uniform system. Additionally, it is an open system where library card holders are allowed to check materials out from any location regardless of where their original library card was
4
issued. For this reason it is possible for people to have been issued a library card at one facility and then to have moved or simply use a different facility. For the purposes of this study we have evaluated the distance based on cardholders affiliated with the specific library location. In doing so we are ignoring the aspect of the data that shows how many cardholders reside near the library regardless of their branch affiliation. This study did explore this measurement and decided not to use the data found from this analysis due to the overlapping market areas of branch locations. This study is also unique in that it involves the entire population of active library cardholders whereas other cited research has only used samples of the population based on circulation criteria or survey studies. This difference in sample size and selection may have a bearing on the results; however this cannot be confirmed without further research. Other factors limiting the conclusions of this study are the effect of natural maturation of the community and effects of
suburban sprawl. It was impossible to conclude that the increased market area enjoyed by the Wake County System was attributed to any one variable.
FINDINGS
Median Distance Traveled
County library cardholders live approximately one mile further away from library facilities than did library patrons at the Indianapolis-Marion County Public Library.
Proximity Distance- Buffer Populations
The comparisons of buffer populations listed in table 10 above indicate that the Wake County system is more dispersed than the other systems previously studied. The most recent study done by Kinikin in 2004 is the closest but the Wake system is still more dispersed than the Weber County system. This confirms that Wake County library patron populations are not concentrated in the two miles surrounding the library.
IMPLICATIONS
The results of this study indicate an important shift from the previously accepted tenet that most library patrons live within 2-3 miles of their library. For the public library these findings have cross functional implications from library administrators to story time presenters, possibly affecting areas such as budgeting, planning, marketing and services.
Some of the most important tasks of system administrators and branch managers are those involving the areas of budget and funding. Having a better understanding of the library’s true market area will greatly assist in these tasks as it provides library
administrators a means to illustrate relevance of the public library within the community. When combined with census data, the maps resulting from this study can be used to evaluate the branch needs and assist administrators in determining how library funds will be distributed throughout the system. The collection development department will also be able to use this information as they budget for new additions to the collection. Finally, at the branch level, managers and librarians alike can use this information as a guide to spending branch resources for programming and services. For example, using
geographic information systems librarians can estimate the number of school age children that are likely to attend a summer reading program and budget accordingly.
Another task for which library administrators have traditionally turned to geographic information systems is that of library citing or branch closures. It is
to save money. In 2007 Christina Koontz wrote “A History of Location of U.S. Public Libraries within Community Place and Space: Evolving Implications for the Library’s Mission of Equitable Service.” In this article Koontz discussed the results of research conducted in the 1980s. Some of this research supported the model for building larger regional units while other research “indicated that this model is not always appropriate in every community and may have negative effects on use” (Koontz, 2007). The findings in this study indicate that the branch locations are still very important to the immediate communities where they are found in addition to attracting patrons from further distances. This supports the “view that smaller units actually allow greater citizen participation, and as participation increased, so did citizen satisfaction” (Koontz, 2007). Furthermore, this notion that greater participation increases citizen satisfaction is a basic premise of the Library 2.0 model.
The results of this study have implications for library directors and librarians as well. In order to provide quality programming and service it is important to know the community your library serves. Having your cardholder population mapped in GIS means that librarians can also bring in census data in order to get a more complete picture of who is being served by the library. At the same time this may also highlight who is not being served by the library. The information gathered by knowing the true market area can be used in targeted marketing as well as program planning and evaluation.
the Library 2.0 service model helps the library reach more patrons then the implication would be that Library 2.0 is one path libraries could take to reaching underserved populations.
CONCLUSION
What we have learned through this study is that assuming that library cardholders use the branch library with which their card is affiliated we can successfully map the library cardholder population and conduct geographic analysis. By comparing the results from the median distance metrics for the Wake County system in table 06 to the work of Ottensmann (1997) we can see that the average median distance traveled by patrons to a library has increased by one mile. (See table 08) Additionally, judging from the
comparison of the buffer populations in table 10 of the Ottensmann (1997), Palmer (1981) and Kinikin (2004) studies, we can conclude that the Wake County library system has a geographic market area that is more dispersed than previously thought possible for a public library.
Since the introduction of geographic information systems not many studies have been conducted using the library population based on registration. Now that the software is becoming more accessible perhaps libraries will take a page from the retail sector to use the cardholder data to map and evaluate their market areas. If libraries do begin to use GIS then they will need to make adjustment to how they collect cardholder
REFERENCES
Abram, Stephen. (2006). Web 2.0, Library 2.0, and Librarian 2.0: Preparing for the 2.0 World. SirsiDynix OneSource, v. 2(1)
Anderson, C. (2006). The long tail. London: Random House Business.
Berelson, Bernard. (1975). The Library’s public. Westport, CT: Greenwood Press. (Original work published 1949)
Casey, Michael, (2005) Service for the Next Generation Library: A Library 2.0 Perspective. Retrieved on March 27, 2009 from
http://www.librarycrunch.com/2005/09/please_take_my_desktop.html
Levine, J. and Stephens, M. (n.d.). Library 2.0 Reading List, Retrieved on May 28, 2008 from http://www.squidoo.com/library20
Casey, M. (2005). Is there a Library 1.0? Does it help to ask? Retrieved on March 24, 2009 from http://www.librarycrunch.com/2005/10/
Where Do We Begin? A library 2.0 Conversation with Michael Casey. Posted on 12/15/2005 at 03:30:30 AM by Michael Stephens & Michael Casey.
Hayes, R.M., & Palmer, E.S. (1983). The effects of distance upon use of libraries: Case studies based on a survey of users of the Los Angeles Public Library--central library and branches. Library and Information Science Research, v. 5(1), 67-100.
Kinikin, J. (2004). Applying geographic information systems to the Weber County library system.Information Technology and Libraries, v. 23(3), 102-107.
Koontz, C.M., (1992). Public Library Site Evaluation and Location: Past and Present Market-Based Modeling Tools for the Future, Library & Information Science Research, v. 14(4), 379-409.
Koontz, C.M., (2001), The Location of Your Library Building: Why It Is Important, and How to Do it, Using GIS (Geographic Information System Software), In
Bisbrouck, M.-F., Library Buildings in a Changing Environment, IFLA Publication 94, 141-153.
Koontz, C.M., (2002). Where do our real customers live? (And why should we care?),
Marketing Library Services, 16, 4-6.
Koontz, C.M., (2007). A History of Location of U.S. Public Libraries within Community Place and Space: Evolving Implications for the Library’s Mission of Equitable Service, Public Library Quarterly, 26(1/2), 75-100.
Maness, J. (2006). Library 2.0 Theory: Web 2.0 and Its Implications for Libraries,
Palmer, E.S., (1981). The effect of distance on public library use: A literature survey,
Library Research, 3 (315-334).
State Library of North Carolina. (2009). Statistics for NC Public Libraries: 2007-2008 Annual Statistical Report. Retrieved Mar. 28, 2009, from State Library of North Carolina, Raleigh, NC.
http://statelibrary.ncdcr.gov/ld/plstats/0708/0708fullrpt.pdf
Ottensmann, J.R., (1997). Using geographic information systems to analyze public library utilization. Library Quarterly 67 (1), 24-48.
Stephens, M., (2006). Web 2.0 Where will it take libraries? Next Space: The OCLC Newsletter, 2.
GLOSSARY
Statistical Terminology
Cohen’s d – a statistical measurement that represents the significance of the difference. While the p-value says that the items are different the Cohen’s d value speaks to how different they are.
DF - degree of freedom - the number of values in the final calculation of a statistic that are free to vary
expected mean - an average provided by some historical study or other source. In the case of this study the expected mean was provide by the study conducted by J.R. Ottensmann.
mean difference - difference between the observed and expected means.
n - sample size of the data set or the number of items being measured in the study.
observed mean - average of the data set collected through research
P-value - a statistical measurement that speaks to the significance of the means test. Less than 0.5 is an indication that there is a significant difference between the two sets of averages.
standard deviation - this measures the spread of the distribution around the mean
SE (standard error) mean - a measure of the variability of the results
Library 2.0 Technologies
Blog entries - medium for user communication, collaboration and an information source. Measured by the number of weekly blog entries.
Deli.cio.us - this site allows users to create a list of favorite links. Add descriptive tags to them and share them.
Fan Fiction - when people other than the author of a work creates a similar storyline of their own creation based on the framework set up by the author.
Flickr - photo organization- site dedicated to organizing and sharing photographs. (virtual scrapbooks)
Library Thing for Libraries - ability for library users to review library resources and add their own metadata or tags to those resources. Measured weekly by the number of reviews posted and metadata added to the system.
Multi-user virtual environments- environments such as Second Life or Teen Second Life.
NC Live - provides the people of North Carolina with online access to a collection of resources aimed at serving educational, economic, and informational needs of everyday life
Photobucket - photo organization- site dedicated to organizing and sharing photographs. (virtual scrapbooks)
RSS (Really Simple Syndication) Feeds - ability for the user to design their own automatic email updates. Measured by the number of RSS feeds supplied through the library website.
Second Life - multiuser virtual environment where users create an online avatar and interact with other users in a virtual world.
Twitter - like a mini version of a blog. Users can send out short blog messages to other users that follow their twitter profile.
MAPS
Map 01: One mile buffer overlap