TABLE 1.1 Material and Labor Costs for the Construction of a Pour-flush Latrine for a Family of Five
(Adapted from "Manual on the Design, Construction
and Maintenance of Low-Cost Pour-flush Waterseal Latrines in India", TAG Technical Note Number 10) .
PERCENTAGE OF ITEM COST (US?) TOTAL COST (%)
Foundation and plinth for superstructure
a) Excavation 0.13 0.16
b) Cement concrete 1.61 2.03
c) Brickwork 7.24 9.15
d) Flooring 2.40 3.03
2. Flushing pan
(materials and
installation) 11.00 13.90
3. Twin leaching pits
(materials and
installation) 36.00 45.48
Miscellaneous
a) Brick drain 7.80 9.85
b) Extra labor 2.70 3.41
c) Supervision costs lOxia 13.00
II. THEORY
ZjJ.__Litetatuce Revirgw
A review of the sanitary engineering literature revealed
that little published information was available on pit
latrines. Most of the published studies have focused on the
pollution aspects of latrine operation (IRCWD, 1980) . No
published material was found on sludge accumulation rates
and how these rates might be affected by different
socio-cultural and environmental conditions.
In light of this lack of information on latrineSf it was
decided that the best approach to designing an experiment to
study accumulation rates was to have a thorough knowledge of
the basic scientific principles that would govern the processes by which material accumulated in a pit.
2ls2__Accumulation Processes
There are only two ways material can leave a latrine once it is deposited in a pit. One way is through
decomposition and the other is through drainage.
2.2.1 Decomposition Process
A portion of the organic matter put into a pit latrine
ACID FORMATION
METHANE
PRODUCTION
A
r r \ ^
RAW SLUDGE
MICRO¬
ORGANISMS STABLE AND INTERMEDIATE OEGRAOATION PRODUCTS
MICRO¬ ORGANISMS
ru i rr\ j. OTHER END
^*^* * ^"j * PRODUCTS
COMPLEX SUBSTRATE CARBOHYDRATES
FATS AND
PROTEINS
PRINCIPALLY ACID FORMERS
ORGANIC ACIDS, C0>
HjO, AND CELLS '
METHANE
BACTERIA HjO, HjS CELLS AND STABLE
DEGRADATION PRODUCTS
FIGURE 2.1
down the complex organic compounds found in feces, urine and
other wastes into simpler forms that can be used in cell
metabolism and synthesis. While the organic matter that is
converted to biomass will not affect the amount of sludge in a pit latrine, it is possible that some sludge reduction
will occur due to the loss of liquid and gaseous by-products
of cell metabolism.
It is expected that because of the relatively high concentration of organic matter in undiluted human wastes
and because air is not artificially introduced into the
sludge in a pit latrine, the primary type of microbial activity that will occur in a latrine will be anaerobic
digestion.
Process Dynamics. Anaerobic digestion has been found to
be a two-step process (McCarty, 1964). This is illustrated in Figure 2-1. In the first step, complex organic molecules of carbohydrates, proteins, and lipids are hydrolyzed to form simple alcohols and volatile acids. This step is often
referred to as the liquefaction or acid formation phase of
digestion.
The second step of digestion is gasification. In this .
step the alcohols and volatile acids formed in the
liquefaction phase of digestion are converted to carbon dioxide, methane and other gaseous substances.
The bacteria responsible for the two steps
TABLE 2-1 BACTERIA OF ANAEROBIC DIGESTION (Metcalf and Eddy, 1979)
A. Non-Methanogenic (facultative and obligate anaerobes)
1. Clostridium spp.
2. Peptococcus anaerobus 3. Bifidobacterium spp. 4. Desulphovibrio spp. 5. Carynebacterium spp.
6. Lactobacillus
7. Actinomyces
8. Staphylococcus
9. Escherichia coli
B. Methanogenic (strict anaerobes)
1. Methanobacterium
2. Methanobacillus
3. Methanococcus
The microorganisms involved in the first step include both
facultative and obligative anaerobes (see Table 2-1). They
are highly adaptive and can function over a wide range of
environmental conditions.
The methanogenic bacteria are involved in the
transformation of the simple alcohols and volatile acids to
methane and carbon dioxide gases. They are strict
anaerobes. They cannot function in the presence of oxygen.
In contrast to the bacteria responsible for liquefactionr
the methanogenic bacteria are known for their sensitivity to
environmental conditions.
In reference to the rate of digestion, it is the
methanogenic bacteria which are critical (McCarty, 1964) . Besides being the most sensitive to environmental
conditions, they also have the slowest rate of metabolism. The rate-limiting or slowest step in digestion is therefore
ANAEROBIC DIGESTION PARAMETERS
Methanogenic bacteria are best known for their
sensitivity to pH and temperature. Recent studies have also
considered how these bacteria are affected by factors such
as salt toxicity and composition. A general overview of how
different factors are known to affect the anaerobic
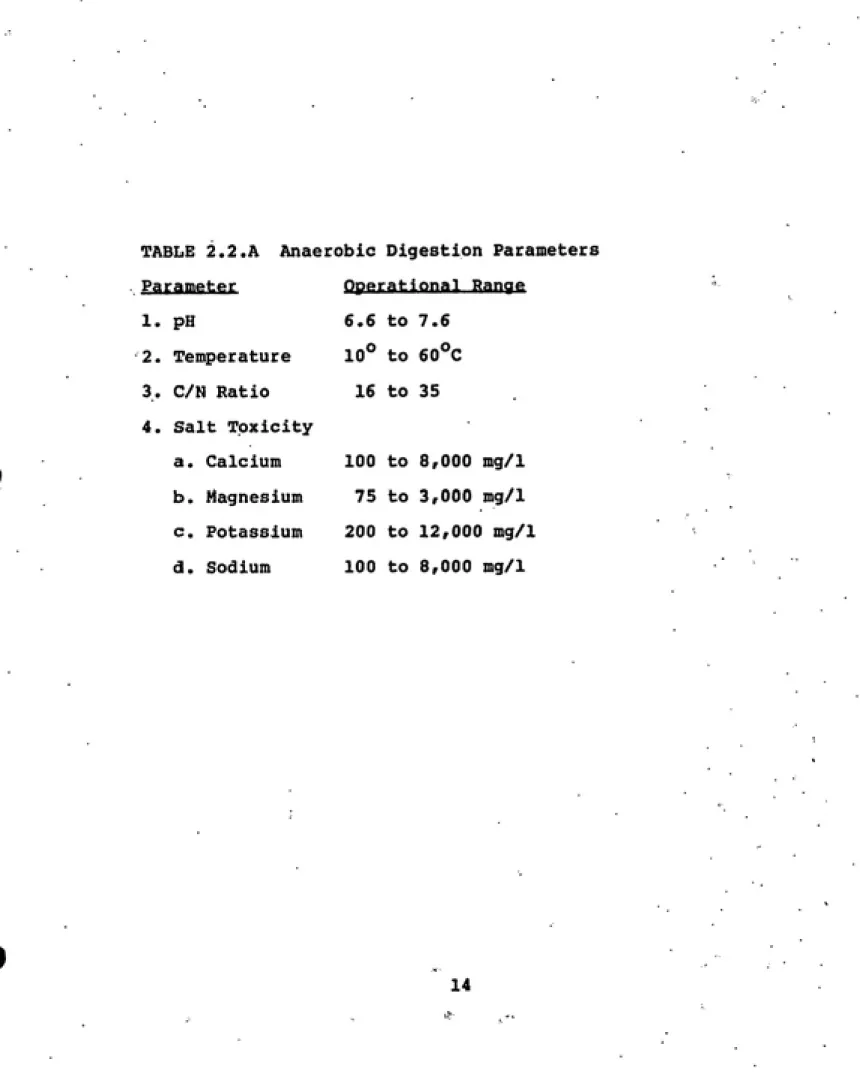
digestion process is provided in Table 2.2.A. A complete review of the literature on the anaerobic digestion process
and associated parameters is provided in Appendix C.
2.2.2 Drainage Process
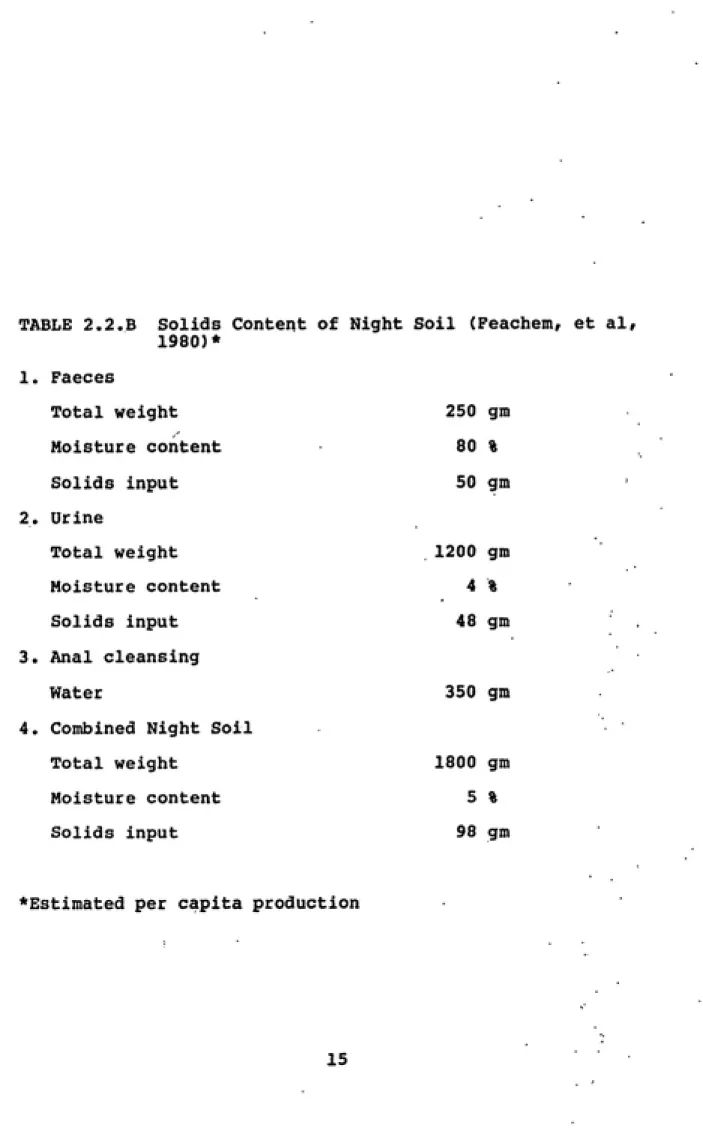
It can be assumed that solid materials will make up only
5-10% of the wastes that are put into a typical latrine (see Table 2.2.B). What happens to the remaining 90-95% of the wastes put into a latrine? The only way that this fraction
(the liquid component) of the wastes can be reduced is
through the process of drainage.
TABLE 2.2.A Anaerobic Digestion Parameters Parameter Operational Range
1. pH 6.6 to 7.6
2. Temperature 10° to 60°C
3. C/N Ratio 16 to 35
4. Salt Toxicity
a. Calcium 100 to 8,000 mg/1 b. Magnesium 75 to 3,000 mg/1 c. Potassium 200 to 12,000 mg/1
TABLE 2.2.B Solids Content of Night Soil (Feachem, et al,
1980)*
1. Faeces
Total weight
Moisture content
Solids input
2. Urine
Total weight
Moisture content
Solids input
3. Anal cleansing
Water 350 gm
4. Combined Night Soil
Total weight 1800 gm
Moisture content 5 %
Solids input 98 gm
Estimated per capita production
250 gm 80 % 50 gm
1200 gm 4 % 48 gm
Process Dynamics
A. FORCES CAUSING LIQUID FLOW
Water movement through the soil can be explained in terms
of energy levels (EPA, 1978). Water at any point in the
soil has a certain amount of energy associated with it.
Water will flow in the direction of lowest energy. That is,
water will move from one position in the soil to another
only if the energy level of the water at the second point is
lower than the energy level of the water at its initial
position.
The energy level or status of water at a position is referred to as its moisture potential (M). A moisture
potential gradient indicates a difference in the energy
level of water.
The moisture potential has two components. A portion of
the moisture potential arises out of the forces of gravity
acting on the water molecules. This creates what is known
as a gravitatipnal PQtential (h). The other component of
the moisture potential is the matric potential (m).
Inter-and intra-molecular forces are responsible for the creation
of the matric potential. The sum of the water's
gravitational and matric potential equals its moisture
potential.
1) Gravitational Potential - The gravitational potential
of water differs in reference to its relative vertical
the earth. The gravitational potential gradient which exists between any two points in the soil is equal to,
E<an 2.1
GRAVITATIONAL POTENTIAL GRADIENT ( h) = (m)(g)(z) where
m = mass of water (gm)
2
g = gravitational constant (cm/sec )
z = vertical distance between two points (cm)
A common convention is to consider the gravitational potential in terms of unit weight. The gravitational
potential gradient on this basis is measured in units of
length (cm).
2) Matric Potential - An attraction exists between water
molecules and the surface molecules of the soil particles. This attraction is caused by adhesive forces. Water
molecules are pulled in the direction of dry surface areas by these forces. These water molecules in turn pull on adjacent water molecules. This is due to intermolecular
cohesive forces. The combination of adhesive and cohesive forces give rise to matric potential.
The amount of matric potential that is present in a given
situation is a function of two factors - soil moisture
cannot be determined through use of a sample equation based on physical constants and measureable quantities. Usually the matric potential of a soil is determined empirically.
(A more detailed discussion of matric potential and its
relationship to soil moisture content and type is provided
in Appendix C.)
B. RESISTANCE OF SOIL TO GROUNDWATER FLOW
Just as important as the forces which cause water to move through the soil, are the resistances the flow encounters in its path. The resistance of the soil to flow can affect the
amount and the direction of water movement.
The traditional approach to accounting for a soil's
resistance to water movement through it, has been to speak
of the soil's ability to transmit water. To this end the
concept of the hydraulic conductivity (k) has been
developed.
The hydraulic conductivity differs in soils for a number
of reasons. The hydraulic conductivity of a particular soil is a function of several physical factors. The porosity, particle size and distribution, shape of particles and
arrangement all play a role in determining a soil's
hydraulic conductivity (Todd, 1980) . Values for some of
these factors for soils are given in Tables 2.3 and 2,4.
Laboratory studies have been conducted in an effort to
develop a means of predicting the hydraulic conductivity
r
r
FIGURE 2.2
SOIL MOISTURE RETENTION FOR FOUR
DIFFERENT SOIL TEXTURES
.5 20
o
20 40 60 80 100
Soil Moisture Tension (MBAR) Soil Drying---'ͣ--->
Matric Potontial
C
The relationship between soil
moisture content and matric potential
(as measured in millibars of tension,
(Todd, 1980). The most successful studies in this area indicate a relationship can be shown between conductivity
and particle diameter in the form of,
Eqn 2.2
k = f^ f d2
where
k = hydraulic conductivity (cm/day) f_ = grain or pore shape factor
f = porosity factor
d = characteristic grain diameter
Extension of the laboratory research to suggest field measurements to predict hydraulic conductivity has been limited. This is due to the large number of factors which influence a soil's conductivity. It has been found very difficult to replicate in-situ soil conditions in a
laboratory.
In general, instead of trying to predict hydraulic conductivity from the soil characteristics, it has been recommended k be measured in-situ when possible. Several
methods are available in the literature for in-situ
measurement of the hydraulic conductivity of a soil (Black, 1965).
C. DESCRIPTIVE EQUATION
In 1856, Henry Darcy developed an expression describing the flow of water through porous media (Todd, 1980). The
Malrnul Particle Sixc. mm
Cljy <U.O(M Silt 0.004-0.062
Very fine und 0.0&2-O.12S Fine sand 0.125-O.2S
Medium sand 0.2S-O.S
Coarse sand 0.5-1.0
Very coarse sand 1.0-2.0
Very fine gravel 2.0-4.0
Fine gravel 4.0-8.0
Medium gravel 8.0-16.0
Coarse gravel 16.0-32.0
Very coarse gravel 32.0-64.0
Table 2,3
Soil classification based
on particle size
(Morris and Johnson, 196?)
Porosity. Porosity.
Material Percent Material Percent
Gravel, coarse 28* Loess 49
Gravel, medium 32" Peal 92
C.nivpl. fine 34* Schist M
Sund. cuarsc 33 Sillslonc 35
Sand, medium 39 Claysione 43
Sand. Tine 43 Shale ' ft
Silt *? Till.
Clay 42 predominantly sill M
Sandstone, Till.
fine-grained 33 predominantly sand ͣ 31
Sandstone, Tuff 41
medium-grained 37 Basalt 17
Limestone 30 Cabbro. weathered 43
Dolomite 26 Granite, weathered 4S
Dune sand 45
ͣ
Theaa values art for repacked samples: all others are uodislurbad.
Table 2,k
Representative values
•of porosity
(Morris and Johnson, 196?)
move and the ability of a soil to transmit this water.
Equation 2.3 has become known as Darcy's Law, Eqn 2.3
Q = -k A (dH/dz)
where,
Q = volumetric flow rate (cm /day)
k = hydraulic conductivity (cm/day)
2 A = flow area (cm )
dH/dz = hydraulic gradient (dimensionless)
The negative sign indicates that water will flow in the
direction of decreasing hydraulic gradient.
Darcy's law was initially applied to flow of water
through saturated soil. In such a case the matric potential
is equal to zero and the hydraulic gradient is due only to
gravitational potential. With slight modification Darcy's
law can be used to describe flow in unsaturated soils as
well,
gqn 2.4
Q = -k A (dM/dz)
where,
dM/dz = moisture potential gradient
In this interpretation of Darcy's law, the hydraulic
gradient in Eqn 2.3 is replaced by the moisture potential.
Darcy's law ties together the concepts of a force or forces pushing water through a soil and the resistance
encountered against this flow. By evaluating the parameters
on the right-hand side of Eqn 2.4, it is possible to predict
the rate of drainage of water through soil.
D. SPECIAL CONSIDERATIONS
Clogging
In situations similar to that which is expected to be
found in a pit latrine a phenomenon known as clogging occurs. Clogging is the process of a soil losing its
ability to transmit water when saturated for long periods of time.
The mechanism(s) leading to a soil becoming clogged have
not been well described. The phenomenon is thought to be the result of several physical, chemical, and biological
factors. Most of the research that has been conducted on
clogging has been associated with trying to find ways of
improving septic tank operation. Clogging Mechanism
Clogging is usually thought of as a two or three step process (Kristian, 1981) . This is illustrated in Figure
2.3. The first decrease in the soil absorptive capacity
comes as air is entrapped in the soil pores when a soil is
c
u (0
Q.
3
ͣ
a
a:
Step 1
Step 2
Step 3
i.
Years
Pirure 2,3 Loss of hydraulic capacity
aerobic organisms and the soil environment turns anaerobic
(McGauhey, 1964).
The change from aerobic to anaerobic conditions signals the start of the second phase of clogging. During this
phase a gradual decrease in the soil's hydraulic
conductivity occurs due to two factors. One is the
formation of a biological slime in and on the soil's pores.
This slime has been found to contain a high concentration of
polysaccharides and polyuronides (Mitchell and Nevo, 1964)
indicating that rather than actual cellular material, this slime represents waste products of microbiological activity.
The second factor contributing to the loss of hydraulic
conductivity is thought to be chemical in nature (McGauhey,
1964) . Under anaerobic conditions soluble sulfide compounds
have a tendency to precipitate from solution. Such
precipitates, especially iron sulfide (FeS), have been found
in soils that were clogged.
The third and final phase in clogging is when an
equilibrium is reached. Complete loss of soil hydraulic conductivity seldom occurs with some pore space always
remaining open (Kristiansen, 1981).
gludge Pewfltecability
In assessing loss of liquid from a pit latrine, a second phenomenon that has to be considered is dewaterability,
which describes the the ability of a sludge to give up
There are two different ways of looking at the
dewaterability of sludge. One view is to consider that a
sludge somehow "holds onto" its water. This has been the
traditional approach in the sanitary engineering field
(Valdius, 1979). This has led to development of a test to
determine how much negative pressure is required to remove water from a sludge. Typical values for the specific
resistance of a sludge are shown in Table 2.5 (EPA, 1974) .
A second way of considering the dewaterability is to consider that the sludge represents a compressible type of
soil. If this is done, then the same nomenclature and
concepts used in soil mechanics can be applied to sludge dewaterability. This approach to explaining the mechanism
of sludge dewaterability is fairly new and still being
tested.
It is difficult to predict what influence the
dewaterability of the sludge in a latrine will have on the accumulation rate. Most of the work that has been done on
dewaterability has focused on the use of a vacuum device to
remove water from sludge. In the case of a latrine, the
only driving force is gravity. It is known that for any
sludge, its dewaterability can be affected by many factors,
including particle surface charge and hydration, particle
size, compressibility, sludge temperature, ratio of volatile
r
c
Table 2,5
SPECIFIC RESISTANCE OF VARIOUS TYPE SLUDGES (EPA, 197^)
Specific Resistance
Type Sludge (sec'/g)
Raw 10-30X10'
Raw (coagulated) 3-10X10'
Digested 3-30X10'
Digested (coagulated) 2-20X10''
Activated 4-12 X 10'
dewaterability of a particular sludge will be affected by
III. FIELD STUDY METHODOLOGY
3.1 Site Selection
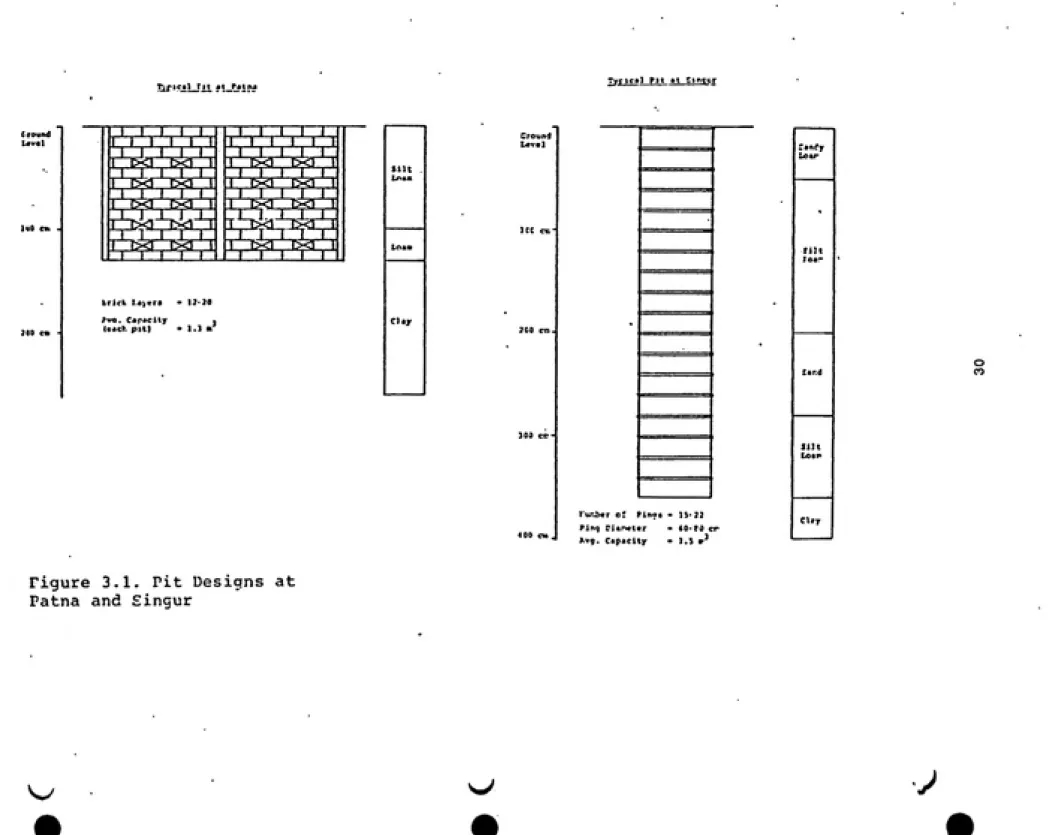
The research sites of Patna and Singur were selected by
the TAG South Asia office. Background information on the
research sites is provided in Table 3.1. Latrine types
constructed in Patna and Singur are shown in Figure 3.1.
3x2__WQfk Schedule
Approximately six weeks was spent at each of the
research sites. Four weeks of this time was devoted to the
study of individual latrines and two weeks to assessment of
local soil and hydrogeological conditions.
Ixi__Latcine Examinations
A protocol was developed for the examination of each
latrine over a two day period. The procedures followed on
each day are discussed in the same order as they were
performed.
3.3.1 Description of Pit Contents
A plexiglas sampling tube was used to take a vertical
section of the material in a pit. This tube was lowered
Crvund
Tificjil Tit «t ^ralnj
Tyipical Pit «t Sin^iir
^SJJ^J^ eSSS
-^.
^tTi
CiSCiSi:
Tn^-T
S'S?= -LJ "-UI
T~g^ ^
EZL"J.jri
B<i. "Txr
4wf
nii^ciEBOL
trick I.«>era - 12 20
Cl*y
Cround
level
Lo4r
Eilt
loir
ICC
cu->C0 rn.
ttr.i
>O0
c<^-Silt
400 cu,.
Pinq Djft-wter - tO-?0 cr
3
Cl.y
Avg. Capacity • 1.5 r
o CO
Figure 3.1. Pit Designs at
c
Figure 3.2
Sample of Pit Contents
c
L
Figure 3. 3 Gas
Production
Test in Progress
the tube with a hand pump. While maintaining the vacuum,
the sampling tube was lifted out of the pit and sealed. A sketch of the sample was made to record the different layers
(scum, supernatant and sludge) seen in the pit.
3.3.2 Gas Production Test
The sampling tube (with sample) was connected to a gas
manometer. The cumulative amount of gas produced was then
measured every thirty minutes for a four to six hour period. During the test, the sampling tube was kept in the pit to
maintain a constant temperature in the sample. The accuracy of the gas volume measurement was +2.0 cc.
3.3.3 In-situ Measurements of Sludge Characteristics
Three characteristics of the pit contents were measured
in-situ with portable field equipment. These were pH, temperature, and dissolved oxygen concentration. All measurements were made at mid-depth of the pit contents. . The pH was determined within ±0.1 pH units. The dissolved
oxygen concentration and temperature were determined to within +0.01 mg/1 and +0.1 C, respectively.
3.3.4 Pit Description
(
Figure
3.M-c
I
I
I
iimi^
1
Typical Pit in Patna
C
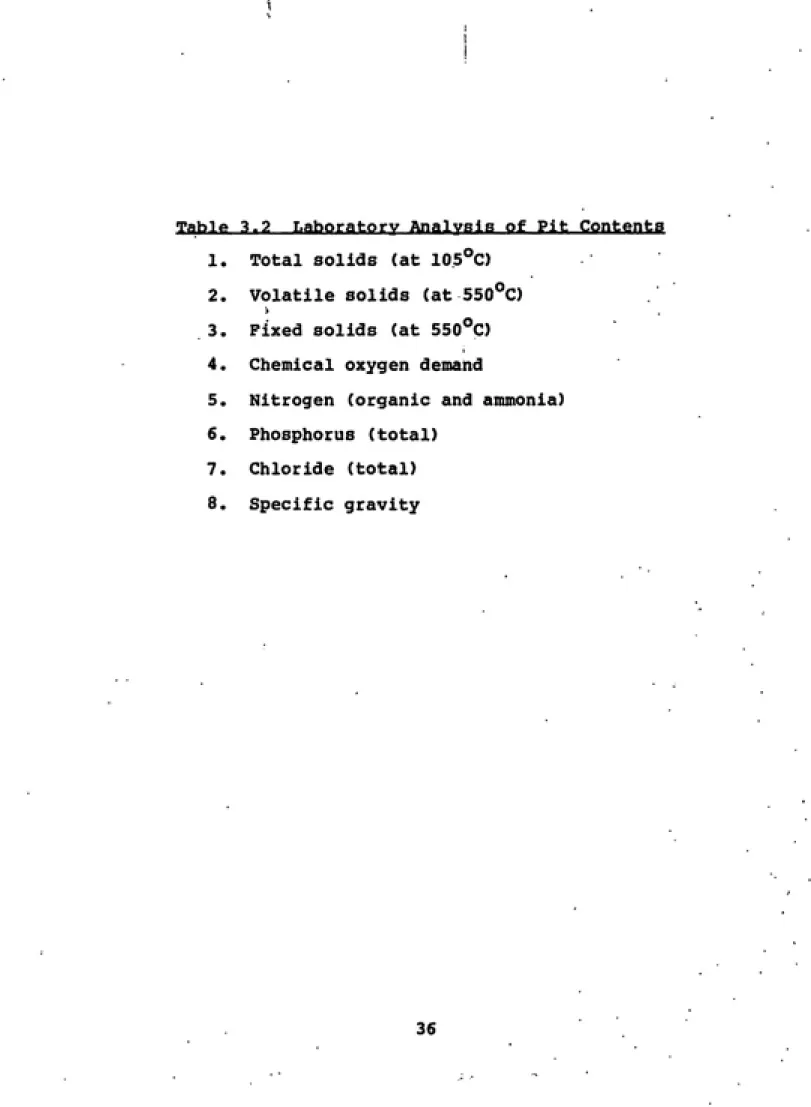
3.3.5 Sample Collection for Laboratory Analysis
To achieve a representative sample, material was drawn from three different points in a pit. The procedure used to take these samples was the same as that previously
described. The three samples of sludge were mixed in a bucket and a portion of the homogeneous material that
resulted from this mixing was then taken for analysis. A list of the constituents analyzed in the laboratory is provided in Table 3.2. (In Patna, the laboratory analysis
was conducted by the Public Health Institute of Bihar, and,
c
Figure 3.5
Typical Pit Latrine
in Singur
S5^<:.'^
Figure 3.6
Drainage Test in Progress
Table 3.2__Laboratory Analysis of Pit Contents 1. Total solids (at 105°C)
2. Volatile solids (at 550°C) 3. Fixed solids (at 550°C)
4. Chemical oxygen demand
5. Nitrogen (organic and ammonia)
6. Phosphorus (total) 7. Chloride (total)
3.3.6 Drainage Rate Measurement
The drainage rate from the pit was determined by
monitoring the drop in the surface level of the pit contents throughout a period during which the pit was not in use. In shallow pits (0-150 cm) a meter stick was used to measure
the pit content level relative to ground level. In deep
pits O150 cm) it was often not possible to reach the pit
content level with a meter stick. In this case, a float
connected to an aluminum rod was placed into the pit. The
rod extended from the float to the top of the pit. As the
surface level changed, the float and rod would drop. The change in the position of .the rod through time was used to measure the drainage rate. The cumulative decrease in the
surface level was appraised every thirty minutes for a
period of seven to nine hours.
3.3.7 User Survey
A survey was conducted to determine how the pit latrine
was used by its owners. The head of the household was
approached by the project team and asked to spend thirty to
sixty minutes answering a questionnaire. To verify the
answers given by the head of the household, a second
household member was also interviewed when possible.
The user survey was designed to address three issues:
1) demographic data - number, age, sex, and occupation
of people who had used the latrine over an extended
period (one month or more);
2) pit latrine history - dates of construction and emptying, and record of any modifications to the
pit; and
3) maintenance practices - substances used in cleaning,
amounts and frequency of application. 3.3.8 Soil Log
A site within five meters of the pit was chosen for sampling. Using a hand auger with a two inch bit, soil
samples were taken every fifty centimeters from ground level to a depth of one meter below the pit base. A record was made of soil color, moisture and texture. The groundwater level, if encountered, was noted. Soil color was identified according to the Munsell Color Code. A rough estimate was made of soil moisture by the feel of the soil. The soil was
classified into one of three categories - dry, moist and saturated. Soil texture (clay, silt, sand) was analyzed by
the touch method.
3.4 Area Tests
After the pit latrine examinations were completed,
assessment of soil properties at the study site was
description of the methods and materials used in these
analyses follows.
3.4.1 Soil Type (Particle Size Analysis)
Soil samples were taken at three different locations at
each research site. A complete vertical profile was taken at each location (samples taken at 50 cm intervals up to depth of 250 cm at Patna, and up to a depth of 400 cm in Singur). A particle size analysis on each of the samples taken was performed. ASTM Standard No. 422 was followed in
this analysis.
3.4.2 Soil Hydraulic Conductivity Assessment
As with the soil samples, testing of the hydraulic
conductivity was conducted at three different locations at each site. The hydraulic conductivity of each soil stratum, as identified in the soil type analysis, was measured.
A modified version of the Inversed Auger Hole Method
(Kessler, 1974) was followed in measurement of hydraulic conductivities. This method is very simple: A hole is
bored into the soil stratum to be tested, filled with water and then the rate of water loss measured. In the field
study, the hole was lined with a perforated PVC pipe to
prevent hole collapse. The method as described in the
literature does not include the use of such a pipe.
2l±^__WocK Swrnmacy
A total of thirty (equally divided between Patna and Singur) latrines were examined during the twelve-week
duration of the field study. A list of the data gathered on the individual latrines and for each research site is given
TABLE 3.1 Site Description
Pit Pesign
Number of pits
Shape Capacity Pit lining Depth Envitonmental Conditions Location Rainfall (annual) Temperature (avg. monthly) Soil type
Maximum ground water
level PATNA double rectangular 1-2 m-^ honey-combed brick 1-2 m Bihar 1100 mm 17-32°C
silty loam mixed
with sand layers Within 1 m of
surface in monsoon
single circular 1-2 m-* tile rings 3-4 m West Bengal 1582 mm 20-31°C sandy loam unknown Cultural Conditions Community setting User population
- Predominant religion
- Employment
- Number of users per
latrine Housing - Type Water supply - Electricity urban Sikhism service, small business 3-7
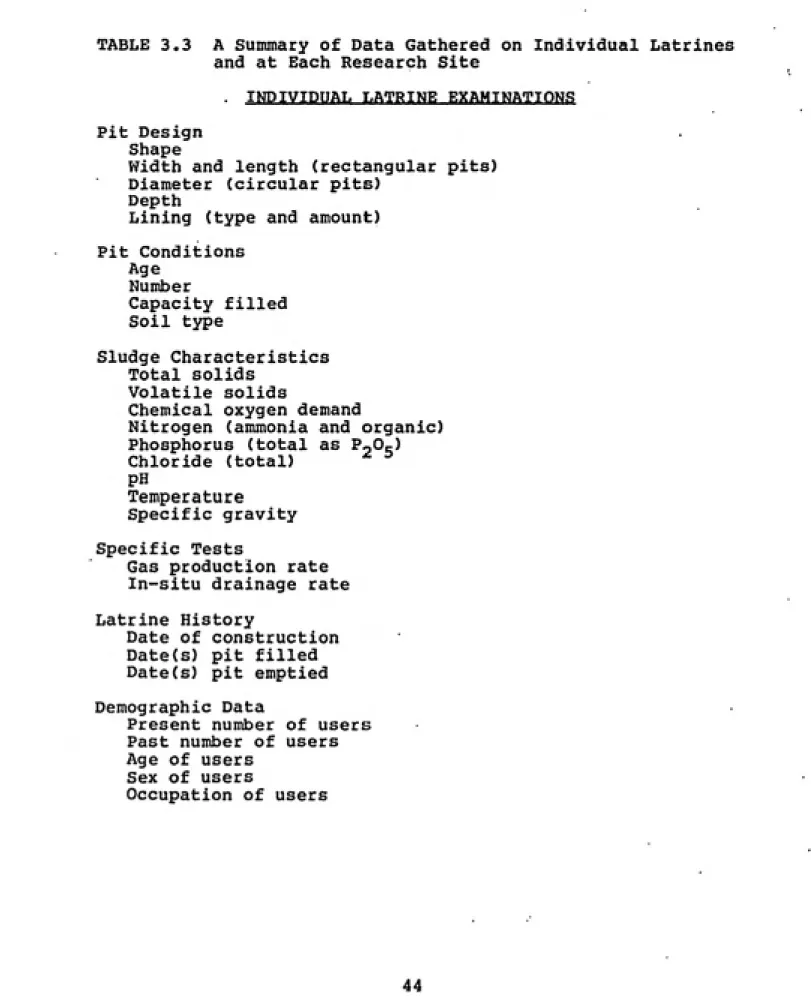
TABLE 3.3 A Summary of Data Gathered on Individual Latrines and at Each Research Site
. INDIVIDUAL LATRINE EXAMINATIONS
Pit Design Shape
Width and length (rectangular pits)
Diameter (circular pits)
Depth
Lining (type and amount) Pit Conditions
Age
Number
Capacity filled
Soil type
Sludge Characteristics
Total solids Volatile solids
Chemical oxygen demand
Nitrogen (ammonia and organic)
Phosphorus (total as P->Oc) Chloride (total)
PH
Temperature
Specific gravity Specific Tests
Gas production rate In-situ drainage rate Latrine History
Date of construction
Date(s) pit filled Date(s) pit emptied Demographic Data
Present number of users Past number of users
Age of users Sex of users
(TABLE 3.3 continued)
AREA INFORMATION
Soil Properties
Hydraulic conductivity
Particle size analysis Bulk density
Moisture
Cation exchange capacity
Color identification (Munsell Color Guide) Hydrological Conditions
Present groundwater level
Annual fluctuation (high and low)
Climatic Conditions (Five year period)
Temperature (monthly average)
Rainfall (monthly average)
IV. RESULTS
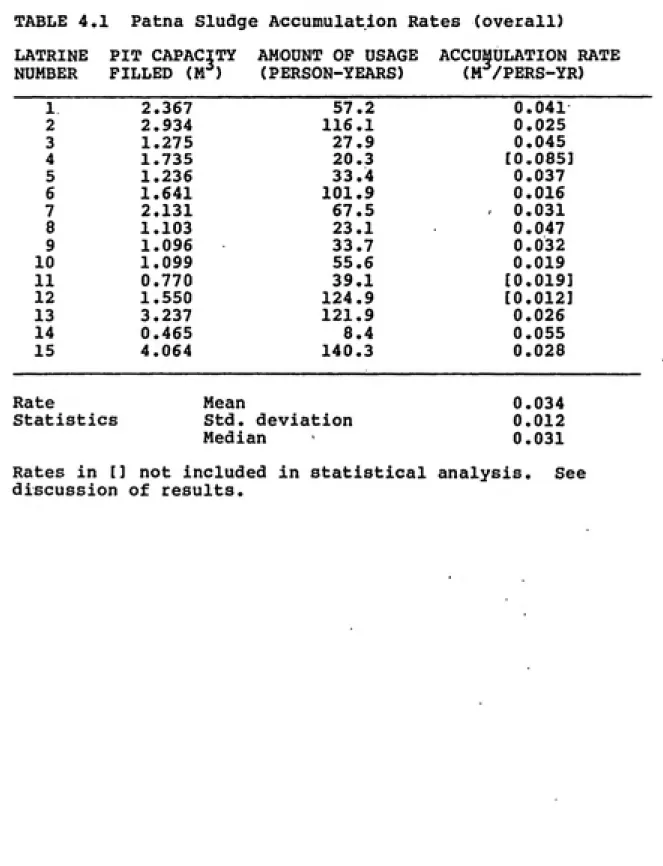
4.1 Sludge Accumulation Rates (SAR)
The overall sludge accumulation rates observed in the
Patna latrines are presented in Table 4.1. These rates are
referred to as "overall" rates because they are based upon
sludge accumulation (in both pits) and person-years of usage over the entire period of latrine operation.
The range of SAR values seen in the Patna latrines was
3
between 0.016 and 0.055 m /person-year. The overall SAR
3
mean was 0.034 m /person-year, with a standard deviation of
3
±0.012. The median value was 0.031 m /person-year. Latrines 4, 11, and 12 were not considered to be
"normal" latrines in terms of either their design and/or
operation. Because of this, their SAR values were not
included in the calculation of the rate statistics.
There were different specific reasons for not
considering the results from Latrines 4, 11, and 12. A
water tap drain ran close to Latrine 4. At the time of the
study, water was not entering the latrine's pit from the
drain but it appeared that this had happened in the past.
An unusually high accumulation rate was estimated to have
confirmation of the suspicion that drainage water had
entered the latrine.
The data from Latrine 11 was excluded from the rate
statistics because there was a large difference between the
design of the leaching pits of Latrine 11 and that seen in
the leaching of the other Patna latrines. The leaching pits of Latrine 11 were lined with solid brick and were circular
in shape. All of the other latrines in Patna were built
with rectangular pits lined with honeycombed brick.
Each Patna latrine was built with two pits, and» in
normal use, one pit was to be completely filled before
switching to the second pit. In Latrine 12, both pits of
the latrine had been used but not as called for in the
latrine design. In this latrine the owner had decided to
switch pits before the first pit was completely filled. The
amount of sludge present in the older pit could be measured
but it was impossible to judge how much volume reduction had
occurred due to the loss of liquid and the settling of the pit contents since the time the pit was last used. The
accumulation rate shown in Table 4.1 is based upon the
sludge volume found in the older pit at the time of the
TABLE 4.1 Patna Sludge Accumulation Rates (overall)
LATRINE PIT CAPACITY AMOUNT OF USAGE ACCUMULATION RATE
NUMBER FILLED (M^) (PERSON-YEARS) (M /PERS-YR)
1 2.367 57.2
2 2.934 116.1
3 1.275 27.9
4 1.735 20.3
5 1.236 33.4
6 1.641 101.9
7 2.131 67.5
8 1.103 23.1
9 1.096 33.7
10 1.099 55.6
11 0.770 39.1
12 1.550 124.9
13 3.237 121.9
14 0.465 8.4
15 4.064 140.3
Rate Mean
Statistics Std. deviation
Median
0.041 0 .025
0.045 10 .085]
0 .037 0 .016 0 .031 0 .047 0 .032 0 .019
[0 .019] [0 .012] 0 .026 0 .055 0 .028
0 .034 0 .012 0 ,031
4.1.2 Patna Latrines ("Old" and "Operating" Pit Rates) In addition to looking at overall rates, individual pit
SAR rates in the Patna latrines were examined (see Tables
4.2 and 4.3). Pits were labeled "operating" or "old"
depending on their status at the time of the study.
"Operating" pits were defined as the pits in current use,
while "old" pits were defined as pits which had become full
and been put out of service. At the time the study was
conducted, one pit had been filled and the second was being
used in most of the Patna latrines.
The range of SAR "operating" pit rates was from 0.013
3
and 0.184 m /person-year. The "operating SAR mean was 3
calculated to be 0.047 m /person-year with a standard deviation of ±0.027. The median value was slightly below
3
the mean, at 0.043 m /person-year.
The SAR values observed in the "old" pits ranged from
0.013 to 0.052 m /person-year. The "old" pit SAR mean was
3
found to be 0.026 m /person-year with a standard deviation
of 0.017. The median SAR for the "old" pits was determined
3
to be 0.018 m /person-year.
Because of construction mistakes and/or lack of
information, "old" and "operating" rates could not be
determined in five of the twelve "good" Patna latrines. In
some of the latrines (nos. 5, 13, and 15), the leaching pits
had been interconnected either through the pit wall or with
a pipe. In this case it was not possible to distinguish
TABLE 4.2 Patna Sludge Accumulation Rates (in operating
pits) LATRINE NUMBER PIT CAPACITY FILLED (M^)AMOUNT OF USAGE (PERSON-YEARS)
SAR(MSD) (M-^/PERS-YR)
1 1.053 32.1 0.032
2 0.794 7.6 0.104
6 0.521 15.7 0.033
7 0.886 17.5 0.050
8 0.531 12.3 0.043
10 0.520 12.0 0.043
12 0.775 56.9 0.013
14 0.465 8.4 0.055
Rate Statistics Mean Std. deviation Median 0.047 0.027 0.043
TABLE 4.3 Patna Sludge Accumulation Rates (in old pits)
LATRINE PIT CAPACITY AMOUNT OF USAGE ACCUMULATION RATE
NUMBER FILLED (M"*) (PERSON-YEARS) (M^^/PERS-YR)
1 1.314 25.1
2 A 1.070 57.1
B 1.070 51.4
6 A 0.560 41.2
B 0.560 45.0
7 1.245 50.0
8 0.572 10.8
10 0.579 43.6
12 n/a n/a
14 n/a n/a
Rate Mean
Statistics Std. deviation
into both pits. In Latrines 3 and 9, the owners were unsure
of the date when one pit had become full and the second
started.
4.1.3 Singur (Overall Rates)
There was only one set of accumulation rates for the
Singur latrines as these latrines were constructed with only
one pit. The accumulation rates for the Singur latrines
represent the total volume of sludge accumulation divided by
the number of person-years of usage over the entire period
of a latrine operation.
The overall sludge accumulation rates determined for the
Singur latrines are presented in Table 4.4. The range of
3
SAR values was from 0.011 to 0.057 m /person-year. The mean
3
SAR was 0.029 m /person-year with a standard deviation of
3
±0.017. The median SAR was found to be 0.022 m
/person-year .
The sludge accumulation rates determined for Latrines 9,
12, and 14 were not considered to be representative and have
not been included in the calculation of the rate statistics.There are different reasons for rejection of the data. In
Latrine 9, the drainage pipe from the squatting plate to the
pit had broken and, hence, every time the latrine was
flushed, both excreta and earth were washed into the pit.
In the case of Latrine 12, it was not possible to
determine the depth of the pit. Two different measurements
TABLE 4.4 Singur Sludge Accumulation Rates (overall)
LATRINE PIT CAPACITY AMOUNT OF USAGE ACCUMULATION RATE
NUMBER FILLED (M^) (PERSON-YEARS) (M /PERS-YR)
__
0.042
0.057 0.011
0.011
0.018 0.020
0.054
[0.052]
0.021
0.049 [0.086]
0.022 [0.006]
0.020
0.029 0.017 0.022
Rates in [] not included in statistical analysis. See
discussion of results.
1 0.367 16.0
2 0.676 16.0
3 0.903 15.6
4 0.233 20.9
5 0.834 71.0
6 0.693 37.7
7 0.795 39.4
8 1.071 19.7
9 0.419 29.0
10 0.396 18.4
11 1.465 29.8
12 1.684 19.5
13 1.789 79.7
14 0.347 55.3
15 0.454 22.0
Rate Mean
Statistics Std. deviation
accurate when accumulation rates were calculated based on
their values.
An extremely low accumulation rate was found in Latrine
14. No clear explanation could be found for the low SAR
value and it has been rejected mainly due to the large
difference between its value and the SAR mean.
4.1.4 Experimental Error in SAR Value Measurements
There were three factors used to determine the sludge
accumulation rate in a given latrine. These were 1) the volume of accumulated sludge, 2) the number of people using the latrine on a regular basis, and 3) the time or period of
latrine use by these people. The latter two factors were
multiplied together to provide the amount of latrine usage
(person-years).
Sludge volume ercgc
The precision in the measurement of sludge accumulation
in a pit was taken to be ± 2.5 cm in any one direction. For
example, the volume of sludge in Patna Latrine 7 was
3
determined to be 0.886 m . This volume was based upon a pit
width, and length of 87 and 98 cm, respectively. The sludge thickness was measured to be 104 cm. Within the degree of precision used in the measuring the various factors, the actual volume could have been anywhere between 0.819 and
Latrine usage error
Unlike the measurement of sludge accumulation, which
could be based upon some sort of objective standard, the
amount of latrine usage had to be determined with a user
survey which by its nature was a subjective instrument. To
account for possible experimental error in the estimation of the amount of latrine usage it was assumed that the greater
the age of a latrine, the greater the chance of obtaining
inaccurate user information. With this in mind, a
progressive scale of error with age was set up. In this
system, the amount of usage as reported by the latrine
owners was assumed to be off by 10%, 20%, and 30% in
latrines which had been in operation from 0 to 2 years, 2 to
4 years, and 4 or more years, respectively. Combined error
Based on the assumptions made, it was possible to
prepare tables of "worst" case accumulation rates to examine
how much variability in these rates might have been due
solely to experimental error. This information is provided
in Table 4.5 and Table 4.6 for the Patna "operating" pits
and Singur latrines.
In these tables, the experimental error in the fourth
and fifth columns represents two different situations. In
the preparation of the "negative" column, it was assumed
that sludge accumulation had been overestimated and the
TABLE 4.5 Patna Sludge Accumulation Rates (in operating pits)
Possible Experimental Error
LATRINE PIT AGE SAB (MSD)
(M-'/PERS-YEAR)
EXPERIMENTAL ERROR (%)
NUMBER (YEARS) NEGATIVE POSITIVE
1 4.6 0.032 -27.5 51.4
2 1.1 0.104 -14.8 18.4
6 1.2 0.033 -15.8 19.7
7 1.8 0.050 -14.6 18,2
8 3.2 0.043 -22.7 34.6
10 3.0 0.043 -22.8 34.7
12 5.1 0.013 -28.5 53.4
14 2.3 0.055 -22.9 34.9
The "negative" experimental error represents the case in which the volume of sludge was assumed to have been
underestimated and the amount of usage overestimated. The
opposite situation was assumed in the case of the "positive'
error.
TABLE 4.6 Singur Latrines Accumulation Rates Possible Experimental Error
LATRINE PIT AGE SAS (MSD)
(M-^/PERS-YEAR)
EXPERIMENTAL ERROR (%)
NUMBER (YEARS) NEGATIVE POSITIVE
1 8.3 0.022 -35.3 67.6
2 8.3 0.042 -35.3 67.6
3 8.3 0.057 -35.3 67.6
4 8.3 0.011 -36.6 70.5
5 8.3 0.011 -35.3 67.6
6 8.2 0.018 -34.4 65.6
7 8.2 0.020 -33.9 64.6
8 8.1 0.054 -34.4 65.6
10 8.3 0.021 -33.6 63.9
11 8.3 0.049 -31.5 59.5
13 8.1 0.022 -33.6 63.9
15 8.2 0.020 -35.3 67.6
The "negative" experimental error represents the case in which the volume of sludge was assumed to have been
underestimated and the amount of usage overestimated. The
opposite situation was assumed in the case of the "positive"
accumulation rate would naturally be smaller than the
originally calculated rate. The opposite approach was taken
in the "positive" columnr where it was assumed sludge
accumulation had been underestimated and the amount of usage, overestimated.
The range of possible experimental error in most of the accumulation rates can be seen to be significant. The most
extreme case in Patna was in Latrine 12 in which the
possible error ranged from -29 to +55 percent. In the
Singur latrines there was less variability in the error because the latrines were approximately the same age. The
error calculations indicated that the Singur SAR values
could have been off by -30 to +70 percent.
4.1.5 Other Accumulation Rates
In most of the latrines examined in Patna and Singur,
three distinct layers of material were seen in the pits.
These layers corresponded with those that are typically
found in a sludge digester, i.e., scum, supernatant, and
sludge. Following traditional practice in the discussion of
latrine operation, the accumulation rates presented in
Tables 4.1 through 4.6 have been based upon the volume of
all material found in a pit. For comparative purposes,
"sludge" accumulation rates based solely on the volume of
the bottom solids layer found in the pits are provided in
TABLE 4.7 Sludge Characteristics
ITEM
PATNA
Chemical Composition
Solids, total (gm/kg)
-fixed -volatile
Chemical oxygen demand (gm/kg)
Nitrogen (gm/kg)
Organic (as NH--N)
Ammonia (as NH.-N)
Phosphorus, Total
(
pH
(as P2^5' gni/1^9)
2-54 3-222
5-460
24.0 67.0
182.0
SINCUR
MSSL. HEM
40-94 76.9 12-448 136.9
28-122 72.6
0.1-0.9 0.2 2.4-5.5 3.8
0.1-0.5 0.2 0.7-2.1 1.5
0.1-6.8 1.7 1.9-5.6 3.4
6.3-7.9 7.1 6.7-7.7 7.0
Temperature ( C) Specific Gravity
Physical Characteristics
°^^ 16-24 20.1 24-31 27.7
4.2 Decomposition Process
4.2.1 Sludge Characteristics
The range and mean values o£ the chemical composition of
the sludge found in the latrines examined are provided in
Table 4.7. The typical sludge was 10% solids and 90%
moisture by weight. The solid faction consisted, on the
average, of 20% organic and 80% inorganic matter. The concentrations of the different solid components (total,
volatile, nitrogen, and phosphorous) found in the Patna
samples were generally lower than those of the same components in the Singur samples. The mean value of
chemical oxygen demand (COD) in the Patna samples (mean
COD-182.0 gm/kg) was, however, higher than that of the Singur
samples (mean COD-72.6 gm/kg).
A complete set of the laboratory results for each sludge
sample taken is provided in Appendix A, In general, the
variability seen in the composition data was great. Because
such large variability was not expected, control experiments
to evaluate data variability due to sampling technique and
analytical error were not conducted.
Because of the unusually large data variation, the
sludge composition data was considered to be of limited
usefulness. It is presented here to serve as a data base
for future studies. Methods for determining sampling and
analytical errors are suggested in the discussion chapter of
4.2.2 Gas Production Rates
Evidence of microbial conversion of solid organic waste
to gaseous products was seen in each of the latrines
examined. Gas was collected from all the sludge samples at
rates of between 0.002 to 3.014 liter/hr/kg volatile solids.
Gas production rates from each sample are provided in
Appendix A. There was little consistency in the gas
production data. It is not know whether this is because the sampling technique was unsatisfactory or the volatile solids analyses were incorrect. The problems encountered in the
sludge composition analysis have already been mentioned.
Methods of improving the gas production measurement and
assessing the sampling variability are also considered later in the report in the discussion chapter.
The large degree of variability found in both the gas
production and sludge composition data precluded the
analysis which was planned of the possible relationships
between gas production rates and physical/chemical
parameters.
4.3 Drainage Process
4.3.1 Soil Properties
The soil particle size analyses confirmed the geological
a silt loam intermixed with layers of sand. The sand layers
were the result of the movement of an ancient riverbed
through the area, A complete set of the soil particle size
analysis is provided in Appendix A.
Testing of the hydraulic conductivity in the different
solid layers indicated that the conductivity of the soils
surrounding the Patna latrines was lower than that of the
soils surrounding the Singur latrines. Individual
"equivalent" hydraulic conductivities were calculated for
soil around each latrine based on Eqn. 4.1. Equation 4.1
Equivalent Soil Hydraulic Conductivity
(Todd, 1980)
k-eqiv = ^^ ^ ^^
zi
where k-eqiv = equivalent hydraulic conductivity, (m/day), ki = hydraulic conductivity in soil stratum, i,
(m/day),
zi = horizontal thickness of soil stratum, i, (m).
The average equivalent hydraulic conductivity found for soil surrounding the Patna latrines was 0.59 m/day. The average equivalent hydraulic conductivity found for the Singur latrines was 1.16 m/day. The hydraulic conductivity
values measured in the different soil strata and individual
equivalent conductivities are presented in Appendix A.
4.3.1 Drainage Rate
Typical drainage curves observed in the latrines
/ 10 • - mo inn Mil X £r«» 8 * ftiwrnatSMt c 'i JO- >N,
^
e ». :«l)-'^-^.^^
3 5 M-«a . Il1u**7«> «• o-Ci-Ob««>rv«d r«in«rit i
TiM' (ͣinutrsl
0 100 700 )«•
1,0. \
V
A-•
^
• 20
-*
1
''^;:'—.
§etm
C 10 .
3
\
••^ • • 1 "• i M. iN
v„^
>la«1»' 40 . T*s^
•*
rmtftM
rii 10
Figure U,1 Typical drainage curves in
Patna and Slngur latrines
loss occurred in the first two hours of observationf
followed by little or no drainage after that time. Included on the graphs is a theoretical curve of liquid loss based on
the use k-eqiv values in Darcy's law.
To obtain a quantitative sense of what such drainage
patterns meant in terms of liquid loss, "effective"
hydraulic conductivities for each latrine were calculated
based on Eqn. 4.2.
Equation 4.2
"Effective" Hydraulic Conductivity
(Auger hole method [Kessler, 19741) r X ln(h(t.) + r/2) - In(h(t„) + r/2)
k-eff = __________i________________"
^n - 4
where k-eff = "effective" hydraulic conductivity (m/day),
r = pit radius (m),
h(t) == height of liquid in pit at time, t (m) , t. = initial time,
t„ - final time,n
In general, the "effective" hydraulic conductivities were lower than "equivalent" conductivities found in the surrounding soil. The average k-eff in the Patna latrines was 0.14 m/day compared to a k-eqiv mean of 0.59 m/day. In
the Singur latrines the average k-eff was 0.01 m/day. The
k-eqiv value for these latrines was 1.16 m/day.
A very wide range "effective" hydraulic conductivity
values were found. In some latrines there was up to a
the testing period and in other latrines there was no change
at all. Because of the large degree of variability the
k-eff values, these results were regarded with some
skepticism.
For future reference the "effective" hydraulic
conductivity values are provided in Appendix A. The
usefulness of the data as far as predicting the relationship
drainage rate and soil properties was thought to be somewhat
V. DISCUSSION
5.1 Sludge Accumulation Rates
5.1.1 SAR Data Variability and Sample Size
The first objective of the SAR project called for the determination of sludge accumulation rates in a number of pour-flush latrines. Implicit in this objective was a
desire to establish the "average" and range of accumulation
rates that can be expected in these latrines.
A summary table of the accumulation rate statistics is
provided in Table 5.1. In general, the different data sets are characterized by high standard deviations. It was
surprising to find such a large degree of variability in the
accumulation rate data. Since the range in a small sample
of a population is less than would be found in the
population as a whole, this implies that a very wide range
of accumulation rates is possible.
If discussion is limited to consideration of the overall Patna and Singur data sets, the "normal" range of
accumulation rates appears to be from 0.010 to 3
0.060 m /pers-yr. This range represents approximately from
"Sg*"* ͣ
Table 5.1 Summary of sludge accumulation rate statistics
Data
Set
Data Range of
Pts. SAR values* Median Mean ± S.D.
a) overall
b) "old"
c) "operating"
a) overall
12
8 8
12
0.016-0.055 0.031
0.012-0.052 0.018
0.013-0.014 0.043
0.034±0.012
0.026±0.017
0.047±0.043
0.011-0.057 0.022 0.029±0.017
*A11 rate statistices expressed in terms of m /pers-yr.
SAR = sludge accumulation rate
f
Figure 5,1A
Distribution of
sludge accumulation rate data in Patna
latrines
SAR mean
X= CDS'* m3/cap-yr
Std, Deviation
SD= 0,012
Figure 5#1B
Distribution of
sludge accumulation
rate data in
Singur latrines
SAR mean
X=0.029 m3/cap-yr Std, Deviation
SD=0,017 c o > +> a t o u 9 .Q E 3 <: c « o (J 4» CS o 14 « E •I k. k. 2
-.2 -1 X 12 SAR values
Std
Deviation
---1---1---1——I---2-1 XI 2
SAR values
Std,
Deviation
and Singur rate means. (This range also covers the
accumulation rates found in other studies.)
In trying to determine the true mean accumulation rate, it was necessary to see if the data are normally
distributed. Histograms for the Patna and Singur rates were
prepared and these are presented in Figures 5.1A and 5.IB.
The rate data was found not to have a normal distribution.
In both Patna and the Singur, the data was skewed in the
lower direction.
Because of the predominance of lower SAR values, use of the Patna and Singur SAR means to identify the "average" rate was not justified. Rather, a better measure of the
central tendency was thought to be the median. In general,
use of the median reduces the effect of extreme values in
trying to identify the central tendency. This appeared to
be the best approach in handling the accumulation rate data.
The median SAR values found in the Patna and Singur
3
latrines were 0.031 and 0.022 m /pers-year, respectively.
Considering both median values, the "average" accumulation
rate in pour-flush latrines appears to be approximately
3
0.025 m /pers-yr.
5.1.2 Comparison of SAR "Average" Rate to UNDP/TAG
"Effective" Capacity Factor
3
The "average" accumulation rate of 0.025 m /pers-yr. found in Patna and Singur is below both the "effective"
conditions (0.045 m /pers-yr) and for wet conditions
(0.066 m /pers-yr).
5.1.3 Experimental Error in SAR Values
The large degree of data variability raised concerns about the amount of experimental error in accumulation rate determinations. This concern generated an attempt to
predict the experimental error in the rates.
Predictions of the experimental error associated with
the accumulation rate determinations explained only a small
portion of the data variability. In the Patna latrines, the
experimental errors were, at most, fifty percent (see Table
4.5) of the measured rates. In the Singur latrines the
maximum experimental error was predicted to be approximately seventy percent of the measured rates (see Table 4.6). Such experimental errors alone could not explain the three- to
eightfold difference in accumulation rates that was observed
within the individual data sets. '
The technique used to assess the experimental error in the rate determinations is not considered to be entirely adequate. The main reason this is said is because there is no way of knowing whether the assumptions made in
association with usage error are correct or not (see Section 4.1.4). Ideally, there should be an objective means of
assessing the error in this factor. How this might done is
discussed later in the report in a section of "Improvements
1jl2__Sludge ACgumulation Rate;__Relationship to Pit Design.
Socio-economic and Environmental Factors 5.2.1 Latrine Model
To achieve the study objective of determining the
influence of different design and environmental factors on the sludge accumulation rate it was necessary to develop a framework for the data analysis. To this end a mathematical
model, based upon theoretical considerations was developed
to describe the accumulation process.
5.2.2 Model Derivation
a) Materials Balance
To begin with, it was assumed that the level of solids
reduction in a latrine would be high, i.e., eighty to ninety
percent. As human excreta contains five to ten percent
solids, this assumption meant that the accumulated volume of
solids would be relatively small and therefore could be
ignored. ^
The focus of the model development then became how to describe liquid accumulation in a latrine. Two processes
had to be considered; liquid input or loading by the latrine
users and liquid loss through drainage. In terms of a
simple material balance;
Equation 5.1
Materials balance for a pit latrine
Liquid Liquid Liquid Liquid loss
b) Description of Drainage Losses
Assuming that the per capita loading rate would be constant, the question of interest then became how to best describe the rate of liquid loss or drainage. Darcy's Law
was used for this purpose;
Equation 5.2 Darcy's Law
Q = k X A X dh/dl where, Q = drainage rate (volume/time),
k = soil hydraulic conductivity (length/time), A = flow area (length x length),
dh = hydraulic gradiant (unitless).
c) Assumptions
The interpretation of what soil hydraulic conductivity, flow area, and hydraulic gradient to use in Darcy's Law was
based on the following series of assumptions.
1) Hydraulic conductivity, k-effi the literature review had indicated that in septic tanks, it was quite common for a biological slime or clogging layer to build up on the liquid-soil interfaces of such systems. Studies of the clogging phenomena indicated that this layer grew very quickly and was very impermeable.
In the development of the model it was assumed that a
clogging layer would be formed on the sidewalls and base of
of this layer would be much lower than that of the
surrounding soil. To denote this difference it was decided that the hydraulic conductivity used in the model would have been identified as an "effective" hydraulic conductivity,
2) Flow area, A (t): In a latrine there are two
directions through which liquid can flow from the pit — horizontally through the pit sidewalls or vertically through the pit base. In the model it was assumed that flow would occur primarily in the horizontal direction. There are two reasons for this assumption. Latrines are normally built upon a firm base, i.e., clay or rock, both of which have low permeabilities. Secondly, over time a layer of solids tends to build up on the base of a pit. Experience has shown this
layer to be both compact and impermeable.
Another factor which had to be taken into consideration
was the presence of pit lining in latrines. To compensate
for the loss of flow area due to pit lining, a term, Y,
known as the "drainage ratio," was developed. This term is equal to the ratio of the unlined sidewall to total sidewall
area.
Based on the assumption that liquid loss would occur
primarily through the pit walls, the flow area for a latrine
e) Material Balance
Having adopted a means of estimating liquid losses it
was possible to write a more precise materials balance
Equation 5.5
Modified materials balance for a pit latrine
VOLt + t = VOLt + (NX) t - Q(t) t
where VOL = volume of sludge accumulated in pit at time, t, or t + t,
N = number of people using latrine,
X = per capita loading rate (volume/time),
t = change in time or period of latrine use (time),
Q(t) =» drainage rate at time, t (volume/time) .
or (k-eff)(Y)(2 r)(h(t)).
By placing VOLt on the left hand side, and dividing through by time. Equation 5.5 was put into a form which was
more recognizable:
Equation 5.6
VOLt + t - VOLt
________________= (NX) - (k-eff)(Y)(2 r)(h(t))
t
Taking the limit of Equation 5.6 as t — 0, yielded.
Equation 5.7
dVOL
____ = (NX) - (k-eff) (Y) (2 r)(h(t))
dt
After further manipulation. Equation 5.7 was put into
Equation 5.8
dh(t) (NX) (2Y)(k-eff)(h(t))
dt r^ r
Equation 5.8 was solved by the separation of variables technique and then integrated to provide a formula for the prediction of the sludge height in a pit at any timer t.
Equation 5.9
h(t) = Si X (exp^^^- 1)
C2
where CI = J!^ C2 = - ^Ilj^:^)
The final step in the model derivation was the
conversion of Equation 5.9 into a form that could be used
for the prediction of sludge accumulation rates. This was
done by multiplying both sides of the equation by the
2
factor, r /(N x t). The results of this manipulation are
shown in Equation 5.10.
5.2.3 SAR (MODEL) Presentation
Equation 5.10
Sludge Accumulation Rate Model (for circular pits) SAR (X)(r)
= [- ______________] [exp(-(2Y) (k-eff) (t)/(r))-l]
where SAR(MODEL) = predicted sludge accumulation rate (volume/capita x time))
X = per capita loading rate (volume/time), r = pit radius (length)
Y = drainage ratio (unitless),
k-eff = "effective" hydraulic conductivity (length/time),
t = pit age (time).
A similar model for the prediction of accumulation rates in
rectangular pits was also developed, with all parameters being the same as in Equation 5.10 except 1 and w which represent the
pit length and width.
Equation 5.11
Sludge Accumulation Rate Model (for rectangular pits)
-(X)(l X w) -(2y) (k-eff) CI + w) (t) SAR = [- ______________Ix (______________________)
(MODEL) (2Y)(k-eff)(t) [exp (1 x w) -1]
1jl2__Model Interpretation
Having developed the model, the first question asked
was, "What does the model suggest about the effect of different factors on SARs?"
According to the model, there are five parameters which
could affect the sludge accumulation rate — "effective" hydraulic conductivity, per capita loading rate, pit radius,
drainage ratio, and age. To examine wh^t effect each of these parameters had on the predicted sludge accumulation
Fle:ure 5»2A
Sludge accuniulatlon rate as predicted by model
versus pit age
u I a (S
o
E
Q O
<
0.200
0,160
0.120
r, 0,080.
0.040
Constants
-r-3
Xa 1,5 l/cap/day
Y= 0.03
rs 0,50 ra
k-eff s» 0,08 m/day
1.25. Figure 5.2B
Sludge height
versus
pit age
1.00
+>
•0 3
H
o
ͣ
p
0.75
0.50-0,25.
Constants
X= 1,5 l/cap/day Y= 0.03
r= 0.50 ra
k-eff= 0.08 m/day N= 5 capita
Equilibrium Level
0.'5 1.0 1.5 Pit Ap;g (yrs, )
5.3.1 SAR(MODEL) vs. Time
The most influential parameter in the model was found to be time. Its importance lies in its position in the model's exponential term. In latrines which have been used for
relatively short periods (0-3 years) , the exponential term
is large enough to have an effect on the sludge accumulation
rate. As time increases, however, the exponent approaches zero and the accumulation rate becomes almost constant.
This phenomenon is illustrated in Figure 5.2A, where sludge accumulation rate [SAR(MODEL)] versus pit age has been
plotted.
To understand the physical meaning of the SAR(MODEL) -time relationship, one must look at what happens to h(t), the height of sludge in a pit, through time. The latter
relationship has been plotted in Figure 5.2B.
What is seen in a graph of h(t) versus time is a sharp rise in h(t) during the first year of latrine operation. During this period, the rate of loading is greater than the
rate of loss and, hence, a net increase in sludge
accumulation occurs.
By the end of the first year, the sludge height (h(t)) reaches an "equilibrium" level. This level is the point, as represented by Equation 5.12, where the rate of liquid loss
Equation 5.12
Liquid
Loading Liquid Loss
XN = (k-eff)(A)(t) = (k-eff)(Y)(2 r)h(t)
3
where X = per capita loading rate (m /cap/day), N = user population size (capita),
k-eff = "effective" hydraulic conductivity (m/day), A(t) = flow area at any time, t (m ),
Y = drainage ratio (unitless),
r = pit radius (m),
h(t) = height of sludge in pit at time, t (m) ,
Given a certain value of k-eff, the sludge height will increase until the size of the flow area is large enough to allow liquid losses to equal liquid input. After this
point, the model indicates that there will be no further increase in the sludge height. This means the volume of
sludge also does not change.
5.3.2 SAR(MODEL) vs. Pit Radius
The relationship between SAR(MODEL) and pit radius is
plotted in Figure 5.3. What was found was a linear increase
in SAR(MODEL) as the pit radius increases. This is so
because pit radius is in the numerator of the model's first term.
Table 5.2 Effect of Changing Pit Radius on SAR(MODEL)
Net Effect
Change Height Flow Area Volume SAR(MODEL) in Radius h(t) (2 r)(h(t)) ( r'^)(h(t))
Fif^re 5,3
Sludge accumulation rate as predicted by
model versus
pit radius
Constants
X= 1,5 l/cap/day Yb 0,03
ta 3 yrs,;
k-eff= 0,08 m/day
0,100
^ 0.080
I p. u en E
0,060
c
o O.OUO
0.020 -j
o GO
0.2 0,k
Pit Radius
0,'6
»
0,8
-T---1.0
Model simulations show a small difference in the
relative effect of pit radius on sludge accumulation rates when different pit ages were assumed (see Figure 5.4) . The
reason for this was attributed to the position of the radius
in the exponential term of the model. As with timer the
value of the exponent, as determined by the pit radius and other factors, affects the SAR(MODEL) values in the early
stages of latrine operation.
5.3.3 SAR(MODEL) vs. Drainage Ratio
The simulations of the relationship between SAR(MODEL)
and the drainage ratio indicated that small changes in the
ratio could have significant effects on the accumulation
rate.
A plot of SAR(MODEL) vs. drainage ratio is provided in
Figure 5.5. The decrease in SAR(MODEL) with increasing
drainage ratio reflects the fact that less flow area is
required when the number of openings/unit area increases in
the pit lining.
As in the case of pit radius, a difference was noted in
the relative effect of the drainage ratio on SAR(MODEL) when
different pit ages were assumed (see Figure 5.6). Here
again the difference was attributed to the position of the
ratio in the exponential term of the model.
5.3.4 SAR(MODEL) vs. Per Capita Loading Rate
The relationship between SAR(MODEL) and the per capita
Sludge 6.ccumulation
rate as predicted by model versus pit ng^e
(different pit radii)
0.200
U
T 0.160
Pi ri
o
E
"" 0.120
<
C/}
0,080
0.040 -I
CM
GO
r= 0.70 r= 0.50
r= 0,30
Constants
X= 1.5 l/cap/day Y= 0,03
k-eff= 0,08 m/day
Pit Age (yrs.)
Fi/rure 5,5
Slude« accumulation
rat© aa predicted by
model versus
drainage ratio
Constants
X= 1,5 l/cap/day ra 0,50 m
to 3 yrs,
k-eff= 0,08 m/day
0.100
^ 0,080
r a
o en
3 0,060
c O.OilO
0*020 J
CO
00
T
0,02 0,0^ 0,06 Drainage Ratio
FlfTure 5,6
Sludge accumulation rate as predicted by model versus pi t ag-e
(different
drainage ratio)
Constants
X= 1.5 l/cap/day
r= 0,50 m
k-©ffnO*08 m/day
u
I
ft a
o
E
W Q O
en
0.200
-0,'l60
0.120
0,080
CCtO
a»
Y= 0,02 Y= 0,03
Y= 0.04
1 2 3
Pit Age (yrs,)
—r