This study appraises the e-NC initiative, an ongoing program in North Carolina to encourage individuals, businesses and public institutions in the state to use information technology, especially the Internet, to improve their economic conditions. The appraisal reviews the premise and the operating strategy of the program, finds both very sound, and suggests issues for future work.
Drawing on recent research, the e-NC Authority in future could advise businesses on the most promising information technology packages, and stress the importance of
reengineering business processes and workplace practices to reap the full benefits of information technologies. The Authority could also focus its limited advisory and extension resources on those sectors likely to contribute most to productivity growth. And finally, the Authority will need to address the issue of risk management in the face of information technology-related volatility of employment.
Headings:
Information Technology
Internet – Economic aspects
North Carolina – Economic conditions
DIGITAL DIFFUSION IN NORTH CAROLINA:
APPRAISING THE e-NC INITIATIVEby: Samira Fazel
A Master’s paper submitted to the faculty of the School of Information and Library Science of the University of North Carolina at Chapel Hill
in partial fulfillment of the requirements for the degree of Master of Science in
Information Science.
Chapel Hill, North Carolina April, 2004
Approved by:
Acknowledgements
In addition to the customary courtesy and respect due my advisor, Professor Paul Jones, I am truly pleased to record my lasting gratitude here for his expert academic advice and guidance. I shall continue to cherish the thoughtful comments and pointers he provided at all stages of this paper. I thank also my secondary advisor, Professor Deb Aikat, for his advice and assistance. For invaluable help in the administrative and editorial aspects of my endeavor, I am deeply indebted to Ms. Lucia Zonn, Graduate Student Services Manager, School of Information and Library Sciences. Finally I would like to thank my parents whose constant encouragement and support brought me this far.
TABLE OF CONTENTS:
TABLE OF CONTENTS:... 4
LIST OF TABLES:... 5
LIST OF FIGURES: ... 6
LIST OF ABBREVIATIONS... 7
I. INTRODUCTION ... 8
Identification of Issues... 9
Plan of Study... 10
II. INCEPTION AND OPERATIONS OF e-NC ... 11
Backdrop to e-NC Initiative... 11
Operations of the e-NC ... 14
III. AN APPRAISAL OF THE e-NC INITIATIVE ... 22
Program Premise ... 22
Propagation Strategy... 25
Issues for Future Work... 28
IV. SUMMARY AND CONCLUSION ... 34
BIBLIOGRAPHY... 37
APPENDIX A... 39
APPENDIX B ... 40
LIST OF TABLES:
Table 1: OVERVIEW OF e-NC OBJECTIVES AND ACTIVITIES ... 15 Table 2: GROWTHS OF PRODUCTIVITY AND GDP, U.S. 1989-2001... 24 Table 3: INDUSTRY GROUP CONTRIBUTIONS TO GROWTH OF LABOR
LIST OF FIGURES:
Figure 1: SELECTED ECONOMIC INDICATORS, U.S. AND NC, 1995-2000... 12 Figure 2: OUTPUT AND EMPLOYMENT GROWTH IN THE TOTAL ECONOMY
LIST OF ABBREVIATIONS
ADSL Asynchronous Digital Subscriber Loop DSL Digital Subscriber Loop
e-NC Logo of North Carolina’s e-NC Authority, charged to promote information technology and Internet use in the state.
FCC Federal Communications Commission GDP Gross domestic product
IT Information technology
LEG-UP Local E-Government Utilization Project M.I.T. Massachusetts Institute of Technology MCNC Microelectronic Center of North Carolina
NC North Carolina
RIAA Rural Internet Access Authority of NC, predecessor to e-NC Authority
TA Technical assistance
I. INTRODUCTION
In recent years, policies, programs and services for the diffusion of digital tools and skills in North Carolina have become closely associated with the e-NC initiative. The e-NC initiative is a current program to encourage individuals, businesses and public institutions in North Carolina to use information technology (IT), especially the Internet, to improve their quality of life and their economic prospects. Launched in spring 2001 by the Rural Internet Access Authority (RIAA), now called the e-NC Authority,1 the stated goals of the e-NC are to:
• make local, dial-up Internet access available statewide;
• inventory the state’s telecommunications infrastructure and services;
• establish model telecenters;
• provide public Internet access and computer training;
• promote increased Internet use and ownership of computer devices; and
• make affordable, high-speed Internet access available statewide.
Pursuing the above goals, the e-NC compiles a statewide inventory and carries out needs assessment of IT infrastructure and services. It also implements an active program
1
of raising IT awareness at community levels throughout the state. The work of the e-NC is described in the next section of this paper. The Authority does not itself engage in major investments or sales; these are the domain of the private sector. But the e-NC drive for a digital society is expected to have a pervasive and profound influence, changing the landscape of IT infrastructure in the state, altering industry and business structures and practices, reforming education, training and the skills mix of the labor force, and reshaping consumer habits. A task of such magnitude merits close appraisal, which is attempted in this paper by a review of some issues concerning the e-NC initiative.
Identification of Issues
When sanctioning the e-NC initiative, the General Assembly of North Carolina wanted the citizens of the state to keep pace with advances in IT and have access to IT as these technologies constituted a “key competitive factor for economic development…in the New Economy of the global market place” (NC State Legislature 1). To diffuse digital tools and skills, the legislature, the RIAA and the e-NC Authority chose an inclusive strategy involving industry and businesses, local communities and educational establishments. They also stressed market solutions (e.g., for rates, prices and
investments), as opposed to direct intervention. Given these policy choices, this paper addresses three related issues.
productivity and economic growth. After all, as documented later in the paper, there have been some prominent skeptics of this premise.
Second, the e-NC strategy of guiding and collaborating with businesses and communities is discussed. Here too, literature indicates divergent views on whether market autonomy or market intervention is appropriate.
Third, the paper looks at what course corrections and additional matters the e-NC could undertake. These would form suggestions and caveats to carry forward the
accomplishments of the Authority by way of a future agenda.
Plan of Study
II. INCEPTION AND OPERATIONS OF e-NC
At the time the e-NC initiative was inaugurated in 2000 (starting with the RIAA, see footnote 1), the U.S. economy and parts of North Carolina (for instance, the Research Triangle) had experienced a decade of huge outlays on IT infrastructure, equipment and software, accompanied by surging output. In the event, policy makers in many places came to consider IT vital to stimulating higher economic growth where such growth had been low. This appears to have been the case in North Carolina as a whole, providing the motivation to the e-NC initiative.
Backdrop to e-NC Initiative
While on aggregate the economy of North Carolina had performed well in the first half of the 1990s, it fell behind average U.S. performance during the second half, as illustrated in Figure 1. By the indicators depicted there, the rate of economic growth in the state plummeted from 1997, falling below the U.S. average by the year 2000. The rate of unemployment, while below the national average, rose in 2000. Per capita
incomes in the state had been growing at about the same rate as the country as a whole till 1997, but then fell below the national rate from 1998 onwards. Until 1997, the
Figure 1: SELECTED ECONOMIC INDICATORS, U.S. AND NC, 1995-2000
Economic Grow th
N.C. U.S. 2 3 4 5 6 7
1995 1996 1997 1998 1999 2000
pe rc ent Unemployment Rate U.S. N.C. 2 3 4 5 6
1995 1996 1997 1998 1999 2000
per
c
ent
Grow th of Per Capita Income
N.C. U.S. 3 4 5 6 7
1995 1996 1997 1998 1999 2000
per
c
ent
Population in Poverty
N.C. U.S. 11 12 13 14
1995 1996 1997 1998 1999 2000
per
c
ent
Source: Constructed from data in Appendix A.
The trends shown in Figure 1 represent even more telling economic events and social outcomes in the state during the period depicted. Owing to competition from overseas, hard times hit particularly North Carolina’s traditional processing and
manufacturing sectors, namely, lumber, furniture and fixtures, tobacco products, textile mills, apparels, paper and allied products. These sectors made up nearly a fifth of the state’s economy in the mid-1990s; and then, the demand for and real output of each were competed away over time so that, between 1994-95 and 2000-01:
• lumber dropped 6 percent;
• tobacco products dropped 56 percent;
• textile mill products dropped 23 percent;
• apparels dropped 35 percent; and
• paper and allied products dropped 13 percent.2
As markets were lost and outputs scaled back, business closings and permanent layoffs in the state rose two- to three-fold over the first half of the 1990s. Altogether, 1,677 businesses closed during 1996-2001, affecting 117,452 people. In the same period, 890 permanent layoffs were announced, affecting 78,408 people. The job losses blighted several counties and mill towns, for example, Cleveland, Edgecombe, Mitchell,
Rockingham, Robeson, Surry and Swain counties, and the town of Spruce Pine in Mitchell County.3
The immediate consequences of rising unemployment were marked increases in the state’s population in distress. By 2000, nearly 507,000 households were drawing food stamps, up from 407,000 in 1990, and over 1.2 million persons were eligible for Medicaid (government health program for the needy and disabled) in 2000, up from around 639,000 in 1990. The socially corrosive influences of economic hardships were in turn evident in recorded incidents of major crimes4 (around 400,000 in 2000, compared
2
Information derived from Regional Accounts data posted by the Bureau of Economic Analysis, an agency of the U.S. Department of Commerce, on its website http://www.bea.gov/bea/regional/gsp/.
3
Based on data from Labor Market Information posted on the Employment Security Commission of North Carolina’s website http://eslmi12.esc.state.nc.us/mls/index.asp.
4
to 355,000 in 1990) and family breakdowns (37,500 divorces in 2000, compared to 34,000 in 1990) within the state.5
Against the backdrop described above, law makers in North Carolina were persuaded from the experiences of other states and industries that new opportunities and greater prosperity were possible by way of high-tech enterprises and skills. Accordingly, they sought to revitalize the state economy for the long term by encouraging investments in IT facilities, and in training and education of the wider public in the use of computers, the Internet and related areas. In this way, the RIAA, and then the e-NC Authority, had its role and its work set out.
Operations of the e-NC
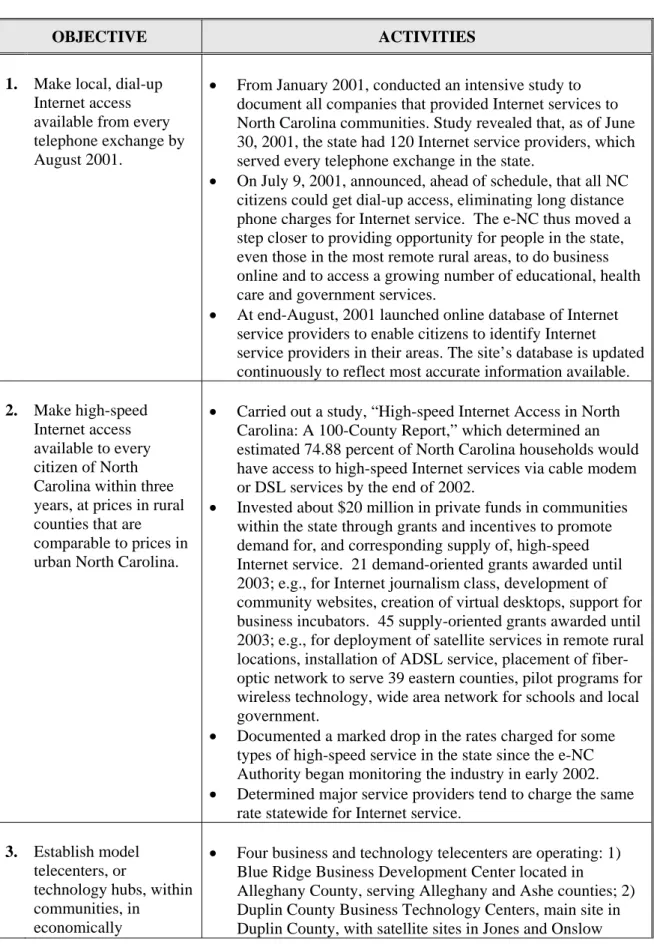
The e-NC and its volunteers operate in all 100 counties of the state, especially the 85 rural counties and distressed urban areas. The North Carolina House Bill 1194 setting up the e-NC Authority and Initiative defines a rural county as one with a density of fewer than 250 people per square mile based on the 2000 U.S. decennial census (less than 200 based on the 1990 census). Distressed urban areas are defined as those meeting at least one of the following requirements: (1) more than 10% of children enrolled in public schools meet the requirements for the U.S. Department of Agriculture’s Food Stamp program; (2) 10% of the citizens meet the guidelines for the U.S. Health and Human Services Department’s program of Temporary Assistance for Needy Families; or (3) 25% of children in the public school district meet the requirements for a federal government-sponsored free lunch. Table 1 below shows in schematic form what the e-NC initiative has actually done so far within North Carolina.
5
Table 1: OVERVIEW OF e-NC OBJECTIVES AND ACTIVITIES
OBJECTIVE ACTIVITIES
1. Make local, dial-up
Internet access available from every telephone exchange by August 2001.
• From January 2001, conducted an intensive study to
document all companies that provided Internet services to North Carolina communities. Study revealed that, as of June 30, 2001, the state had 120 Internet service providers, which served every telephone exchange in the state.
• On July 9, 2001, announced, ahead of schedule, that all NC
citizens could get dial-up access, eliminating long distance phone charges for Internet service. The e-NC thus moved a step closer to providing opportunity for people in the state, even those in the most remote rural areas, to do business online and to access a growing number of educational, health care and government services.
• At end-August, 2001 launched online database of Internet
service providers to enable citizens to identify Internet service providers in their areas. The site’s database is updated continuously to reflect most accurate information available.
2. Make high-speed
Internet access available to every citizen of North Carolina within three years, at prices in rural counties that are comparable to prices in urban North Carolina.
• Carried out a study, “High-speed Internet Access in North
Carolina: A 100-County Report,” which determined an estimated 74.88 percent of North Carolina households would have access to high-speed Internet services via cable modem or DSL services by the end of 2002.
• Invested about $20 million in private funds in communities
within the state through grants and incentives to promote demand for, and corresponding supply of, high-speed Internet service. 21 demand-oriented grants awarded until 2003; e.g., for Internet journalism class, development of community websites, creation of virtual desktops, support for business incubators. 45 supply-oriented grants awarded until 2003; e.g., for deployment of satellite services in remote rural locations, installation of ADSL service, placement of fiber-optic network to serve 39 eastern counties, pilot programs for wireless technology, wide area network for schools and local government.
• Documented a marked drop in the rates charged for some
types of high-speed service in the state since the e-NC Authority began monitoring the industry in early 2002.
• Determined major service providers tend to charge the same
rate statewide for Internet service.
3. Establish model
telecenters, or
technology hubs, within communities, in
economically
• Four business and technology telecenters are operating: 1)
Blue Ridge Business Development Center located in
OBJECTIVE ACTIVITIES
disadvantaged areas in the state.
counties; 3) Tri-County Community College Telecenter, main site in Cherokee County, with satellites in Clay and Graham counties; 4) Northeast Business & Technology Center located in Martin County, serving Martin and Bertie counties. The centers provide services indicated below.
• Technological resources and services, e.g., high-speed
Internet connections, video conferencing equipment, web site design and e-commerce assistance for local businesses.
• Training programs in computer and Internet use to prepare
local people for higher-skilled jobs and to support the needs of area businesses.
• Telework programs, which generate on-site employment
opportunities via contracts with businesses to provide services from the telecenter, or provide space or work stations for companies that wish to set up their businesses at the telecenter site.
4. Promote significant
increases in ownership of computers, related web devices and Internet subscriptions throughout North Carolina.
• Organizes e-communities program, an outreach effort to
mobilize local community support for, and involvement in, bringing high-speed Internet access and training to all areas of the state. Working in all counties, the main components of e-programs are: surveys to determine needs, grants to assist with community planning and implementation, awareness and training projects, and additional support services.
• Supports NC Tech Force Program, a corps of student
volunteers offering training and TA to communities.
• Funds computer and Internet training classes, and more than
135 public access sites to help state citizens become familiar with technology and build the computer and Internet skills needed for jobs.
• Promotes dialogue between citizens and Internet service
providers through the e-NC website’s high-speed service request page. This has allowed citizens to register requests for service and has enabled providers to gauge demand and expand service.
5. Provide citizens with
accurate, current and complete information through the Internet about the availability of present telecoms and Internet services, with periodic updates on the future deployment of new services.
• Maintains up-to-date inventory of state’s telecommunications
infrastructure and services, including: 1) information on location and services of phone, cable TV, cellular, fixed wireless and satellite companies; 2) the ability of radio and television stations to transmit digital data signals; and 3) federal, state or local government networks and applications that can be used by, or made available to, the public.
• Operates a continually updated interactive Web site,
OBJECTIVE ACTIVITIES
6. Promote government
Internet applications, e- Government, to make citizen dealings with government agencies and services easier and to facilitate delivery of government programs such as training, education and health care.
• Worked with the Center for Public Technology, UNC-CH, to
survey local governments’ computer and Internet use.
• With grant support from U.S. Dept. of Commerce, has
undertaken Local E-Government Utilization Project (LEG-UP), having the following milestones.
• Develop, test and train 55 local governments in the use of
web-based IT metrics/tools that can assist government managers in selecting and implementing new IT to improve the delivery of public services.
• Assist North Carolina local governments to develop
broadband-based effective, affordable and sustainable websites as a platform for local e-government and regional collaborations.
• Assist North Carolina local governments to obtain and
deliver interactive, transactional electronic applications that meet the needs and further the goals identified by their
communities.
7. Employ open
technology approaches to encourage all likely providers to participate in implementing high-speed Internet access with no technology bias.
• Played key role in forming N.C. Consortium of Internet
Service Providers.
• Encourages broad-based corporate participation by
representatives of various technology companies.
• Funds complementary, minor infrastructure projects that
utilize a variety of technologies to provide Internet service. (For examples, see second bullet in Activities column of Objective 2.)
8. Coordinate activities,
conduct and sponsor research, and recommend and advocate actions, including regulatory and legislative actions, to achieve mandated goals and objectives.
• e-NC Authority evolved into state contact point and lead
adviser to users and providers of IT.
• Periodic surveys and research carried out to assess
household, business and institutional attitudes to, and capabilities in, IT.
• Legal, Legislative and Regulatory Committee of the e-NC
Authority works with its Technical Committee and the state Utilities Commission on items such as cable franchise renewals, and on issues around tariffs, meet point billing, and volume purchasing for Internet service providers.
• As needed, investigates and advises on Internet technology
legislation at federal and state levels.
• Provides regular updates to state legislature through reports
to Joint Committee on Information Technology.
Briefly, Table 1 indicates that, through the e-NC initiative to-date, municipal and county authorities in the state have been assisted in their franchise negotiations with phone, cable and Internet service providers; county profiles have been drawn up indicating, for each, the high-speed Internet access facilities and corresponding prices; business and technology telecenters have been set up, along with many free public access sites; there are active community outreach efforts to mobilize support for and
involvement in bringing high-speed Internet access and training to all areas of the state; and there are widespread computer literacy classes run by trained high school and college students. Surveys and starts have been made to propagate IT potential and applications to the agriculture, local government and health sectors.
The e-NC initiative has secured the attention, endorsement and acclaim of national organizations, including the U.S. Department of Commerce and the National Association of State Chief Information Officers. As its annual report for 2002, and a personal interview with the current executive director, Ms. Jane Patterson, point out, the programs of e-NC are serving as a national blueprint for technology-led economic development activities (RIAA 2002, 3). The federal government showcased the e-NC in November 2002 at a roundtable which focused on the e-NC Authority’s inclusive and broad-based approach, which has led to early success.
At the end of 2003, just under two years since their launch, the centers had recorded the following achievements6:
• Number of rent-paying businesses/organizations located in telecenters: 23
• Number of jobs created: 199
• Number of training classes provided: 885
• Number of individuals receiving training: 10,651
• Number of individuals using public access to computers and the Internet: 50,977
• Number of clients who obtained technology or business services: 1,080.
The effectiveness or worth of e-NC may be gauged also by the large support it has obtained from the world of business. It began operating primarily using $30 million in private funds committed by its founding benefactor, MCNC, formerly the
Microelectonics Center of North Carolina, in 2000. Since then, some federal sources, and many hard-nosed businesses and other private organizations (over 75 contributors in 2002) have provided substantially more cash and in-kind support towards the work of the e-NC Authority. Business supporters, who generally take a hard look at recipients before committing corporate resources, have included Kerr Drug, hp invent, Dnet, Cisco Systems, Sprint, Lexmark, AOL/TIME Warner, Compaq Computer Corporation, IBM and Microsoft Corporation.
In regard to business support, it is noteworthy that phone and cable companies (Bell South, Verizon) and related trade associations (N.C. Telephone Alliance, N.C.
6
Telephony Industry Association and N.C. Cable Telecommunications Association) were important supporters of the RIAA, predecessor of the e-NC Authority. Yet during 2003, when the state legislature was discussing the three-year renewal of the RIAA (under the new name, the e-NC Authority), the phone and cable companies opposed the
reauthorization, presumably out of concern that a new Authority might levy charges on the companies, or interfere in their investment and pricing decisions. As it turned out, the N.C. House Bill 1194 gave no such powers to the e-NC Authority. Thereafter, according to a personal communication by its Executive Director, the e-NC Authority has continued working harmoniously with the phone and cable companies.
The full impact of the e-NC initiative, and its performance relative to such programs elsewhere, will be known only after the e-NC program is completed in 2006. Meanwhile though, as the preceding paragraphs note, the North Carolina experiment has delivered quickly several positive outcomes expected from using IT in business, local government, consumer and household activities. Without the e-NC initiative, the state’s track towards diffusion of IT and Internet connectivity could well have lagged.
the nationwide pace through June 2003, the latest month for which data are available.7 While this information does not establish the superiority of the e-NC over other
initiatives, it does suggest that, in part at least, the surge in North Carolina’s connectivity may be attributed to the efforts of the e-NC initiative.
For a balanced perspective on the work of the e-NC thus far, it should be noted that three short years’ work at the grassroots level cannot be expected to show up in accelerated growth of business and incomes all over the state even in normal times. And the past three years have not even been normal, for since the start of the e-NC initiative, the state’s economy has been depressed, as has been that of the whole country. These factors need to be remembered in appraising the e-NC initiative.
7
This information comes from a Federal Communications Commission (FCC) database, whose first data point is December 1999. Between December 1999 and December 2000, before the e-NC initiative, the number of high-speed Internet subscribers multiplied 2.6 times nationwide and 2.4 times in North Carolina. Since the launch of the e-NC initiative, from December 2000 to June 2003, such subscribers multiplied 3.3 times nationwide and 5 times in North Carolina. As a result, among the 49 states reporting, North Carolina moved up in the ranking of states by number of high-speed Internet subscribers, from 15th place in
III. AN APPRAISAL OF THE e-NC INITIATIVE
The e-NC initiative is assessed in this section by examining its underlying premise and strategy and then proposing some fresh aspects to consider in its work. In each case, reference is made to relevant arguments or empirical evidence in recent literature.
Program Premise
The e-NC initiative rests on the premise that IT enables individuals, businesses and, in the aggregate, entire industrial sectors and economies to increase their
productivities, outputs and incomes. To the extent the premise is true, the founders and followers of the e-NC initiative would be vindicated and the program of its work deemed valuable.
The phenomenal growth of investments in IT in the workplace since the 1980s gave rise to many enquiries on the relations between economic growth and use of IT. Early on, studies could not demonstrate confidently that IT had any significant positive impact on output growth (Brynjolfsson and Yang). In fact, the evidence was so thin that a Nobel prize-winner, American economist Robert Solow, popularized the so-called Solow productivity paradox in his famous quote “You can see the computer age
through, and as more and higher-quality data became available, better estimates have become available.
In recent years, there has been growing support for the notion that the absorption of IT into the economy and the increase in the number of workers who generate or use information products serve to increase output at the industry and aggregate levels. In Digital Economy 2003, the Department of Commerce asserts that the surge in U.S. labor productivity growth since the mid-1990s is attributable mostly to investment in and use of information technology. The current literature on IT and productivity has been surveyed and synthesized by Kevin Stiroh in Reassessing the Impact of IT and by Jason Dedrick and others in Information Technology and Economic Performance.
The results in Table 2 indicate that IT-intensive industries outperformed the less IT-intensive industries in the growth of productivity and output in each time period analyzed. Between 1989 and 2001 average productivity growth for all industries was
Table 2: GROWTHS OF PRODUCTIVITY AND GDP, U.S. 1989-2001
(Percent per Year)
Average Annual Growth of Productivity /a
Average Annual Growth of Gross Domestic Product Industry Group
1989-95 1995-01 1989-01 1989-95 1995-01 1989-01
IT-intensive 2.39 3.67 3.03 3.13 5.68 4.41
Less IT-intensive 0.00 0.83 0.42 1.80 3.09 2.44
All Industries 1.02 2.19 1.60 2.45 4.37 3.41
/a Productivity measured as output per full-time equivalent employee.
Source: U.S. Dept. of Commerce, Digital Economy 2003, Tables 4.1 & 4.2, p. 47 & p. 49.
1.60 percent. Average growth for IT-intensive industries for this period was 3.03 percent, far exceeding growth in the less IT-intensive industries, which averaged 0.42 percent. GDP growth averaged 4.41 percent a year in 1989-2001 in the IT-intensive industries, almost twice the 2.44 percent growth in the less IT-intensive industries.
Propagation Strategy
The North Carolina House Bill 1194, which created the e-NC Authority, directed the Authority to be a policy planning, advisory and coordinating body, as well as a motivator, on issues of Internet access and related IT for the state, especially for rural counties and distressed urban areas. The legislation specified that the Authority did not have the power of eminent domain8 or the power to set any tax, charge, surcharge, or fees on telephone or telecommunications services. Implementation of the e-NC initiative has followed the stipulated strategy of guiding, aiding and collaborating with private sector individuals, communities and businesses, as well as public institutions. In particular, there has been no interference with sales and markets for IT equipment and infrastructure in the state. The e-NC’s accomplishments to date attest to the suitability of its operating strategy.
The e-NC strategy of market autonomy, as opposed to market intervention, is supported widely in discussions of actions to narrow the digital divide (Compaine, 325-331). By this view, new and expensive technologies always start with those who find it highly useful and those who can simply afford it. Such an approach also benefits those who follow, since the early adopters pay higher per-unit costs that reflect lower
production volumes of manufactured products (such as personal computers) or start-up costs of services, such as high-speed Internet access. Then, as production and networks expand, unit costs decline and manufacturers and service providers are able to lower
8
prices, in turn availing such products and services to new customers. This view has detractors, though.
For instance, J. Wolpert maintains that, when it comes to IT, income inequalities constrain households and whole communities, the former in their ability to purchase and use high-speed Internet services and the latter in their capacity to own and control media enterprises (qtd. in Wilhelm 199). Hence, left to market devices, new information
technologies either bypass or merely trickle through low-income and other disadvantaged groups. Anthony Wilhelm too has argued that the market mechanism cannot be relied upon to bring about timely and equitable spread of digital technologies (214). He therefore suggests: (a) extending telecommunications discounts beyond schools and libraries to organizations such as the Boys and Girls Clubs, Computer Clubhouses and other community technology centers; (b) ensuring, through vouchers and subsidies, that householders can purchase information and communications services; and (c) having industry offer a percentage of gross receipts to be set aside to enable worst-off residents to connect to the network (Wilhelm 213-214).
percent in 2000.9 The rapid increase is said to have continued. With home computer prices now close to a decent color television set, and with advertiser-supported free access to the Internet (e.g., Juno.com, NetZero.com, Bluelight.com), such IT tools would be within reach of most households in the state. Hence subsidy may not be an issue.
By and large then, the strategy underlying the e-NC initiative matches pragmatic approaches that have succeeded elsewhere. Such approaches involve working with market mechanisms and the communities served. The positive effects of working with local communities are reiterated in a very recent report on the dissemination of IT capability by public libraries. The report, released by the Bill & Melinda Gates Foundation, in partnership with a number of national civic groups, finds that public libraries have helped close the digital divide by providing free, public access to
computers and the Internet, particularly for people without access at home or work (6-7). As the e-NC has found with its e-communities, NC Tech Force, telecenters and numerous other public access sites, the aforesaid report on IT in public libraries finds that: (1) computers are reaching disadvantaged groups consistently identified as lacking technology access and skills; (2) library patrons use the computers to learn basic
computer and Internet skills; (3) computer and Internet access allows patrons to keep in touch with family and friends, complete homework assignments, find job listings; and (4) the impact of library computers is especially pronounced in rural communities.
9
Among its communities, the e-NC has carried out periodic citizen surveys,
initially to find out what North Carolinians thought about the Internet and computers and, later, to find out how far North Carolinians had come in accepting and learning to use new technology. As these technologies spread, they also give rise to ensuing, or second-generation, issues that need to be considered in a refreshed agenda of future work.
Issues for Future Work
The e-NC initiative is currently midstream, considering it began in 2001 and is set to wind up in 2006. The Authority would obtain useful insights if it now carried out a client survey to gauge how its operations are perceived by the individuals, communities and institutions it has been serving. Such a survey might also gather suggestions for issues the Authority may address in its future agenda of work.
Some agenda items are suggested by recent research findings. An important finding is that while IT is important in raising business productivity, the technology makes its impact when accompanied by changes in other factors and practices (U.S. Dept. of Commerce, Digital Economy, 68-70). For example, new research10 shows that the contribution of computer networks to plant productivity depends on whether the networks are deployed in conjunction with software11 that coordinates multiple business processes (such as inventory, tracking and payroll) within and across establishments. Yet while 50 percent of U.S. manufacturing plants had computer networks in 1999, only 10 percent
10
Employing data from the 1999 Computer Network Use Supplement (CNUS) to the 1999 Annual Survey of Manufacturers in the U.S.
11
had that kind of software. In future, the e-NC could take such findings into account to advise businesses on optimal IT packages, comprising hardware and software.
As another example, research based on industry micro data for the U.S. during the 1990s suggests that IT needs to be used together with worker training and revised
workplace practices to yield productivity gains. This means that, in future, agencies like the e-NC need to stress that investment in IT hardware and software only is not enough; businesses must also reengineer themselves to reap the full potential benefits (Stiroh, The Economic Impact of IT 19).
Another nuanced finding comes from analysis of 1989-2001 data of U.S. non-farm business sector indicating that various industries using IT differed widely in their contributions to long-run labor productivity growth (U.S. Dept. of Commerce, Digital Economy 50-51). There is information there on which industry groups contributed positively, and how much, and which ones contributed negatively, to long-run growth of labor productivity. The results are reproduced in a modified form in Table 3.
guidance in choosing to allocate limited resources. This does not mean excluding or leaving behind any individuals, entrepreneurs or localities in digital diffusion efforts. Rather, it means guiding entrepreneurs on the relative returns to investing IT resources in
Table 3: INDUSTRY GROUP CONTRIBUTIONS TO GROWTH OF LABOR PRODUCTIVITY, U.S. 1989-2001
Industry Group /a Contribution
to Total
Percent Contribution
to Total
Manufacturing, Durable Goods 0.63 39
Wholesale Trade 0.44 28
Finance and Insurance /b 0.41 26
Transportation and Public Utilities 0.31 19
Retail Trade 0.19 12
Manufacturing, Non-durable Goods 0.08 5
Mining 0.02 1
Construction -0.04 -2
Services -0.43 -28
Total All Groups 1.60 100
/a See Appendix C for finer breakdown of the content of each group. /b Excludes real estate.
Source: Extracted and modified from U.S. Dept. of Commerce, Digital Economy 2003, Figure 4.4, p. 51.
various businesses. After all, households and entrepreneurs planning to spend time and money on IT would themselves want to profit the most (or lose the least) from their own precious resources.
Finally, as IT spreads wide and deep in North Carolina the e-NC Authority will likely be called on to address the issue of volatility of investments in, and the outputs of, IT-producing and IT-using industries, and that of the recently experienced
By some accounts, IT-intensive industries are thought to be more able to shed jobs during lean periods (U.S. Department of Commerce, Digital Economy 2003, 54).
Figure 2: OUTPUT AND EMPLOYMENT GROWTH IN THE TOTAL ECONOMY AND THE INFO. TECH. SECTOR, U.S. 1997-2003
Em ploym ent Grow th
T o t al Eco no my
Output Grow th
T o t al Eco no my
I T Sect o r
0 5 10 15 20 25
1997 1998 1999 2000 2001 2002 2003
IT Sect o r
-15 -10 -5 0 5 10
1997 1998 1999 2000 2001 2002 2003
Source: Constructed from data in U.S. Dept. of Commerce, Digital Economy 2003, Appendix Tables 1.3 and 2.1; and Statistical Abstract of the U.S., various years.
The Commerce Department (54) also reviewed the Occupational Employment Statistics12 for the recession year 2001. It found that the bulk of employment losses in a number of IT-intensive industries were in the categories of management; office and administrative support; transportation and material moving; installation, maintenance and repair; and computer and mathematical work. Office and administrative occupations were clearly IT-displaceable. Others, such as management, also seemed susceptible to IT-enabled cost-cutting in a recessionary environment. The rest have been susceptible to outsourcing and off-shoring.
12
Outsourcing and off-shoring of service-industry, technology-oriented jobs have intensified in recent years as the price of information technology has fallen and the Internet has spread widely around the world.13 To be sure, off-shoring, primarily to India, accounts for less than 10 percent of the 2.3 million jobs lost in the U.S. over the past three years. But there are two reasons for anxiety in this regard. One is that the trend is speeding up: 87,500 IT-related jobs off-shored in 2002 and 140,000 jobs sent out in 2003, a 60 percent jump in a year. The other is that more types of jobs are becoming susceptible to off-shoring. It is no longer just call center, data entry or computer code writing that can be sent abroad. By one estimate, 14 million out of around 130 million U.S. jobs at present have been identified as at risk of being sent abroad. The jobs at risk deploy IT and include, as examples:
• phone call center
• computer operator, data entry
• business and financial support
• paralegal and legal assistant
• diagnostic support services, and
• accounting, bookkeeping, payroll.
In view of the foregoing discussion, it would be worthwhile for the e-NC Authority to be prepared in future to advise state legislators and the working public on options available in case of significant IT-induced or IT-related downturns in the job market. The Authority of course cannot be expected to eliminate the IT-related volatility
13
and uncertainty in labor markets; it is, however, well qualified to assess IT-related risks and devise measures to manage those risks.
IV. SUMMARY AND CONCLUSION
Launched three years ago to help diffuse digital tools and skills in North Carolina, the e-NC initiative is an ongoing program to encourage individuals, businesses and public institutions in the state to use IT, especially the Internet, to improve their long-run
economic prospects. The program is managed by the e-NC Authority, successor to the RIAA, and is financed largely with corporate funds. It is set to wind up at the end of 2006.
Recent empirical evidence bears out the premise of the e-NC initiative that IT contributes significantly to higher productivity of business resources and thus higher economic growth. The strategy underlying the operations of the e-NC initiative matches successful pragmatic approaches adopted elsewhere. Such approaches involve working closely with market mechanisms and the communities served.
To date, the e-NC Authority has worked closely with IT providers and has launched successful community outreach programs to aid the spread of computer
the e-NC initiative cannot be assessed before its planned completion in 2006, some evidence suggests that the growth of high-speed Internet subscribers in North Carolina accelerated following the launch of the e-NC initiative in the year 2000 (see footnote 7). Furthermore, e-NC activities to date have been acclaimed by national organizations (U.S. Department of Commerce, National Association of State Chief Information Officers); they have been showcased by the federal government; and they have obtained significant cash and in-kind contributions from federal agencies and a variety of private
corporations.
The e-NC Authority would obtain useful insights if it now carried out a client survey to gauge how its operations are perceived by the communities and institutions it has been serving. Such a survey might also gather suggestions for issues the Authority may address in the coming years.
From another finding (Stiroh, The Economic Impact of IT 19), the e-NC needs to stress that investment in IT hardware and software only is not enough. Businesses have to use these together with worker training, revised workplace practices and reengineered processes to reap the full potential benefits.
In another investigation, the Department of Commerce finds that various industries using IT differ widely in their contributions to long-run labor productivity growth (Digital Economy 2003, 50-51). The e-NC Authority can use such information to focus its limited advisory and extension resources on those sectors likely to contribute most to productivity growth. This also means guiding entrepreneurs on the relative returns to investing IT resources in different businesses.
BIBLIOGRAPHY
Appalachian Regional Development Institute. Statewide Survey of Business Internet Usage in North Carolina. Raleigh, NC: Rural Internet Access Authority, 2003. Bill and Melinda Gates Foundation. Towards Equality of Access: The Role of Public
Libraries in Addressing the Digital Divide. February 2004. 12 March 2004. [http://www.gatesfoundation.org/nr/downloads/libraries/uslibraries/reports/toward sequalityofaccess.pdf]
Brynjolfsson, Erik and Shinkyu Yang. “Information Technology and Productivity: A Review of the Literature”. Advances in Computers 43 (1996) 179-214.
Business Connections: Using Technology to Build Successful Businesses. Raleigh, NC: Rural Internet Access Authority, n.d.
Cohen, Robert. Grid Computing: Projected Impact on North Carolina’s Economy & Broadband Use through 2010. Raleigh, NC: Rural Internet Access Authority, 2003.
Compaine, Benjamine M. The Digital Divide: Facing a Crisis or Creating a Myth?. Cambridge, MA: The MIT Press, 2001.
Dedrick, J., Gurbaxani, V., and Kraemer, K. “Information Technology and Economic Performance: A Critical Review of the Empirical Evidence.” ACM Computing Surveys. 35 (2003).
Mack, Reneta Lawson. The Digital Divide: Standing at the Intersection of Race and Technology. Durham, NC: Carolina Academic Press, 2001.
Making Connections: Using Technology to Build Successful Communities. Raleigh, NC: Rural Internet Access Authority, n.d.
North Carolina. State Legislature. Session Law 2003-425, House Bill 1194: An Act To Create the E-NC Authority to Continue the Work of the Rural Internet Access Authority. Raleigh, NC: General Assembly of North Carolina, 2003. Pittman, Charles. High Speed Internet Access in North Carolina: 100 County Report.
Raleigh, NC: Rural Internet Access Authority, 2003.
Rural Internet Access Authority. Acting Locally Connecting Globally. n.p., n.d. ---. Annual Report 2000. Raleigh, NC: Rural Internet Access Authority, 2001. ---. Annual Report 2001. Raleigh, NC: Rural Internet Access Authority, 2002. Rural Internet Access Authority Technical Committee. Broadband Briefs: Broadband
Technology Overview. Raleigh, NC: Rural Internet Access Authority, n.d. Shields, Rob. The Virtual. London, England: Routledge, 2003.
Solow, Robert M. (1987) “We’d better watch out”. New York Times Book Review, July 12. 36.
Stiroh, Kevin J., The Economic Impact of Information Technology. New York, NY: Federal Reserve Bank of New York, 2001.
http://www.ny.frb.org/research/economist/stiroh/ks_itimp.pdf
---. Reassessing the Impact of IT in the Production Function: A Meta-Analysis. New York, NY: Federal Reserve Bank of New York, 2001.
Thurow, Lester. Fortune Favors the Bold. New York, NY: HarperCollins Publishers, Inc., 2003.
Triplett, Jack E. “The Solow Productivity Paradox: What do Computers Do to Productivity?” Canadian Journal of Economics. 32 (1999) 309-334
United States. U.S. Department of Commerce. Economy-Wide and Industry-Level Impact of Information Technology. April 1997
United States. U.S. Department of Commerce. Digital Economy 2003. December 2003. Wilhelm, A., “From Crystal Palaces to Silicon Valleys: Market Imperfection and the
APPENDIX A
SELECTED ECONOMIC PERFORMANCE INDICATORS: U.S. AND NORTH CAROLINA, 1990-2000
Year GDP
Gross State Product
Unemployment
Rates Population in Poverty Per Capita Incomes (Billion $ in 2000 Prices) (Percentages) (Current Year $)
U.S. N.C. U.S. N.C. U.S. N.C. U.S. N.C.
1990 7113 163 5.6 4.2 NA NA 19,572 17,348
1991 7101 163 6.8 5.8 NA NA 20,023 17,784
1992 7337 170 7.5 6 NA NA 20,960 18,939 1993 7533 176 6.9 4.9 15.1 14.1 21,539 19,770 1994 7836 189 6.1 4.4 14.5 14.2 22,340 20,563 1995 8032 198 5.6 4.3 13.8 13.1 23,255 21,462 1996 8329 204 5.4 4.3 13.7 12.8 24,270 22,350 1997 8704 218 4.9 3.6 13.3 12.6 25,412 23,468 1998 9067 232 4.5 3.5 12.7 13.0 26,893 24,661 1999 9470 243 4.2 3.2 11.9 12.3 27,880 25,468 2000 9817 250 4.0 3.6 11.3 11.7 29,760 26,939
NA means Not Available On-line.
Sources: Bureau of Economic Analysis, www.bea.doc.gov, accessed Feb. 18, 2004; U.S. Census Bureau, www.census.gov, accessed Feb. 18, 2004;
Statistical Abstract of the United States, various years,
APPENDIX B
IT-INTENSIVE AND LESS IT-INTENSIVE INDUSTRIES
IT-Intensive Less IT-Intensive
Telephone and telegraph Personal services
Non-depository institutions Nonmetallic minerals, except fuels
Pipelines, except natural gas Legal services
Radio and television Miscellaneous repair services
Electric, gas and sanitary services Motor vehicles and equipment
Petroleum and coal products Stone, clay, and glass products
Oil and gas extraction Water transportation
Chemicals and allied products Health services
Transportation services Other services, n.e.c.
Depository institutions Insurance agents, brokers, and service
Holding and other investment offices Local and interurban passenger transit
Security and commodity brokers Trucking and warehousing
Motion pictures Fabricated metal products
Tobacco products Miscellaneous manufacturing industries
Metal mining Rubber and miscellaneous plastics products
Insurance carriers Textile mill products
Railroad Transportation Auto repair, services, and parking
Instruments and related products Retail trade
Wholesale trade Lumber and wood products
Transportation by air Hotels and other lodging places
Electronic and other electric equipment Leather and leather products
Paper and allied products Furniture and fixtures
Printing and publishing Amusement and recreation services
Industrial machinery and equipment Apparel and other textile products
Business Services Construction
Other transportation equipment Educational services
Primary metal industries
Coal mining
Notes:
1. The lists are ranked in order of decreasing IT-Intensity. The IT-Intensity of an industry was defined as the ratio of IT equipment per full-time employee in the industry to the overall average IT per full-time employee in all industries considered.
2. IT equipment covers computers and peripheral equipment, software, and other information processing equipment.
APPENDIX C
LIST OF U.S. ECONOMIC SECTORS AND SUB-SECTORS BY THE STANDARD INDUSTRIAL CLASSIFICATION SYSTEM
1Gross domestic product 2 Private industries 3 Agriculture, forestry, and fishing
4 Farms
5 Agricultural services, forestry, and fishing 6 Mining
7 Metal mining 8 Coal mining
9 Oil and gas extraction
10 Nonmetallic minerals, except fuels 11 Construction
12 Manufacturing
13 Durable goods
14 Lumber and wood products 15 Furniture and fixtures
16 Stone, clay, and glass products 17 Primary metal industries 18 Fabricated metal products
19 Industrial machinery and equipment 20 Electronic and other electric equipment 21 Motor vehicles and equipment
22 Other transportation equipment 23 Instruments and related products
24 Miscellaneous manufacturing industries 25 Nondurable goods
26 Food and kindred products 27 Tobacco products
28 Textile mill products
29 Apparel and other textile products 30 Paper and allied products
31 Printing and publishing 32 Chemicals and allied products 33 Petroleum and coal products
34 Rubber and miscellaneous plastics products 35 Leather and leather products
36 Transportation and public utilities
37 Transportation
38 Railroad transportation
39 Local and interurban passenger transit 40 Trucking and warehousing
42 Transportation by air
43 Pipelines, except natural gas 44 Transportation services 45 Communications
46 Telephone and telegraph 47 Radio and television
48 Electric, gas, and sanitary services
49 Wholesale trade 50 Retail trade 51 Finance, insurance, and real estate
52 Depository institutions 53 Non-depository institutions 54 Security and commodity brokers 55 Insurance carriers
56 Insurance agents, brokers, and service 57 Real estate
58 Non-farm housing services 59 Other real estate
60 Holding and other investment offices 61 Services
62 Hotels and other lodging places 63 Personal services
64 Business services
65 Auto repair, services, and parking 66 Miscellaneous repair services 67 Motion pictures
68 Amusement and recreation services 69 Health services
70 Legal services 71 Educational services 72 Social services
73 Membership organizations 74 Other services
75 Private households 76 Statistical discrepancy
77 Government
78 Federal
79 General government
80 Government enterprises 81 State and local
82 General government 83 Government enterprises
Source: Bureau of Economic Analysis