Scientia Iranica A (2020) 27(1), 159{176
Sharif University of Technology
Scientia IranicaTransactions A: Civil Engineering http://scientiairanica.sharif.edu
Water ow stabilization using submerged weir for
draft-tube reaction hydraulic turbine
A.M. Salih Ameen
a;, Z. Ibrahim
a, F. Othman
a, and Z. Mundher Yaseen
b; a. Department of Civil Engineering, Faculty of Engineering, University of Malaya, 50603 Kuala Lumpur, Malaysia.b. Sustainable Developments in Civil Engineering Research Group, Faculty of Civil Engineering, Ton Duc Thang University, Ho Chi Minh City, Vietnam.
Received 17 December 2017; received in revised form 20 January 2018; accepted 29 April 2018
KEYWORDS Numerical uid analysis; Hydropower sustainability; Water pressure and velocity;
Submerged weir; Reaction turbine.
Abstract. In turbine engineering, draft-tube downstream runs under extreme water ow pressure and velocity, causing vibration and pressure variation in dierent operation frequencies. The practical challenge of obtaining stabilized water ow is an ongoing domain of research. This paper investigates a proposition of applying a submerged weir at the downstream end of the draft-tube reaction turbine. The main goal of this research is to reduce variations in water ow pressure, velocity, and shear distribution in accordance with the eect of the upstream water level. Two types of turbines, including vertical Kaplan and Francis turbine units, are examined. ANSYS CFX software tool is used to build three-dimensionally (3D) numerical models for the Kaplan and Francis turbines by building a submerged weir at the outlet of the draft tubes based on three dierent height suggestions. The eect of the proposed submerged weir on the ow through these turbines is studied by considering the dimensions of their components including the penstock with inlets, spiral casing, shafts and blades, and the draft tube with outlets. The ndings of this research are signicant enough to solve the problem of negative pressure pulsation in the draft tube of Kaplan and Francis turbines types.
© 2020 Sharif University of Technology. All rights reserved.
1. Introduction
Powerhouses are among the main parts of dams that are used to generate low-cost hydroelectric power. The hydraulic characteristics of Kaplan and Francis turbine units [1] are identied that function as the main engine of a powerhouse. Kaplan and Francis turbines, which are classied as reaction turbines, are dicult to use under part-load operation because of pressure oscillation [2{4]. Studies on this topic have
*. Corresponding authors. Tel.: 0060 1125112953
E-mail addresses: [email protected] (A.M. Salih Ameen); [email protected] (Z. Mundher Yaseen) doi: 10.24200/sci.2018.50038.1476
presented solutions for the cavitation problem in draft tubes [5], the vibration eect in powerhouses caused by a running turbine, maximization of power generation, and generation of low-cost power [1,6].
Over the last decade, there has been a very notice-able development in the computational uid tools [7{ 9]. It has become very eective in performing a robust and reliable analysis of the ow pattern phenomenon inside the turbine structure. Based on the literature, numerous studies have been conducted by utilizing the aforementioned tools to simulate the ow behavior in the draft tube of a turbine and inspect the critical condition such as vortex rope and vibration [2,10]. Researchers have studied pressure pulsation in Francis hydraulic turbine units and discussed the cavitation phenomenon problem [11,12]. Jost and Lipej (2011)
built a 3D numerical model for a Francis turbine unit to predict vortex rope in the draft tube based on numerical ow analyses [13]. Two analyses with and without cavitation eects were performed. Another study performed a numerical analysis of cavitation turbulent ow in a Francis turbine under partial load operation using the k ! shear stress transport turbulence model in Reynolds-averaged Navier-Stokes equations [14]. Qian et al. (2007) simulated 3D multi-phase ow in a Francis turbine to calculate pressure pulsation in the spiral casing, draft tube, runner front, and guide vanes using fast Fourier transform [15]. The investigation of the hydrodynamic eects of pressure uctuation in the draft tube was studied [16]. The cause of the simulated rotor-stator interaction under partial load operation was investigated by analyzing the 3D transient-state turbulence ow simulation of a Francis tube. The 3D Navier-Stokes Computational Fluid Dynamics (CFD) solver ANSYS CFX was used to analyze ow through a vertical Francis turbine with dierent loads in situ. Lately, Luna-Ramrez et al. (2016) calculated pressure on the blades of a 200 MW Francis hydraulic turbine to locate failure on the blade surface based on CFD [17]. Recently, an attempt has been made to investigate the local wave speed and bulk ow viscosity in Francis turbine [18]. Moreover, several studies conducted the Francis turbine analysis through the advantages of computational features [19{23].
Other researchers have discussed pressure pulsa-tion in Kaplan hydraulic turbine units and presented methods to reduce the cavitation problem. Ko and Kurosawa (2014) evaluated and presented cavitation performance at a specic speed for a 400 MW Kaplan turbine using a nite volume method to solve the Reynolds-averaged Navier-Stokes equations combined with the Reynolds stress model [24]. The modi-ed Rayleigh-Plesset equation was usmodi-ed to model the collapse and growth of cavitation bubbles. Javadi and Nilsson (2014) adopted the renormalization group k " turbulence model combined with the Reynolds-averaged Navier-Stokes equations to analyze unsteady turbulent ow in a U9 Kaplan turbine model [25]. Analyses were performed on the uctuation of pressure in the draft tube, unsteady ow behavior, and cohesive ow structures. Another investigation was carried out on the runner outlet ow of a Francis turbine model using a two-component particle image velocimetry system [26]. The nding of the research proposed a particular shape that provides suitable optical access across the draft tube elbow. The characteristics of the ow pattern in a Francis turbine runner with a small opening valve using the Reynolds-averaged Navier-Stokes equations and the continuity equation were inspected [27]. The 3D unsteady turbulence ow throughout the entire passage of the turbine was simulated numerically based on the k "
two-equation turbulence model using the CFD software ANSYS Fluent. The nding of the study showed that a low-pressure zone expanded around the blades of the runner when the valve was closed, and velocity increased throughout the runner area. On the other hand, the eect of hydraulic instabilities on increasing the service lifetime of Francis and Kaplan turbines was accomplished [1]. In particular, Caishui (2012 built a mathematical model to study pressure distribution in the ow pattern inside the powerhouse of a hydropower station using a uid dynamics method (CFD) to de-termine the velocity distribution and pressure pattern distribution under three operating conditions: one-unit load, two-unit load, and full-load rejection [28]. The results of this study outlined good ow patterns at the inlet with steady water level uctuations. Many state-of-the-art studies on the pressure pulsation in the draft tube of Kaplan and Francis turbines rely on the same methods and analyses, yet use dierent models. Based on a comprehensive review of the article published [2], several researchers have suggested changes in turbine design to reduce the cavitation phenomenon and increase turbine eciency.
In the current work and to the best knowledge of the authors, construction of a submerged weir with three dierent heights (i.e., 1/6, 1/3, and 1/2 from the draft-tube outlet height) was suggested to decrease the pressure variation in the draft tubes of turbine units. The main enthusiasm for establishing this research results from the main concept of broad-crested weir that stabilizes the ow through the open channel [29,30]. Two reaction hydraulic turbines in two dierent embankment dams are selected as a real practical example to evaluate hydraulic performance. The hydraulic performances include pressure stability in the draft tubes of a vertical Kaplan turbine used in the Haditha Power Station and a vertical Francis turbine used in the Temenggor Power Station. A 3D numerical model with one turbine unit for each power-house is analyzed and simulated using ANSYS CFX software tool at dierent water levels (minimum to maximum). The discharge and hydraulic information was obtained from sites. Flow velocity, pressure dis-tribution, and shear wall distribution were determined in dierent loading cases using the k " turbulence model. The nite volume method was adopted, and the physical properties and ow characteristics of water were dened. The simulation results of the models de-termined the characteristics of the turbines obtained by running the 3D turbine models, which are changeable with respect to the upstream and downstream water levels and discharge ranges. This study provides a foundation for determining the hydraulic characteristic performance of reaction turbines to compare the two types of hydropower station: The Haditha powerhouse, which is an integral part of the dam body, and the
A.M. Salih Ameen et al./Scientia Iranica, Transactions A: Civil Engineering 27 (2020) 159{176 161
Temenggor powerhouse, which is separate from the dam body. A safe and low-cost method for generating hydroelectric power can be identied.
2. Dams and power stations description 2.1. Haditha Dam
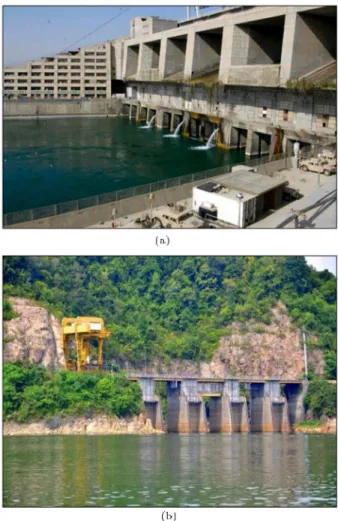
The Haditha Dam is an earth-ll dam located on the Euphrates River, north of Haditha City, Iraq. This dam is over 9 km long and 57 m high. The Haditha Dam was built to generate hydroelectricity and reg-ulate water for irrigation [31]. The power station in the Haditha Dam contains 6 vertical Kaplan turbines that can generate 660 MW of electricity. Figure 1(a) outlines the downstream ow of the Haditha Dam with 6 outlets opening into the spillway, 12 outlets opening into the power station, and 2 outlets opening into each turbine unit. Full details of the hydraulic characteristics of the dam are tabulated in Table 1. 2.2. Temenggor Dam
The Temenggor Dam is the third largest dam in Malaysia, and the Temenggor Power Station is one of the largest hydroelectric power generation facilities in Malaysia. It is located in Sungai Perak, approximately 200 km northeast of Ipoh state [32]. This rock-ll dam has a height of 128 m and a crest length of 537 m. The Temenggor Power Station has four vertical Francis turbines with an installed capacity of 348 MW; it is considered a separate powerhouse. Figure 1(b) illustrates the Temenggor Dam with eight outlets of the surface downstream power station. Table 1 presents the hydraulic information required to build the models for the turbine units.
3. Methodology overview
This reaction turbine represents one of the largest hydraulic structures. Water pressure applies force to
Figure 1. (a) Haditha Dam with spillway and
power-station outlets. (b) Downstream of Temenggor Dam with outlets of the surface power station.
runner blades, and this pressure decreases throughout the running turbine; this phenomenon was observed in both Francis and Kaplan turbines. The runner and the blades of the turbines are fully immersed in water and must be suciently strong to resist the operating
Table 1. The hydraulic information of Hadith and Temenggor power stations.
Properties Haditha Dam Temenggor Dam
Type of the dam Earthll Rockll
Location 341202500N; 422101800E 52402400N; 101180400E
Power house type Integral part of dam body Surface power house
Type of turbines Vertical Kaplan Vertical Francis
Number of units 6 4
Install capacity (MW) 6 110 = 600 4 87 = 348
Length of unit (m) 67.35 260
Penstock diameter (m) The details shown in Figure 2 5.5
Maximum U/S.W. L (m) 150.2 248.42
Minimum U/S.W. L (m) 129 236.5
D/S.W. L (m) 107.3 142
Maximum power house discharge (m3/s) 6 339 = 2034 4 100 = 400
Spillway Included dam body Separated structure
pressure. The hydraulic power of the turbine units is given in Eq. (1) [33,34]:
P = :Q:g:H:; (1)
where P is the water pressure, is the water mass density, Q is the water discharge, g is the gravity weight, H is the water head, and is the eciency.
The energy of turbines E is dened as can be seen in Eq. (2) [35]:
E =g:Ht=
p1 p2
+
V2 1 V22
2
+ g:(z1 z2)
+ head loss1 2; (2)
where Htis the water head of the turbine. Sections 1
and 2 are dened as the upstream and downstream measurements of the turbine, respectively. The de-termined behavior of the hydraulic turbine models is based on a dimensional analysis. Laboratory de-velopments and model tests can guarantee hydraulic behavior and turbine eciency [36]. The Interna-tional Electrotechnical Commission Standards 60193 and 60041 dene all the simulation rules [37,38]. The specic speed of a turbine based on these standards is dened in the following formula [34,39]:
nQE= n:
p Q
(gHn)3=4: (3)
Parameter nQE is known as the specic speed of
any type of turbines. Numerous statistical studies on reaction turbines have established a correlation between speed and net head for each type of turbine. The Schweiger and Gregory correlation formulas for Kaplan turbines are dened as follows [40]:
Kaplan nQE= H2:2940:486
n : (4)
The Lugaresi and Mass correlation formulas for Francis turbines are presented as follows [41]:
Francis nQE = H1:9240:512
n : (5)
The previous statistical formulas are used only for preliminary studies during the rst trial to estimate the specic speed so as to set the rotational speed of a turbine by applying Eqs. (3), (4), and (5), because there exists no clear relationship among the head, ow rate, and the rotational speed of the turbine.
4. 3D numerical nite element turbine model In this study, two dierent kinds of turbines (e.g., Kaplan and Francis) are selected as case studies to
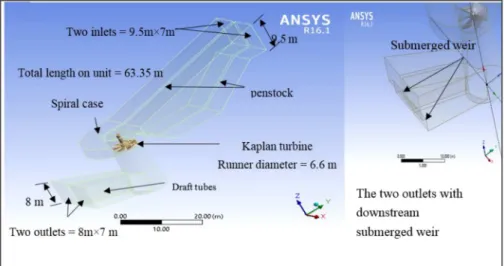
investigate. ANSYS CFX is used to simulate the 3D numerical nite-volume ow turbine models including the runner with blades, and the shaft is dened as the submerged rotational body. The water eld includes two rectangular inlets for the Kaplan turbine and one circular inlet for the Francis turbine. The penstock, the spiral casing, the draft tube, and two rectangular outlets are dened. The boundary conditions include the discharge range, the operating head, the rotational speed of the turbines, and the eect of gravity. The two models run with three submerged weirs are rec-ommended to be applied to the downstream of turbine units. Figure 2(a) and (b) display the dimensions of the units.
The ANSYS-CFX software used for simulation relies on the nite-volume method. The rst step of the calculation is study-state ow eld, and the result of this step represents the initial condition for the next step. The ow simulation of the Francis turbine unit was employed by using several meshes to test grid independence. After many iterations, the calculations reach convergence.
The second step in turbine modeling involves the selection of a suitable nite volume mesh. The grid of the turbine is made of tetrahedral elements after per-forming several trials to determine the smallest possible aspect ratio under 150 and the minimum orthogonal over 0.15 in accordance with ANSYS-CFX code recom-mendations, whereas analysis of hexahedral elements was performed for the walls' boundary layers. The nal mesh satises y+ < 200 around the boundary wall to
obtain the required pressure uctuation, following the previous research conducted by [42]. The runner, guide vanes, and draft-tube interactions were evaluated by slip meshes. This mesh slipping was observed to be interacting on the sides of interface. However, it is im-portant to ensure that velocity components, pressure, and ow ux are harmonious after interpolation. The meshing details used in the Haditha Kaplan turbine model and Temenggor Francis turbine are shown in Table 2. The number of elements and nodes used in Temenggor turbine meshing is higher than that in the Haditha turbine model, because the Temenggor turbine unit is longer than the Haditha turbine unit. The Francis runner with 12 blades has several ne details represented by small elements, whereas the Kaplan runner includes only 6 blades with details larger than those of the Temenggor runner turbine. The outlet boundary condition, the relative static pressure, turbulent kinetic energy, and its diusion rate are prescribed; no-slip boundary condition is applied to the wall, and standard wall functions are applied to the region near the wall [43]. Figure 3 illustrates the examples of the meshing details for the two-component turbine model.
mod-A.M. Salih Ameen et al./Scientia Iranica, Transactions A: Civil Engineering 27 (2020) 159{176 163
Figure 2. (a) 3D model of a vertical Kaplan unit with dimensions. (b) 3D model of a vertical Francis unit with dimensions.
eled using the incompressible continuity formulation and Reynolds time average. The mathematical expla-nation can be presented as follows [42]. The water ow continuity formula is:
@uj
@xj = 0: (6)
In addition, the momentum formula is presented as follows:
@u@ti+uj@x@ui j=Fi
@P @xi+
@2u i
@xj@xi
@(u0 iu0j)
@xj (7);
where: u0
iu0j = t
@ui
@xj +
@uj
@xi
2 3
pk + t@u@xi i
ij:
(8)
The double formula of the k " is: Dk
Dt = @ @xj
keff@x@k j
+ 2tSij@x@ui
j + "; (9)
DkDt = @x@
j
"eff@x@k j
+ 2C1"k"vtij@u@xi j
C2"" 2
k R; (10)
where ij =@u@xij +@u@xji, eff = t+ , and t= Ck"2.
R can be determined by: R = C
31
o
1 + 3
"2
Table 2. The meshing details of Haditha Kaplan turbine unit and Temenggor Francis turbine unit. Mesh details Nodes Elements Max. aspect ratio
Minimum orthogonal quality Haditha Kaplan:
Without weir Water 9785833 2174630 10.706 0.23896
Turbine 1808946 401988 10.706 0.23896
Weir height = 1.333 m Water 10371281 2304729 11.216 0.2315
Turbine 1835460 407880 11.216 0.2315
Weir height = 2.667 m Water 10480064 2328903 12.012 0.2325
Turbine 1843668 409704 12.012 0.2325
Weir height = 4 m Water 105932812 2354063 12.214 0.2385
Turbine 1844775 409950 12.214 0.2385
Temenggor Francis:
Without weir Water 97242978 2160955 14.561 0.17684
Turbine 2278165 506259 14.561 0.17684
Weir height = 0.5 m Water 10092938 2242875 14.263 0.18043
Turbine 2276995 505999 14.263 0.18043
Weir height = 1 m Water 10099465 2244325 14.202 0.18022
Turbine 2275416 505648 14.202 0.18022
Weir height = 1.5 m Water 10137060 2252680 13.94 0.19626
Turbine 2277756 506168 13.94 0.19626
where = Sk=", o = 4:38, C = 0:0845, =
0:012, C1"= 1:42 \originally in the model procedure",
C2" = 1:68, k = 1:0, and " = 0:769. Among these
constants used in the turbulence model, a properly chosen value of C1" is essential for improving the
prediction of the pressure variation. In the present simulation, C1" = 1:45 was selected based on the
preliminary computations.
5. Description of hydraulic simulation
It is essential to use the k " turbulence model to de-scribe the motion of turbulent ow through the turbine unit and, particularly, due to streamlines, to exhibit random motion near the turbine runner [25,27,44]. The 3D numerical model based on the nite volume method
is used to distinguish the unsteady incompressible ow inside the turbine unit running under the varying head and discharge ranges and to solve the Reynolds-averaged Navier-Stokes equations. All simulations were applied according to Computational Fluid Dynamic (CFD) approach. The hydraulic data (i.e., upstream and downstream water levels with discharge ranges) required to operate the model were collected from engineering reports that belong to the inspected case studies. Table 3 provides the hydraulic data of Ha-ditha and Temenggor powerhouses, and specic speed (column 3) is calculated using Eqs. (4) and (5) during the rst trial, respectively. Eq. (1) is used to calculate the hydraulic input power using the eciency of the Haditha Kaplan and Temenggor Francis turbines with results of 71.1% and 83.4%, respectively.
A.M. Salih Ameen et al./Scientia Iranica, Transactions A: Civil Engineering 27 (2020) 159{176 165
Figure 3. (a) 3D model of a vertical Kaplan unit with mesh details. (b) FE-Meshing of Haditha turbine runner model. (c) 3D model of vertical Francis unit with mesh details. (d) FE-Meshing of the Temenggor turbine runner model.
Table 3. Hydraulic calculations for Haditha turbine and Temenggor turbine units.
No. U/S.W. L (m) Net head (m) NQE Q (m3/s) P (KW) Vinlet (m/s) N (rad/s)
Haditha turbine
1 129 18.5 0.6779 100 25807 1.5038 3.3520
2 134.3 25.5 0.5800 118 41975 1.7744 3.3586
3 139.6 32.5 0.5155 136 61658 2.0451 3.3353
4 144.9 39.5 0.4689 151 83204 2.2707 3.3326
5 150.2 46.5 0.4331 169.5 109949 2.5489 3.2839
Temenggor turbine
1 236.5 94.50 0.2058 50.0 38658 2.1045 4.2671
2 239.48 97.48 0.2068 65.0 51840 2.7359 3.8491
3 242.46 100.46 0.2036 75.0 61644 3.1568 3.6091
4 245.44 103.44 0.2006 88.0 74474 3.7040 3.3551
5 248.42 106.42 0.1977 100.0 87068 4.2090 3.1687
1 236.5 94.50 0.2058 50.0 38658 2.1045 4.2671
The inlet velocity calculated by applying the continuity equation and rotational speed are veried using Eq. (3). The Kaplan and Francis numerical 3D models were run by dening the gravity weight of water and the turbine components including the
runner and the shaft as the submerged rotational bodies. The boundary conditions include inlet velocity (column 7 in Table 3), outlet pressure (1 atm), and the rotational speed of the turbine (column 8 in Table 3). The central axis turbine is dened as the rotational
Table 4. Total head and percentage of error calculation at the inlets of the Haditha turbine unit and the Temenggor turbine unit.
Haditha turbine No. U/S.W. L
(m)
Q (m3/s)
Vinlet
(m/s)
Pinlet
(KPa)
v2=2g
(m)
p= (m)
Z
(m) Ht= v
2=2g + p= + Z Error
(%)
1 129 100 1.504 232.61 0.115 23.71 105 129.08 0.06
2 134.3 118 1.774 284.32 0.160 28.98 105 134.39 0.07
3 139.6 136 2.045 338.15 0.213 34.47 105 139.93 0.24
4 144.9 151 2.271 368.30 0.263 37.54 105 143.06 1.27
5 150.2 169.5 2.549 469.50 0.331 47.86 105 153.44 2.16
Temenggor turbine No. U/S.W. L
(m)
Q (m3/s)
Vinlet
(m/s)
Pinlet
(KPa)
v2=2g
(m)
p= (m)
Z
(m) Ht= v
2=2g + p= + Z Error
(%)
1 236.5 50 2.105 208.98 0.226 21.30 215 236.53 0.01
2 239.48 65 2.736 236.04 0.382 24.06 215 239.44 0.02
3 242.46 75 3.157 261.53 0.508 26.66 215 242.17 0.12
4 245.44 88 3.704 293.85 0.699 29.95 215 245.65 0.08
5 248.42 100 4.209 326.38 0.903 33.27 215 249.17 0.30
axis, and the time step interval is 500 steps/0.01 s to show the rotational motion of the turbine around its axis [45]. The turbine models were runs several times by changing the rotational speeds of the turbine so that the pressure at the turbine inlets can be calculated; in doing so, the total head that is the summation of elevation head, velocity head, and pressure head, as tabulated in Table 4, is provided.
6. Application and ndings analysis
As a matter of fact, turbines are usually designed locally in accordance with the dam conditions such as upstream and downstream water levels, water dis-charge, and various other hydraulic and hydrological factors. In addition, the eciency of turbines is usually determined based on the o-design situation, especially in the case of the draft-tube turbine. Hence, there is a probability in its operation and reliability. Thus, it is necessary to maintain an optimal dimension of the individual components according to several properties (e.g., nature of ow and water level uctuation). The motivation of this research is to optimize the draft-tube outlet by minimizing pressure uctuation and uent water velocity. Practically, two types of operating turbines, including Kaplan and Francis, were demon-strated as an example of the inspected application. According to Table 4, the calculation of the total head
at the inlet of the Haditha and Temenggor turbine units is presented.
The phenomenon of uid pattern is highly com-plex; thus, the advantage of Computational Fluid Dynamic (CFD) can be used to analyze uid ow through the hydraulic mechanics concept. The CFD procedure is governed by dividing the uid ow into nite volumes that can be solved numerically. In this work, the computational process was obtained by running the turbine models with dierent water levels, as shown in Table 3. The input rotational speed of a turbine is used, and several runs are performed to determine the inlet pressure that provides the total head at the inlet closest to the upstream water level.
In addition, Table 4 outlines the error percentage between the total head at the turbine inlet estimated by running the numerical models and the upstream water levels. The results showed that the error percent-ages between the total head estimated at the turbine model inlets and upstream water level of Haditha and Temenggor dams equal 2.16% and 0.3%, respectively. The reason for this minor percentage of errors due to the head loss varies according to multiple forms of turbulent ow and the types of pipes (smooth or rough). In addition, the rotational speed of the turbine varies according to two variables (the head and discharge) obtained from the data source, where no clear relationship was found. The comparison of the
A.M. Salih Ameen et al./Scientia Iranica, Transactions A: Civil Engineering 27 (2020) 159{176 167
total head at the turbine model inlets and the upstream water level indicates a practical procedure to nd the accuracy of the model results.
Figure 4(a) shows the velocity distribution in Haditha turbine model with the maximum upstream water level = 150.2 m from the entrance up to the spiral casing; it varies due to changes in the cross-sectional area based on the continuity equation. Maximum velocities occur around the turbine runner because of the contraction of the cross-sectional area, and ow is limited to the lower part of the draft tube and the outlet based on the amount of water ow. Fig-ure 4(b) illustrates a constant velocity distribution at the penstock of the Temenggor turbine model with the maximum upstream water level of 248.42 m, because of the constant cross-sectional area. Velocity gradually increases from the spiral casing to the turbine runner because of the contraction of the cross-sectional area. Velocity is consistently distributed across the draft tube because of the rotational motion and the turbulent ow incident that occur following the running of the turbine. The results showed that the maximum water velocity occurred at the location of the turbine runner, namely 27.3 ms 1, for a discharge of 165.5 m3s 1 in
the Haditha turbine and 40 ms 1 for a discharge of
100 m3s 1 in the Temenggor turbine. Although the
discharge in the Haditha turbine is more than that in the Temenggor turbine, the cross-sectional area of the Haditha turbine is larger than that of the Temenggor turbine.
On the other hand, Figure 4(c) and (d) indicate the boundary pressure distributions in the Haditha and Temenggor turbine models, respectively. Here, the pressure distributions are proportional to the inverse of the velocity distribution based on the energy equation. The minimum pressure values are achieved following the running of the turbine; however, they do not reach cavitation pressure [46]. The velocity and pressure results obtained in the current study are in harmony with the modeling results accomplished by [39,44,47].
Figure 5(a) and (b) display the wall shear stress distributions of the Haditha and Temenggor turbine units running under the maximum head, respectively. The maximum wall shear stress values are 0.56 kPa and 1.5 kPa, which account for 0.1% and 0.25% of the maximum wall pressure values, respectively. Consequently, wall shear stress values are ignored in the process of transporting boundary pressure from the turbine models to the dam models for determining the eect of the running turbine on the dynamic behavior of the embankment dams, because their values are insignicant compared with the pressure values. Moreover, they depend on the pipe type (smooth or rough) and ow, which cannot be clearly identied.
Table 5 presents a comprehensively detailed vi-sualization of the attained results on the pressure
Figure 4. (a) Velocity vector of uid in the ow passage at t = 4:80 s in Haditha turbine unit. (b) Velocity ow lines at t = 4:80 s in Temenggor turbine unit. (c) Pressure distribution of uid in ow passage at t = 4:80 s in Haditha turbine unit. (d) Pressure distribution of uid in ow passage at t = 4:80 s in Temenggor turbine unit.
Figure 5. (a) Wall shear distribution of Haditha turbine unit. (b) Wall shear distribution of Temenggor turbine unit.
variation. The maximum dierences in pressure above and below the turbine runner exist at the following heads, 144.9 m and 248.4 m, for the Haditha and Temenggor turbine models, respectively, representing the best water level elevations to operate the turbines with the highest eciency. Table 5 outlines the results of pressure uctuation in both draft tubes (i.e., left and right). The attained results were determined based on running Haditha and Temenggor turbine models (i) without a weir as the rst case and (ii) with three weir heights suggested as the second case. The results showed a reasonable depth of the submerged weir that represents 16.7% and 33.33% heights of the actual draft-tube opening for Haditha and Temenggor tur-bines. The optimal submerged weir heights determined for Haditha and Temenggor were 1.3 m and 1 m, thus reducing the variation of the pressure.
In a more representable manner, the ow ve-locity (Figures 6 and 8) and ow pressure (Figures 7 and 9) on the left and right sides of draft tubes
were displayed graphically for Haditha and Temenggor turbine models, respectively. In Figure 6, the ow velocity phenomenon of Haditha turbine was simulated in accordance with two dierent dam components at the upstream water level and submerged weir depth. Based on Figure 6, it can be recognized that the velocity distribution on both sides of the draft tube became more regular with an increase in the submerged weir height. The maximum velocity range located in the turbine runner region and aected by the running turbine at the minimum and maximum upstream water levels with dierent submerged weir heights varies 7.6% and 4.1%, respectively. In terms of the water pressure value, Figure 7 indicates the water pressure uctuation as well as pressure uctuation in the dam's upstream water level and submerged weir depth. Based on the obtained results, building 1.333 m submerged weirs in the downstream of Haditha turbine units with the running turbine model at the minimum (129 m) and maximum upstream water levels (150.2 m) reduced the pressure dierence range between left and right sides by 23% and 1% from the total head, respectively.
Further, Temenggor turbine was modeled to in-vestigate the same two interesting measures of water velocity and pressure. Figure 8 presents the eect of the upstream water level and the proposed weir height to optimize suitable steady water ow. Based on the graphical visualization, the optimal velocity distribu-tion was attained when a 1-m submerged weir was built in the downstream of the turbine outlet. The maximum velocity range located in the turbine running region and aected by the running turbine at the minimum (236.5 m) and maximum (248.42 m) upstream water levels with changing built submerged weir height varies 26.7% and 10.9%, respectively. Water ow pressure is properly demonstrated in Figure 9. According to this gure, it can be concluded that running the tur-bine model at the minimum (236.5 m) and maximum upstream water levels (248.42 m) reduces the range of pressure dierences between left and right sides by 8.5% and 15.9% from the total head, respectively.
From the engineering perspective, the cost of initiating a submerged weir is a very important element that needs to be considered by decision-makers. Note that constructing the submerged weir is not an easy task. It requires careful investigation, inspection, and optimized structure building. This might be costly in economic terms; yet, it is a great proposition for the dam sustainability and stability and hydropower operation.
In conclusion, results showed that a reduction in pressure uctuation provides a uniform velocity dis-tribution according to the Reynolds-averaged Navier-Stokes equations at the draft tubes, especially for the high discharge rates. This uctuation is more visible in the Temenggor Francis turbine than in the Haditha
A.M. Salih Ameen et al./Scientia Iranica, Transactions A: Civil Engineering 27 (2020) 159{176 169
Table 5. Draft-tube pressure results of dierent suggested weir heights in Haditha Kaplan turbine units and Temenggor Francis turbine unit.
Haditha Kaplan turbine The top surface of cone and draft
tube connection Left side Right side
Dierence in pressure head
between L & R sides (m) U/S.W. L (m) Head (m) p (Pa) p= (m) p (Pa) p= (m)
Without weir 150.2 46.5 {37526 {3.8253 {18781 {1.9145 1.9108
139.6 32.5 {14033 {1.4305 {2298 {0.2343 1.1962
129 18.5 {5679 {0.5789 {699 {0.0713 0.5076
Weir height = 1.333 m 150.2 46.5 {12411 {1.2651 {5916 {0.6031 0.6621
139.6 32.5 {20255 {2.0647 {15899 {1.6207 0.4440
129 18.5 {5905 {0.6019 {6039 {0.6156 0.0137
Weir height = 2.667 m 150.2 46.5 33013 3.36524 {39305 {4.0066 7.3719
139.6 32.5 11481 1.17034 {23374 {2.3827 3.5530
129 18.5 {12293 {1.2531 {1850 {0.1886 1.0645
Weir height = 4 m 150.2 46.5 {42998 {4.3831 60855 6.20336 10.5864
139.6 32.5 {46978 {4.7888 66184 6.74659 11.5354
129 18.5 {22010 {2.2436 35709 3.64006 5.8837
Temenggor Francis turbine The top surface of cone and draft
tube connection Left side Right side
Dierence in pressure head
between L & R sides (m) U/S.W. L (m) Head (m) p (Pa) p= (m) p (Pa) p= (m)
Without weir 248.42 106.42 {13295 {13.553 {26501 {2.7014 10.8517 242.46 100.46 {79352 {8.0889 {69172 {7.0512 1.0377
236.5 94.5 {34499 {3.5167 {2722 {0.2775 3.2392
Weir height = 0.5 m 248.42 106.42 {13195 {13.451 {30594 {3.1187 10.3319 242.46 100.46 {49423 {5.038 {14575 {1.4857 3.5523
236.5 94.5 {24250 {2.472 {7019 {0.7155 1.7565
Weir height = 1 m 248.42 106.42 {39805 {4.0576 {43601 {4.4445 0.3869
242.46 100.46 {22171 {2.26 {23700 {2.4159 0.1559
236.5 94.5 {12194 {1.243 {5728 {0.5839 0.6591
Weir height = 1.5 m 248.42 106.42 56042 5.71274 {21568 {2.1986 7.9113
242.46 100.46 10345 1.05454 {7566 {0.7713 1.8258
236.5 94.5 2867 0.29225 {1572 {0.1602 0.4525
A.M. Salih Ameen et al./Scientia Iranica, Transactions A: Civil Engineering 27 (2020) 159{176 171
A.M. Salih Ameen et al./Scientia Iranica, Transactions A: Civil Engineering 27 (2020) 159{176 173
Kaplan turbine due to the operation under high water level of the upstream (Table 1). The recommended submerged weir construction at the outlet draft tube results from the uneven distribution of water ow, particularly in the diuser section. The ndings indicate an essential solution that can be implemented practically in the powerhouse system operation in order to maintain a steady draft-tube water ow with bal-anced water pressures on both sides of the outlet. The proposed submerged weir can be further extended to envisage the instabilities of turbine outlet components of the prototype o-design operation.
7. Conclusions
A draft tube is an essential component of the power-house system that is located in the downstream part of any type of reaction turbines. The main goal of this draft tube is to convert the high-impact kinetic energy at the turbine runner outlet into pressure energy grad-ually. However, the o-design of draft tube initiates turbulent and uctuating pressures during online oper-ation; hence, solving this problem is extremely signi-cant for the sustainability of dam body. This research provides a detailed analysis of the characteristics of the vertical Kaplan and Francis turbines inuenced by changing water levels and discharge ranges. The actual pressure of the water owing through the draft tube was computed qualitatively and presented numerically to verify the operation and performance of the turbines. The main determined pressures were obtained based on the proposition of a regulated submerged weir with dierent depths. The pressure distribution of unsteady ow was predicted through time-dependent running turbines. The change in the upstream water level head provides a guideline for ow characteristics in the turbine units. An increase in head per unit discharge is the main guideline for generating hydroelectric power. The construction of the power station far from the dam body increases the length of the waterway, leading to increased energy loss. However, a dam is protected from powerhouse vibration. The results of the proposed constructed submerged weir showed a very reasonable and reliable draft-tube turbine operation with very regular pressures. The Kaplan draft-tube turbine ts 1.33 m submerged weir height that comprises 16.7% of the total opening. On the other hand, the Francis draft-tube turbine was designed optimally with a 1-m sub1-merged weir height that represents 33.3% of the total tube open depth. The intended suggestion was very sucient and feasible for minimizing pressure uctuation on both sides of the draft tubes of the investigated case studies. This research can be further extended to inspect the role of stressed components in the draft tube walls and propose a systematic hydropower operation based on the computed stresses.
References
1. Pennacchi, P., Borghesani, P., and Chatterton, S. \A cyclostationary multi-domain analysis of uid insta-bility in Kaplan turbines", Mech. Syst. Signal Process, 60, pp. 375{390 (2015).
2. Kumar, P., Saini, R.P., Study of Cavitation in Hydro Turbines-A Review (2010)
3. Dixon, S.L. and Hall, C.A. \Hydraulic turbines", In: Chapter 9, Fluid Mechanics and Thermodynamics of Turbomachinery, pp. 361{418 (2014).
4. Grassmann, H. and Ganis, M.L. \On partially static Kaplan turbines", Renew. Energy, 30, pp. 179{186 (2005).
5. Luo, H.P. and Al-Dahhan, M.H. \Verication and
validation of CFD simulations for local ow dynamics in a draft tube airlift bioreactor", Chem. Eng. Sci., 66, pp. 907{923 (2011).
6. Fu, T., Deng, Z.D., Duncan, J.P., Zhou, D., Carl-son, T.J., JohnCarl-son, G.E., and Hou, H. \Assessing hydraulic conditions through Francis turbines using an autonomous sensor device", Renew. Energy, 99, pp. 1244{1252 (2016).
7. Glatzel, T., Litterst, C., Cupelli, C., Lindemann, T., Moosmann, C., Niekrawietz, R., Streule, W., Zengerle, R., and Koltay, P. \Computational uid dynamics (CFD) software tools for microuidic applications - A case study", Comput. Fluids, 37, pp. 218{235 (2008).
8. Wang, Z.J. \High-order computational uid dynamics tools for aircraft design", Philos. Trans. A. Math. Phys. Eng., Sci., 372, p. 20130318 (2014).
9. Lomax, H., Pulliam, T., Zingg, D., and Kowalewski, T. \Fundamentals of computational uid dynamics", Appl. Mech. Rev., 55, p. B61 (2002).
10. Thapa, B.S., Thapa, B., and Dahlhaug, O.G. \Empiri-cal modelling of sediment erosion in Francis turbines", Energy, 41, pp. 386{391 (2012).
11. Stein, P., Sick, M., Dorer, P., White, P., and Braune, A. \Numerical simulation of the cavitating draft tube vortex in a Francis turbine", In: 23rd IAHR Sympo-sium on Hydraulic Machinery and Systems, October 17{21, p. 4711 (2006)
12. Iliescu, M.S., Ciocan, G.D., and Avellan, F. \Analysis of the cavitating draft tube vortex in a Francis turbine using particle image velocimetry measurements in two-phase ow", J. Fluids Eng., 130, p. 21105 (2008).
13. Jost, D. and Lipej, A. \Numerical prediction of non-cavitating and non-cavitating vortex rope in a Francis turbine draft tube", Stroj Vestnik/Journal Mech. Eng., 57, pp. 445{456 (2011).
14. Zhang, H. and Zhang, L. \Numerical simulation of
cavitating turbulent ow in a high head Francis turbine at part load operation with OpenFOAM", Procedia Eng., 31, pp. 156{165 (2012).
15. Qian, Z.D., Yang, J.D., and Huai, W.X. \Numerical simulation and analysis of pressure pulsation in Francis hydraulic turbine with air admission", Journal of Hydrodynamics, Ser. B, 19(4), pp. 467{472 (2007).
A.M. Salih Ameen et al./Scientia Iranica, Transactions A: Civil Engineering 27 (2020) 159{176 175
16. Anup, K.C., Thapa, B., and Lee, Y.H. \Transient
numerical analysis of rotor-stator interaction in a Francis turbine", Renew. Energy, 65, pp. 227{235 (2014).
17. Luna-Ramrez, A., Campos-Amezcua, A.,
Dorantes-Gomez, O., Mazur-Czerwiec, Z., and Mu~noz-Quezada, R. \Failure analysis of runner blades in a Francis hydraulic turbine - Case study", Eng. Fail. Anal, 59, pp. 314{325 (2016).
18. Landry, C., Favrel, A., Muller, A., Nicolet, C., and Avellan, F. \Local wave speed and bulk ow viscosity in Francis turbines at part load operation", J. Hydraul. Res., 54, pp. 185{196 (2016).
19. Trivedi, C., Cervantes, M.J., Gandhi, B.K., and
Dahlhaug, O.G. \Experimental and numerical studies for a high head Francis turbine at several operating points", J. Fluids Eng., 135, p. 111102 (2013).
20. Gebreslassie, M.G., Tabor, G.R., and Belmont, M.R. \Numerical simulation of a new type of cross ow tidal turbine using OpenFOAM - Part II: Investigation of turbine-to-turbine interaction", Renew. Energy, 50, pp. 1005{1013 (2013).
21. Negru, R., Muntean, S., Marsavina, L., Susan-Resiga, R., and Pasca, N. \Computation of stress distribution in a Francis turbine runner induced by uid ow", In: Computational Materials Science, pp. 253{259 (2012)
22. Minakov, A.V., Platonov, D.V., Dekterev, A.A.,
Sentyabov, A.V., and Zakharov, A.V. \The numerical simulation of low frequency pressure pulsations in the high-head Francis turbine", Comput. Fluids, 111, pp. 197{205 (2015).
23. Trivedi, C., Cervantes, M.J., and Gunnar Dahlhaug, O. \Numerical techniques applied to hydraulic tur-bines: A perspective review", Appl. Mech. Rev., 68, p. 10802 (2016). DOI: 10.1115/1.4032681
24. Ko, P. and Kurosawa, S. \Numerical simulation of
turbulence ow in a Kaplan turbine -Evaluation on turbine performance prediction accuracy", IOP Conf. Ser. Earth Environ. Sci., 22, pp. 1{10 (2014).
25. Javadi, A. and Nilsson, H. \Unsteady numerical sim-ulation of the ow in the U9 Kaplan turbine model", 27th IAHR Symp. Hydraul. Mach. Syst., 22, pp. 1{9 (2014).
26. Favrel, A., Muller, A., Landry, C., Yamamoto, K., and Avellan, F. \Study of the vortex-induced pressure excitation source in a Francis turbine draft tube by particle image velocimetry", Exp. Fluids, 56, pp. 1{15 (2015).
27. Mo, Z., Xiao, J., and Wang, G. \Numerical research on ow characteristics around a hydraulic turbine runner at small opening of cylindrical valve", Math. Probl. Eng., 2016, Article ID: 6951839, 8 pages (2016).
28. Hou, C. \Three-dimensional numerical analysis of ow pattern in pressure forebay of hydropower station", Procedia Eng., 28, pp. 128{135 (2012).
29. Hager, W. and Schwalt, M. \Broad-crested weir", J. Irrig. Drain. Eng., 120, pp. 13{26 (1994).
30. Gonzalez, C.A. and Chanson, H. \Experimental mea-surements of velocity and pressure distributions on a large broad-crested weir", Flow Meas. Instrum, 18, pp. 107{113 (2007).
31. Khassaf, S.I., Abeed, K.R., and Saleh, L.A.M. \Pre-dicting the breach hydrograph resulting due to hypo-thetical failure of Haditha Dam", Jordan J. Civ. Eng., 5, pp. 392{400 (2011).
32. Yong Ooi Lin, C. \Autonomy re-constituted: Social and gendered implications of dam resettlement on the Orang Asli of Peninsular Malaysia", Gend. Technol. Dev., 10, pp. 77{99 (2006).
33. Vilanova, M.R.N. and Balestieri, J.A.P. \Modeling of hydraulic and energy eciency indicators for water supply systems", Renew. Sustain. Energy Rev., 48, pp. 540{557 (2015).
34. Samora, I., Hasmatuchi, V., Mnch-Allign, C., Franca, M.J., Schleiss, A.J., and Ramos, H.M. \Experimental characterization of a ve blade tubular propeller tur-bine for pipe inline installation", Renew. Energy, 95, pp. 356{366 (2016).
35. Li, Q.F., Quan, H., Li, R.N., and Jiang, D.J. \Inu-ences of guide vanes airfoil on hydraulic turbine runner performance", In: Procedia Engineering, pp. 703{708 (2012).
36. Iryo, T. and Rowe, R.K. \On the hydraulic behavior of unsaturated nonwoven geotextiles", Geotext. Geomem-branes, 21, pp. 381{404 (2003).
37. Feintuch, P. \The international electrotechnical vo-cabulary of the international electrotechnical commis-sion", Meta, 34, pp. 539{541 (1989).
38. Becker, D. \Harmonizing the international electrotech-nical commission common information model (CIM) and 61850", Electr. Power Res. Inst. (EPRI), Tech. Rep., 1020098 (2010).
39. Muis, A., Sutikno, P., Soewono, A., and Hartono,
F. \Design optimization of axial hydraulic turbine for very low head application", In: Energy Procedia, 68, pp. 263{273 (2015).
40. Slootweg, J.G., de Haan, S.W.H., Polinder, H., and Kling, W.L. \General model for representing variable speed wind turbines in power system dynamics simu-lations", IEEE Trans. Power Syst., 18, pp. 144{151 (2003).
41. Heckelsmueller, G.P. \Application of variable speed operation on Francis turbines", Ing. e Investig, 35, pp. 12{16 (2015).
42. Liu, S., Li, S., and Wu, Y. \Pressure uctuation
prediction of a model Kaplan turbine by unsteady turbulent ow simulation", J. Fluids Eng., 131, p. 101102 (2009).
43. Li, J., Yu, J., and Wu, Y. \3D unsteady turbulent simulations of transients of the Francis turbine", In: IOP Conference Series: Earth and Environmental Science, p. 12001, IOP Publishing (2010).
44. Zhang, H. and Zhang, L. \Numerical simulation of cavitating turbulent ow in a high head Francis turbine at part load operation with OpenFOAM", Procedia Eng., 31, pp. 156{165 (2012).
45. Wei, S. and Zhang, L. \Vibration analysis of
hy-dropower house based on uid-structure coupling nu-merical method", Water Sci. Eng., 3, pp. 75{84 (2010).
46. Caupin, F. and Herbert, E. \Cavitation in water:
A review", Comptes Rendus Physique, 7(9{10), pp. 1000{1017 (2006).
47. Wei, S. and Zhang, L. \Vibration analysis of
hy-dropower house based on uid-structure coupling nu-merical method", Water Sci. Eng., 3, pp. 75{84 (2010).
Biographies
Ameen Mohammed Salih Ameen is currently a PhD candidate at University of Malaya and an As-sistance Lecturer at the Water Resources Engineering Department, Faculty of Engineering, University of Baghdad. He obtained his BSc degree in Irrigation and Drainage Engineering and MSc in Hydraulic En-gineering from the University of Baghdad, Iraq. His eld of specialization is water resources, hydraulics, and hydraulic structures. He has authored and co-authored technical papers and reports in national and international publications and has served as a referee for papers published in local and international journals. Zainah Ibrahim received her BSc degree in Civil Engineering, 1990, Middlesex Polytechnic, UK, MSc degree in Structural Engineering, 1994, University of Liverpool, UK, and PhD degree in Structural Engi-neering, 2007, University of Sheeld, UK. She joined the University of Malaya, Malaysia, as a Lecturer in 1995, where she is currently an Associate Professor at the Department of Civil Engineering. She is the
author or co-author of 50 peer-refereed articles, and her research interests include structural health monitoring and system identication of civil structures, FEM, composite materials & structures, damage detection, and rehabilitation of structures.
Faridah Othman is currently a lecturer at the Civil Engineering Department, Faculty of Engineering, University of Malaya. She obtained her BSc degree in Civil Engineering from the University of Missouri Kansas City, USA and MSc and PhD degrees from the University of Newcastle Upon Tyne, UK. Her elds of specialization are water resources, environmental hydraulics, river and water quality modeling, water dis-tribution, and sewerage network. She has been involved in modeling exercise for almost 20 years and is actively involved in the study of the water resources manage-ment, river, and surface water quality studies, perfor-mance, and quality of water supply, sewerage network, ood mitigation works, and GIS application in Water Engineering. Dr. Faridah has supervised a number of PhDs, Masters, and undergraduates students in their nal-year theses. She has authored and co-authored several technical papers and reports in national and in-ternational publications, and she has served as a referee for papers published in local and international journals. Zaher Mundher Yaseen is a senior lecturer and senior researcher in the eld of Civil Engineering. He has established his master and doctorate degrees between 2012-2017 at the National University of Malaysia (UKM), Malaysia. Dr. Yaseen is major in hydrology, water resources engineering, hydrological processes modeling, environmental engineering and climate. In addition, he has an excellent expertise in machine learning and advanced data analytics. He has published over 100 articles in international journals with a Google Scholar H-Index of 21, and a total of 1404 citations.