Erin L. Convery
UNC DEPARTMENT OF CITY AND REGIONAL PLANNING | MASTER’S PROJECT | MARCH 29, 2017
Economic Impacts of
Multi-Use Trails
A
BSTRACT
1
I
NTRODUCTION AND
B
ACKGROUND
1.1
P
URPOSEIn a report published in March 2016 called Active Transportation and Real Estate: The Next Frontier, the Urban Land Institute explores a growing trend in “trail-oriented development,” which focuses on the nexus between active transportation infrastructure investments and economic, social, health, and environmental benefits (ULI 2016). While these benefits are widely acknowledged and accepted, with high profile examples such as the Atlanta BeltLine and the Indianapolis Cultural Trail, this study aims to investigate the economic impacts of smaller scale trail investments on commercial development at the corridor level compared to the surrounding region. Several previous studies have identified economic impacts from trail construction, direct and indirect spending, and overall increases in property values, often based on data collected retroactively after construction. But as cities plan for trails, and potentially trail-oriented development, what kind of economic development changes can they anticipate in the commercial sector? The purpose of this study is to use parcel, corridor, and regional economic data for several comparable trails in Ohio to determine how the presence of a greenway or trail affects commercial development and employment in order to inform economic impact estimates. The study will investigate the following research questions:
For commercial, office, and multifamily properties, how do rents and occupancy rates in the trail corridors compare to the surrounding regions before and after trail construction?
How does job growth in multi-used trail corridors compare to the surrounding regions before and after trail construction?
What factors may contribute to the success, or lack thereof, of trail corridors based on these metrics?
1.2
L
ITERATURER
EVIEW1.2.1 Real Estate and Active Transportation
The benefits of greenways trails and greenways are numerous; these investments can increase recreation, health, transportation, ecological, aesthetic, and economic value within a community (Lindsey 2004). In recent years, as biking and walking have become higher priorities in where people choose to live, the economic benefits of greenways in particular have become a more prominent consideration in the real estate sector (ULI 2016). In essence, within the realm of real estate, the impact of greenways can be seen as willingness to pay for the premium of trail access (Campbell 2007).
ULI study help clarify the potential relationship between active transportation infrastructure (including trails and greenways) and real estate development:
● Walking and biking infrastructure and amenities add value to development projects due to increased project visibility, growth in car-free commuting, and market desire for access to active lifestyles;
● Investments in bike amenities can contribute to improved returns via faster lease-up rates, higher rental premiums, and marketability of properties outside the city center due to improved access; and
● Maximizing investment in active transportation projects can be achieved through public-private partnerships beneficial to both the municipalities and developers (ULI 2016).
The flipside of the real estate sector’s interest in bike and pedestrian-friendly locations is the opportunity for municipalities to invest in catalytic projects that “support and, in some instances, spur” these real estate investments (ULI 2016, 36). The ULI report highlights several projects that have done just that. For example, properties within a ¼-mile of the Radnor Trail in the Philadelphia metro area were found to be worth $69,000 higher on average compared to other properties in the area, and the Minneapolis Greenway has led to new residential development valued at $750 million (ULI 2016).
1.2.2 Models for Estimating Real Estate Impacts of Trails
While the property value increases along trail investments are can easily be demonstrated after trail construction, how can planners estimate the potential impact on surrounding properties as they plan for trail development? Given trails’ unique value as both open recreation space and a means of travel, research in this area pulls from the study of property value impacts of both transportation infrastructure and parks and open space (Lindsey 2004).
Early studies of the impacts of trails on property values drew upon attitude and opinion surveys of homeowners and realtors (Crompton 2001). Generalizing the findings from several of these studies, conducted between 1978 and 1997, Crompton found that the predominant perception was that proximity to a trail had no impact of property values or salability, with only about 20% to 40% of respondents generally reporting a belief that there was in fact a positive impact (2001). Those that reported a negative attitude often cited concerns such as loss of privacy, safety, and security (Crompton 2001). Based on the results of this study, Crompton recommended further empirical study of the connection between trails and property values. Notably, Crompton also identified that due to the narrow, linear nature of trails, distance to trail access points is more likely to drive property value increases, as opposed to mere proximity (2001).
(Lindsey 2004). Several policy implications were derived from the study of Marion County’s trail system (Lindsey 2003). One of the primary takeaways was that while greenways generally have a positive impact on home values, these impacts vary from greenway to greenway, which may be related to how the values linked to trail corridors (e.g., fitness, recreation, commuting, conservation) affect infrastructure investment (Lindsey 2003). Lindsey notes the importance of understanding these differences, and the subsequent differences in property taxes, for municipalities and private organizations making decisions about how to invest taxpayer dollars on public goods (Lindsey 2003).
A 2005 study used hedonic modelling to understand the impacts not only of physical proximity to greenways, but also the aesthetics or view of a greenway, on sale prices of homes near a series of trails in Austin, Texas (Nicholls). The study found that in two out of three neighborhoods, adjacency to the greenway was a significant factor in property value premiums (Nicholls 2005). However, having a view of the greenway without direct adjacency was not a significant factor (Nicholls 2005). In all cases, visual and physical access to the greenway had either no impact or positive impact on home sale prices, contradicting previous public opinion research which indicated that adjacency to greenways may have a negative impact on property values due to concerns such as privacy and safety (Nicholls 2005). This study also highlights some of the design and context factors that may be important to consider in the relationship between property values and greenways, such as availability of alternative forms of transportation, proximity to downtown, access to other parks and open spaces, and greenway access points (Nicholls 2005).
While the studies above provide useful insight into property value premiums related to greenways, they focus solely on home sales prices. In a study of the Catawba Regional Trail in Charlotte, North Carolina, the use of hedonic modeling for greenways was broadened to include single family housing, multifamily housing, and commercial properties (2007). The study found that the premium on greenway access differed for these different uses: for every 1% decrease in distance from the greenways, there was a premium increase of 0.03% for single family residential, a premium increase of 0.015% for commercial space, and a premium of only 0.0013% for multifamily residential. Despite these differences, the study also identified a few useful general findings (Campbell 2007). The study found that no matter the land use, the premium associated with greenway access decayed steeply with distance; while the benefits extended up to 5,000 feet from the greenway, the maximum benefits were highly concentrated within 1,000 feet of the greenway (Campbell 2007).
Increases in property values are often considered positive due to the “wealth effect” experienced by the homeowner and the increased tax revenue potential for the municipality (Campbell 2007, p. 134). However, these increases also raise concerns about displacement of lower income households (Campbell 2007). The results from the Catawba Regional Trail study indicated that, since the premiums were a percentage of initial home value, the greatest land value premiums were expected to occur in more affluent areas. However, land values were still expected to increase in low income neighborhoods near the trail, and because these increases were relatively small, displacement of vulnerable households was less likely (Campbell 2007). These findings provide an important insight into the long-term social equity impacts that trails may have within the greater community’s housing market.
1.2.3 Estimating Real Estate Benefits of Trails in Practice
the Ludlam Trail, which aimed to quantify the numerous benefits of the planned Ludlam Trail. The study evaluated social benefits (destination accessibility and health and wellness), environmental benefits (vehicle trip reduction, vehicle emissions, tree canopy, and carbon sequestration), and economic benefits (property values, property taxes, retail sales, and retail employment) (MDCPR 2011).
A comparative analysis of two trails, the Pinellas Trail in Pinellas County, Florida, and the Springwater Trail in Portland, Oregon, was conducted to determine expected property value increases along the Ludlam Trail (MDCPR 2011). Using assessor’s data from 1996, 2000, 2006, and 2010, it was determined that the difference between the compound annual growth rate for properties in the corridors surrounding these two trails compared to the surrounding municipality ranged from 0.32% (Pinellas Trail) to 0.73% (Springwater Trail) (MDCPR 2011). These values were used to determine a range of property value increases that could be expected along the Ludlam Trail (MDCRP 2011). These estimates are particularly important to municipalities planning trails and greenways because they can help municipal staff better estimate potential return on investment via tax revenues (MDCPR 2011). However, it was noted that there were several differences between the trail and the comparables, including mixes of land use types, density, and area of influence (MDCPR 2011).
1.2.4 Commercial Real Estate and Job Growth
2
M
ETHODOLOGY
2.1
D
ATAC
OLLECTION2.1.1 Comparable Trails
This study is part of a larger project looking at the projected economic impacts of a proposed multi-use trail in Delhi, Ohio, a suburb of Cincinnati. The proposed trail is approximately 1.2 miles long, running parallel with Delhi Avenue from Mount St. Joseph University at the western terminus to Anderson Ferry Road at the eastern terminus. The trail passes through mainly single family residential areas, with a commercial area at the eastern terminus. This area includes typical suburban strip mall developments including fast food restaurants, convenience stores, a grocery store, and retail.
The first step in this study was to identify several trails to serve as comparisons for the proposed trail in Delhi, Ohio. The Rails to Trails Conservancy TrailLink database was used to identify trails that met the following criteria:
Surface: Comparable trails must be asphalt or concrete because these trails allow similar uses
(walking, jogging, biking, skating) as the proposed paved trail in Delhi. Surface was determined through the Rails to Trails Conservancy TrailLink database and confirmed with Google Earth imagery.
Location: The study was limited to trails in Ohio in order to account for regional economic trends.
Location was determined through the Rails to Trails Conservancy TrailLink database.
Length: Only trails less than ten miles in length were considered in order to make reasonable
comparisons to the trail in Delhi, which will only be approximately 1.2 miles long. Trails of greater length were excluded because these trails often have different regional impacts than small-scaled trails, due to other factors such as tourism.
Commercial Area: Trails were only considered comparable if the trail passed through or
terminated in a commercial area, within a ½-mile buffer. This criterion had dual purposes. First, this ensures that the land use around the trails are somewhat comparable to land use surrounding the proposed Delhi trail. Secondly, the economic development outcomes being measured by this study are based on the presence of commercial development in the corridor area. The presence of a commercial area within the trail buffer was determined using Google Earth and Streetview imagery.
Opening Date: In order to see changes before and after trail development, and based on the
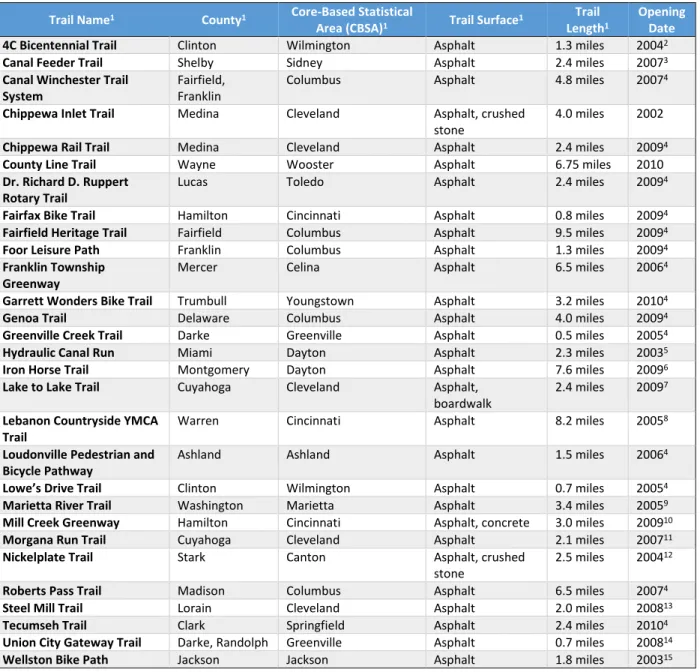
availability of Costar and LED on the Map data, comparable trails were limited to those constructed between 2002 and 2010. Opening dates were determined through a variety of online sources and email inquiries, as cited in Table 1 below.
Table 1: Comparable Trails
Trail Name1 County1 Core-Based Statistical
Area (CBSA)1 Trail Surface1
Trail Length1
Opening Date
4C Bicentennial Trail Clinton Wilmington Asphalt 1.3 miles 20042
Canal Feeder Trail Shelby Sidney Asphalt 2.4 miles 20073
Canal Winchester Trail System
Fairfield, Franklin
Columbus Asphalt 4.8 miles 20074
Chippewa Inlet Trail Medina Cleveland Asphalt, crushed
stone
4.0 miles 2002
Chippewa Rail Trail Medina Cleveland Asphalt 2.4 miles 20094
County Line Trail Wayne Wooster Asphalt 6.75 miles 2010
Dr. Richard D. Ruppert Rotary Trail
Lucas Toledo Asphalt 2.4 miles 20094
Fairfax Bike Trail Hamilton Cincinnati Asphalt 0.8 miles 20094
Fairfield Heritage Trail Fairfield Columbus Asphalt 9.5 miles 20094
Foor Leisure Path Franklin Columbus Asphalt 1.3 miles 20094
Franklin Township Greenway
Mercer Celina Asphalt 6.5 miles 20064
Garrett Wonders Bike Trail Trumbull Youngstown Asphalt 3.2 miles 20104
Genoa Trail Delaware Columbus Asphalt 4.0 miles 20094
Greenville Creek Trail Darke Greenville Asphalt 0.5 miles 20054
Hydraulic Canal Run Miami Dayton Asphalt 2.3 miles 20035
Iron Horse Trail Montgomery Dayton Asphalt 7.6 miles 20096
Lake to Lake Trail Cuyahoga Cleveland Asphalt,
boardwalk
2.4 miles 20097
Lebanon Countryside YMCA Trail
Warren Cincinnati Asphalt 8.2 miles 20058
Loudonville Pedestrian and Bicycle Pathway
Ashland Ashland Asphalt 1.5 miles 20064
Lowe’s Drive Trail Clinton Wilmington Asphalt 0.7 miles 20054
Marietta River Trail Washington Marietta Asphalt 3.4 miles 20059
Mill Creek Greenway Hamilton Cincinnati Asphalt, concrete 3.0 miles 200910
Morgana Run Trail Cuyahoga Cleveland Asphalt 2.1 miles 200711
Nickelplate Trail Stark Canton Asphalt, crushed
stone
2.5 miles 200412
Roberts Pass Trail Madison Columbus Asphalt 6.5 miles 20074
Steel Mill Trail Lorain Cleveland Asphalt 2.0 miles 200813
Tecumseh Trail Clark Springfield Asphalt 2.4 miles 20104
Union City Gateway Trail Darke, Randolph Greenville Asphalt 0.7 miles 200814
Wellston Bike Path Jackson Jackson Asphalt 1.8 miles 200315
Sources:
1 Rails to Trails Conservancy 2017. 2 City of Wilmington 2017. 3 City of Sidney 2017. 4 Google Earth 5 City of Piqua 2017. 6 People for Bikes 2017. 7 Farris 2009.
8 Wikipedia 2015. 9 City of Marietta 2016. 10 Groundwork Cincinnati 2017.
11 Cleveland City Planning Commission 2017. 12 Stark County Park District 2017.
13 Lorain County Metro Parks 2012. 14 Indiana Trails Community 2017.
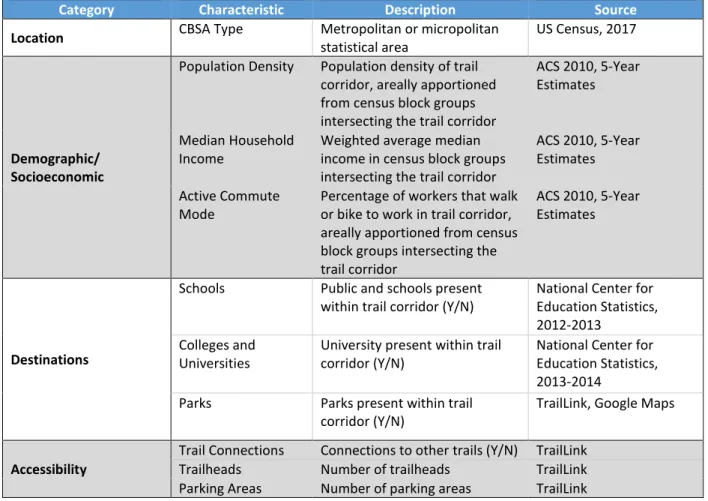
For each comparable trail, a series of trail and corridor characteristics was also recorded. The trail characteristic data was gathered from a variety of sources, summarized in Table 2. Socioeconomic and demographic data from the American Community Survey (ACS) data was prepared for analysis in ArcGIS using a variety of tools, including intersection and dissolve, in order to areally apportion characteristics to the trail corridors. A detailed table of trail corridor characteristics can be found in Appendix A.
Table 2: Trail Corridor Characteristics
Category Characteristic Description Source
Location CBSA Type Metropolitan or micropolitan
statistical area
US Census, 2017
Demographic/ Socioeconomic
Population Density Population density of trail corridor, areally apportioned from census block groups intersecting the trail corridor
ACS 2010, 5-Year Estimates
Median Household Income
Weighted average median income in census block groups intersecting the trail corridor
ACS 2010, 5-Year Estimates
Active Commute Mode
Percentage of workers that walk or bike to work in trail corridor, areally apportioned from census block groups intersecting the trail corridor
ACS 2010, 5-Year Estimates
Destinations
Schools Public and schools present within trail corridor (Y/N)
National Center for Education Statistics, 2012-2013
Colleges and Universities
University present within trail corridor (Y/N)
National Center for Education Statistics, 2013-2014
Parks Parks present within trail corridor (Y/N)
TrailLink, Google Maps
Accessibility
Trail Connections Connections to other trails (Y/N) TrailLink Trailheads Number of trailheads TrailLink Parking Areas Number of parking areas TrailLink
2.1.2 Real Estate Data
Rents and occupancy rate data was obtained for each comparable trail corridor (using the ½-mile buffer to represent the corridor) and the corresponding CBSAs from CoStar, a commercial real estate database. Data was downloaded in each of the following categories and dates: multifamily residential (2000-2016, as available), retail (2000-2016, as available), and office (2000-2016, available).
2.1.3 Job Data
2.2
D
ATAA
NALYSIS2.2.1 Trail Corridor vs. CBSA Before and After Analysis
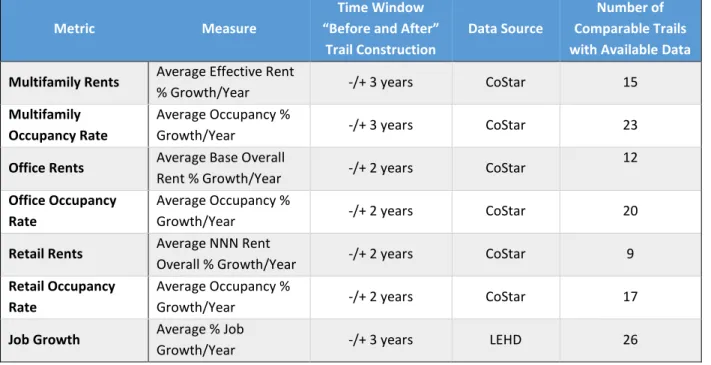
For each metric, a paired t-test was used to see if there was a significant difference in growth in the trail corridor compared to the surrounding CBSA before and after trail construction. The difference between the trail corridor and the surrounding CBSA was used to account for general real estate and economic trends in the region. In order to conduct the paired t-tests, for each metric, an average percent change prior to trail construction was calculated for the trail corridor (x1TRAIL) and the surrounding CBSA (x1CBSA). Corresponding values were calculated for the trail corridor and surrounding CBSA after trail construction (x1TRAIL and x2CBSA). A standardized time window for before and after data was used for each metric based on data availability. These time windows are summarized in Table 3 below.
The before and after values for each trail corridor/CBSA pair were used to generate two sets of variables: the difference between relative average percent change for each trail and CBSA before trail construction (Δ1 = x1TRAIL - x1CBSA), and difference between relative average percent change for the trail and CBSA after construction (Δ2= x2TRAIL – x2CBSA). The before and after values for each trail corridor/CBSA pair were used to generate two sets of variables: the difference between average percent change for each trail and CBSA in the years before trail construction (ΔBEFORE), and difference between average percent change for the trail and CBSA in the years after construction (ΔAFTER). The difference between the trail corridor and the surrounding CBSA was used to account for general real estate and economic trends in the region. Then a final difference was calculated: ΔAFTER - ΔBEFORE. This difference represents the change in the trail corridor compared to the surrounding region before and after trail construction; positive values indicate that the trail corridor improved at a higher rate than the surrounding CBSA for a given metric.
Then a one-tailed, paired t-test was conducted using Stata to test if there was a significant difference between the paired ΔBEFORE and ΔAFTER variables, using the null hypothesis that the mean difference between the paired samples is zero (H0: µd = 0) and the alternative hypothesis that the mean difference is greater than zero (Ha: µd > 0). Prior to conducting statistical analysis, the normality of the Δ values for each metric was checked using a histogram.
2.2.2 Leading and Lagging Trail Identification and Characterization
Based on the results of the real estate and job growth data analysis, leading and lagging trail corridors were identified for each metric. Leading trails were those with high positive ΔAFTER - ΔBEFORE values, while lagging trails were those with the greatest negative change. The characteristics of each trail corridor (see Table 2 above and Appendix A) were then summarized and compared for leading and lagging trail corridors across each metric in order to determine whether certain on-the-ground factors may be indicative of potential for greater potential commercial development impacts.
2.3
C
ASES
TUDYTable 3: Summary of Data Used for Data Analysis
Metric Measure
Time Window “Before and After”
Trail Construction
Data Source
Number of Comparable Trails with Available Data
Multifamily Rents Average Effective Rent
% Growth/Year -/+ 3 years CoStar 15
Multifamily Occupancy Rate
Average Occupancy %
Growth/Year -/+ 3 years CoStar 23
Office Rents Average Base Overall
Rent % Growth/Year -/+ 2 years CoStar
12
Office Occupancy Rate
Average Occupancy %
Growth/Year -/+ 2 years CoStar 20
Retail Rents Average NNN Rent
Overall % Growth/Year -/+ 2 years CoStar 9
Retail Occupancy Rate
Average Occupancy %
Growth/Year -/+ 2 years CoStar 17
Job Growth Average % Job
3
R
ESULTS AND
D
ISCUSSION
3.1
S
TATISTICALA
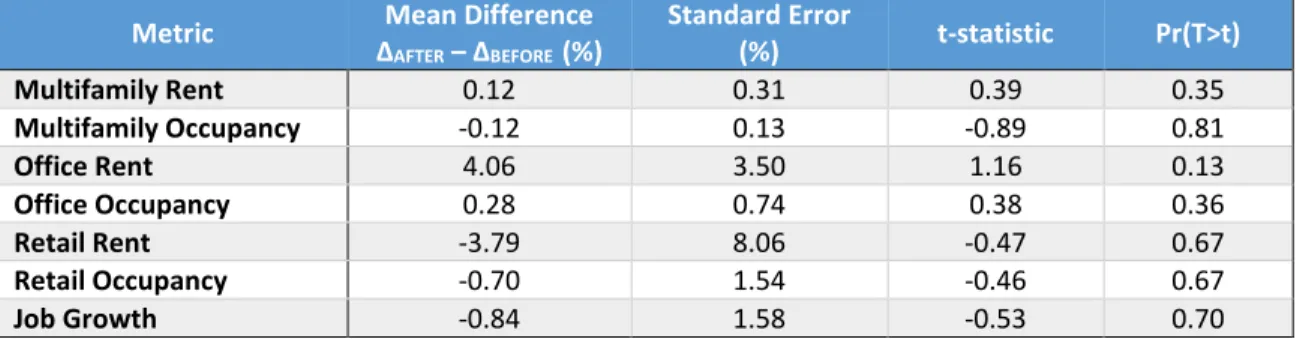
NALYSESAs shown in Table 4 below, statistical analyses showed no significant association between the presence of the trail and any of the real estate or commercial development metrics, potentially due to small samples. Generally, commercial real estate metrics and job growth in trail corridors did not significantly outpace the surrounding region. On average, multifamily rents, office rents, and office occupancy were the metrics that showed increases in trail corridors relative to the surrounding CBSA. On the other hand, trail corridors had lower average rates of change after trail construction in multifamily occupancy, retail rent, retail occupancy, and job growth compared to the surrounding CBSAs. The ΔAFTER - ΔBEFORE values for the real estate and job growth metrics ranged widely, with trail corridors often performing very differently on different metrics; these differences will be discussed in more detail in Section 3.2.
Table 4: Summary of Commercial Development Metrics, Before and After Trail Construction
Metric Mean Difference
ΔAFTER – ΔBEFORE (%)
Standard Error
(%) t-statistic Pr(T>t)
Multifamily Rent 0.12 0.31 0.39 0.35
Multifamily Occupancy -0.12 0.13 -0.89 0.81
Office Rent 4.06 3.50 1.16 0.13
Office Occupancy 0.28 0.74 0.38 0.36
Retail Rent -3.79 8.06 -0.47 0.67
Retail Occupancy -0.70 1.54 -0.46 0.67
Job Growth -0.84 1.58 -0.53 0.70
Source: CoStar, 2017; LEHD On The Map, 2017.
3.2
L
EADING ANDL
AGGINGT
RAILC
ORRIDORI
DENTIFICATION ANDC
HARACTERIZATIONThe detailed results of the ΔAFTER - ΔBEFORE analyses for each metric are presented below, followed by a discussion of leading and lagging trail corridor characteristics for each metric. The overall characteristics are summarized by metric in these sections; details on specific trail corridor characteristics are included in Appendix A. No single characteristic, or even category of characteristic (i.e., location, socioeconomic/demographic, destinations, accessibility) appears to be indicative of the leading trails; however, this section aims to provide a better understanding of the similar characteristics or combinations of characteristics that may have contributed to the success of some trails compared to others on a metric by metric basis. This section also includes brief snapshot of the highest leading trail corridor for each metric; a more in depth case study of the Morgana Run trail corridor, which performed well across metrics, is presented in Section 4.
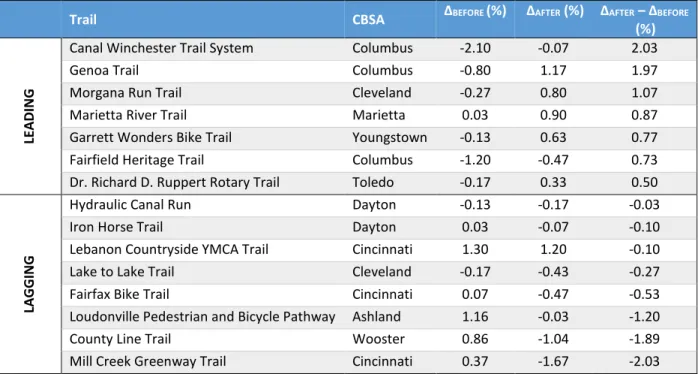
3.2.1 Multifamily Real Estate Metrics
Table 5: Average Difference in Effective Multifamily Rent Percent Growth Per Year
Trail CBSA ΔBEFORE (%) ΔAFTER (%) ΔAFTER – ΔBEFORE
(%)
LE
A
D
ING
Canal Winchester Trail System Columbus -2.10 -0.07 2.03
Genoa Trail Columbus -0.80 1.17 1.97
Morgana Run Trail Cleveland -0.27 0.80 1.07
Marietta River Trail Marietta 0.03 0.90 0.87 Garrett Wonders Bike Trail Youngstown -0.13 0.63 0.77 Fairfield Heritage Trail Columbus -1.20 -0.47 0.73 Dr. Richard D. Ruppert Rotary Trail Toledo -0.17 0.33 0.50
LA
GG
ING
Hydraulic Canal Run Dayton -0.13 -0.17 -0.03
Iron Horse Trail Dayton 0.03 -0.07 -0.10
Lebanon Countryside YMCA Trail Cincinnati 1.30 1.20 -0.10 Lake to Lake Trail Cleveland -0.17 -0.43 -0.27 Fairfax Bike Trail Cincinnati 0.07 -0.47 -0.53 Loudonville Pedestrian and Bicycle Pathway Ashland 1.16 -0.03 -1.20
County Line Trail Wooster 0.86 -1.04 -1.89
Mill Creek Greenway Trail Cincinnati 0.37 -1.67 -2.03 Source: CoStar, 2017.
Table 6: Multifamily Rent: Leading and Lagging Trail Characteristics
Category Characteristic Leading Trail
Corridors
Lagging Trail Corridors
Difference (Leading – Lagging)
Location
CBSA Type
(% of Trail Corridors Located in Metropolitan Statistical Area)
85.71% 75.00% 10.71%
Socioeconomic/ Demographic
Average Population Density
(population per square mile) 2573.3 1989.5 583.8 Average Median Household Income $ 48,270.43 $ 57,259.34 $ (8,988.91) Average Active Commute Mode
Share 4.15% 4.38% -0.23%
Destinations
Schools Present in Trail Corridor 100.00% 100.00% 0.00% Universities Present in Trail
Corridor 42.86% 37.50% 5.36%
Parks Present in Trail Corridor 100.00% 100.00% 0.00%
Accessibility
Trail Connections Present 28.57% 37.50% -8.93% Trailheads Present 42.86% 25.00% 17.86% Parking Areas Present 85.71% 87.50% -1.79% Source: See Table 2.
Table 7: Average Difference in Multifamily Occupancy Percent Growth Per Year
Trail CBSA ΔBEFORE (%) ΔAFTER (%) ΔAFTER – ΔBEFORE (%)
LE
A
D
ING
Canal Winchester Trail System Columbus -1.10 0.70 1.80
Iron Horse Trail Dayton -0.03 0.40 0.43
County Line Trail Wooster 0.03 0.33 0.30
Morgana Run Trail Cleveland -0.10 0.13 0.23
Mill Creek Greenway Trail Cincinnati 0.00 0.13 0.13 Greenville Creek Trail Greenville 0.00 0.10 0.10
Foor Leisure Path Columbus -0.07 -0.03 0.03
Lebanon Countryside YMCA Trail Cincinnati 0.10 0.10 0.00
LA
GG
ING
Fairfield Heritage Trail Columbus -0.07 -0.10 -0.03
Tecumseh Trail Springfield 0.03 0.00 -0.03
Wellston Bike Path Jackson 0.03 0.00 -0.03
Hydraulic Canal Run Dayton 0.13 0.07 -0.07
Marietta River Trail Marietta 0.03 -0.03 -0.07 4C Bicentennial Trail Wilmington -0.17 -0.30 -0.13 Dr. Richard D. Ruppert Rotary Trail Toledo -0.17 -0.30 -0.13 Fairfax Bike Trail Cincinnati 0.07 -0.07 -0.13 Union City Gateway Trail Greenville 0.20 0.03 -0.17 Lake to Lake Trail Cleveland 0.00 -0.33 -0.33
Steel Mill Trail Cleveland 0.20 -0.17 -0.37
Genoa Trail Columbus -0.23 -0.77 -0.53
Nickelplate Trail Canton 0.37 -0.60 -0.97
Garrett Wonders Bike Trail Youngstown 0.00 -1.33 -1.33 Loudonville Pedestrian and Bicycle Pathway Ashland 0.37 -1.00 -1.37 Source: CoStar, 2017.
Table 8: Multifamily Occupancy: Leading and Lagging Trail Characteristics
Category Characteristic Leading Trail
Corridors
Lagging Trail Corridors
Difference (Leading – Lagging)
Location
CBSA Type
(% of Trail Corridors Located in Metropolitan Statistical Area)
75.0% 66.7% 8.3%
Socioeconomic/ Demographic
Average Population Density
(population per square mile) 2090.8 1677.9 412.9 Average Median Household Income $ 57,549.85 $ 46,801.16 $ 10,748.69 Average Active Commute Mode
Share 1.5% 5.7% -4.2%
Destinations
Schools Present in Trail Corridor 100.0% 86.7% 13.3% Universities Present in Trail Corridor 37.5% 26.7% 10.8% Parks Present in Trail Corridor 100.0% 93.3% 6.7%
Accessibility
Trail Connections Present 37.5% 40.0% -2.5%
Trailheads Present 37.5% 33.3% 4.2%
Parking Areas Present 87.5% 86.7% 0.8%
Looking at leading trails for both multifamily rents and occupancy rates (Table 5 and 7), the Canal Winchester Trail System corridor had the highest increases after trail construction compared to the surrounding Columbus CBSA. The Canal Winchester Trail System, constructed in 2007, is approximately 5 miles in length and is located in a suburb of Columbus (Rails-to-Trails Conservancy 2017). The trail corridor is relatively affluent, with a median household income of $87,985 (ACS 2010). Typical of most suburban areas, the active commute share is relatively low in the trail corridor at 1.2% (ACS 2010).
Compared to many of the comparable trails in this study, the Canal Winchester Trail system stands out because of its access to a wide variety of destinations, including a community pool, parks, the public elementary school, and a commercial district which includes a Walmart (Rails-to-Trails Conservancy 2017). The trail has the additional draw of the Bergstresser/Dietz Covered Bridge, a landmark in Franklin County (Rails-to-Trails Conservancy 2017). The trail has parking available approximately 1/2 -mile west of the historic downtown area (Rails-to-Trails Conservancy 2017). Specifically considering multifamily housing, it appears that growth in the trail corridor may continue in the future; the City of Canal Winchester has approved plans for the Winchester Ridge Apartments, a 198-unit complex. One of the highlighted features of the complex is that it will include walking trails which will tie into the existing Canal Winchester Trail System (City of Canal Winchester 2017).
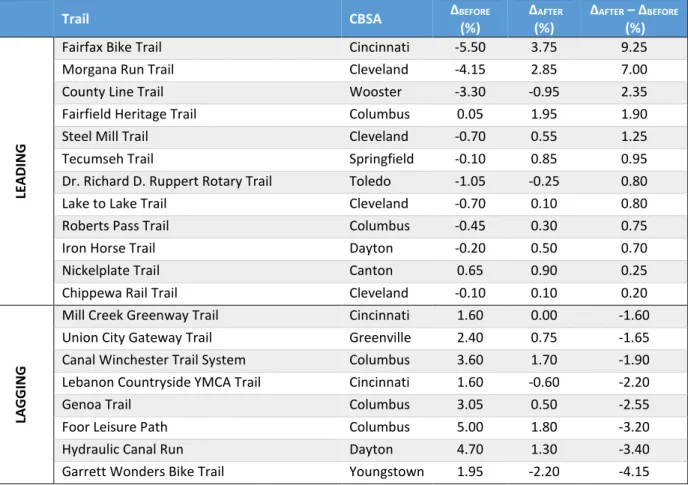
3.2.2 Office Real Estate Metrics
There were several trails that saw greater increases in office rent after trail construction in the trail corridor compared to the surrounding CBSA (Table 9). As a whole, these leading trails were located in less dense, higher income areas than the lagging trails, and also had a higher active commute mode share, which is interesting given that offices are typically a commute destination (Table 10). The presence of universities, schools, and parks within the trail corridors were relatively similar between leading and lagging trails. Somewhat unexpectedly, connections to other trails were more common among lagging trail corridors than leading trail corridors.
The Fairfax Bike Trail saw the greatest relative increase in office rents following trail construction (Table 9). The trail is located in Mariemont, Ohio, in the Cincinnati CBSA, which is also the region of the proposed Delhi Trail. The Fairfax Bike Trail is short in length, at only 0.8 miles, and was constructed in 2009 (Rails to Trails Conservancy 2017). Located just outside of Cincinnati, the Fairfax trail corridor has a high population density compared to many of the study trails, with 4,280 people per square mile (ACS 2010).
Table 9: Average Difference in Office Base Overall Rent Percent Growth Per Year
Trail CBSA ΔBEFORE
(%)
ΔAFTER
(%)
ΔAFTER – ΔBEFORE
(%)
LE
A
D
ING
Fairfax Bike Trail Cincinnati -5.50 3.75 9.25 Morgana Run Trail Cleveland -4.15 2.85 7.00
County Line Trail Wooster -3.30 -0.95 2.35
Fairfield Heritage Trail Columbus 0.05 1.95 1.90
Steel Mill Trail Cleveland -0.70 0.55 1.25
Tecumseh Trail Springfield -0.10 0.85 0.95
Dr. Richard D. Ruppert Rotary Trail Toledo -1.05 -0.25 0.80 Lake to Lake Trail Cleveland -0.70 0.10 0.80 Roberts Pass Trail Columbus -0.45 0.30 0.75
Iron Horse Trail Dayton -0.20 0.50 0.70
Nickelplate Trail Canton 0.65 0.90 0.25
Chippewa Rail Trail Cleveland -0.10 0.10 0.20
LA
GG
ING
Mill Creek Greenway Trail Cincinnati 1.60 0.00 -1.60 Union City Gateway Trail Greenville 2.40 0.75 -1.65 Canal Winchester Trail System Columbus 3.60 1.70 -1.90 Lebanon Countryside YMCA Trail Cincinnati 1.60 -0.60 -2.20
Genoa Trail Columbus 3.05 0.50 -2.55
Foor Leisure Path Columbus 5.00 1.80 -3.20
Hydraulic Canal Run Dayton 4.70 1.30 -3.40
Garrett Wonders Bike Trail Youngstown 1.95 -2.20 -4.15 Source: CoStar, 2017.
Table 10: Office Rent: Leading and Lagging Trail Characteristics
Category Characteristic Leading Trail
Corridors
Lagging Trail Corridors
Difference (Leading – Lagging)
Location
CBSA Type
(% of Trail Corridors Located in Metropolitan Statistical Area)
80.0% 100.0% -20.0%
Socioeconomic/ Demographic
Average Population Density
(population per square mile) 1603.5 3083.9 -1480.4 Average Median Household
Income $ 62,937.78 $ 49,002.98 $ 13,934.80 Average Active Commute Mode
Share 4.4% 2.4% 2.0%
Destinations
Schools Present in Trail Corridor 100.0% 100.0% 0.0% Universities Present in Trail
Corridor 40.0% 42.9% -2.9%
Parks Present in Trail Corridor 100.0% 100.0% 0.0%
Accessibility
Trail Connections Present 20.0% 42.9% -22.9%
Trailheads Present 40.0% 28.6% 11.4%
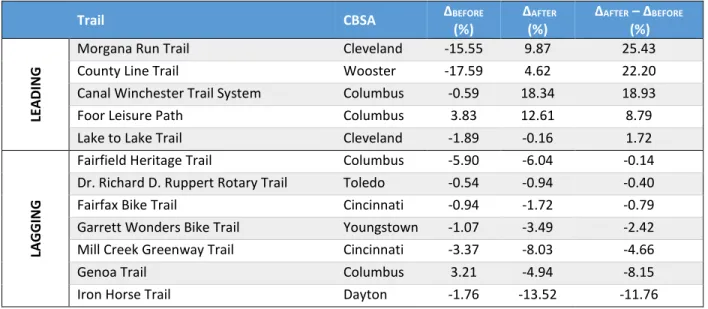
Far fewer trails were identified as leading trails for the office occupancy metric (Table 11). However, those trails that were identified tended to be located in denser, but less affluent, areas than the lagging trails on average (Table 12). Similar to office rent, these corridors also had a higher average active commute mode share. Looking at accessibility characteristics, the leading trails again tended to have fewer trail connections as well as parking areas. Given that the appeal of a trail near an office building would probably be for active commuting or recreation during breaks, it makes sense that the presence of parking areas may not have much of an impact on office real estate development in trail corridors.
The Morgana Run Trail, which had the highest relative increase in office occupancy rates, will be further discussed in the case study in Section 4.
Table 11: Average Difference in Office Occupancy Percent Growth Per Year
Trail CBSA ΔBEFORE
(%)
ΔAFTER
(%)
ΔAFTER – ΔBEFORE
(%)
LE
A
D
ING
Morgana Run Trail Cleveland -15.55 9.87 25.43 County Line Trail Wooster -17.59 4.62 22.20 Canal Winchester Trail System Columbus -0.59 18.34 18.93 Foor Leisure Path Columbus 3.83 12.61 8.79 Lake to Lake Trail Cleveland -1.89 -0.16 1.72
LA
GG
ING
Fairfield Heritage Trail Columbus -5.90 -6.04 -0.14 Dr. Richard D. Ruppert Rotary Trail Toledo -0.54 -0.94 -0.40 Fairfax Bike Trail Cincinnati -0.94 -1.72 -0.79 Garrett Wonders Bike Trail Youngstown -1.07 -3.49 -2.42 Mill Creek Greenway Trail Cincinnati -3.37 -8.03 -4.66
Genoa Trail Columbus 3.21 -4.94 -8.15
Iron Horse Trail Dayton -1.76 -13.52 -11.76 Source: CoStar, 2017.
Table 12: Office Occupancy: Leading and Lagging Trail Characteristics
Category Characteristic Leading Trail
Corridors
Lagging Trail Corridors
Difference (Leading – Lagging)
Location
CBSA Type
(% of Trail Corridors Located in Metropolitan Statistical Area)
91.7% 87.5% 4.2%
Socioeconomic/ Demographic
Average Population Density
(population per square mile) 2034.3 1568.4 465.9 Average Median Household Income $ 50,536.60 $ 62,341.89 $ (11,805.29) Average Active Commute Mode
Share 3.8% 1.7% 2.1%
Destinations
Schools Present in Trail Corridor 91.7% 87.5% 4.2% Universities Present in Trail Corridor 25.0% 25.0% 0.0% Parks Present in Trail Corridor 91.7% 87.5% 4.2%
Accessibility
Trail Connections Present 25.0% 75.0% -50.0%
Trailheads Present 41.7% 37.5% 4.2%
3.2.3 Retail Real Estate Metrics
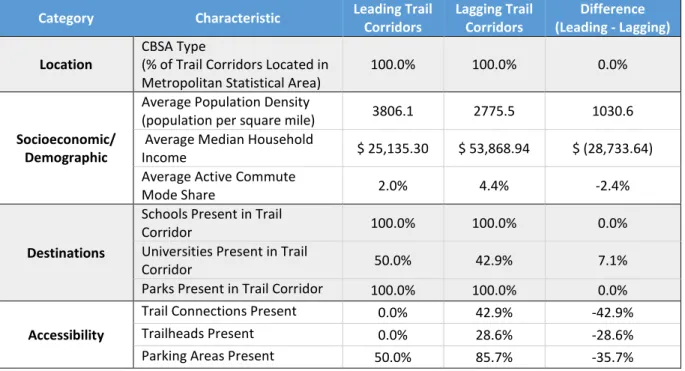
There was a small sample of trail corridors included in the retail rent analysis, but the majority of the trails fell into the lagging category, indicating that retail rents did not increase in trail corridors at the same pace as the surrounding CBSAs (Table 13). With only two trails in the leading category, it is difficult to draw general conclusions about leading trail characteristics for this metric (Table 14).
However, looking specifically at the Mill Creek Greenway Trail, which had the greatest increase in retail rent growth after trail construction, there are a few noteworthy characteristics. The three-mile existing trail, located in northern Cincinnati and completed in 2009, currently contains two disconnected segments, but it is planned that the trail will eventually connect and reach a total length of 14 miles (Rails to Trails Conservancy 2017). The trail runs through an old rail corridor along Mill Creek, in a primarily industrial area with high levels of pollution (Groundwork Cincinnati 2017). The residential areas surrounding the corridor have an average median household income of $27,354, and only 0.7% of commuters walk or bike to work (ACS 2010).
The Mill Creek Greenway was developed through work by a nonprofit called Groundwork Cincinnati, whose goals for the trail included objectives to “eliminate blight; economically revitalize Mill Creek neighborhoods and communities; create jobs; stimulate the local economy; increase Mill Creek’s visibility; regenerate the health of the river and its natural resources; and provide opportunities for bike commuting, people-powered short trips, multimodal transportation, recreation, outdoor exercise, and environmental education” (Groundwork Cincinnati 2017). With outcomes specifically aimed at both environmental remediation and economic revitalization, Groundwork Cincinnati has worked to include residents, neighborhood councils, and local business owners in trail planning and design (Anspach 2015). With additional sections of the trail planned for future development, it will be interesting to see the long term impacts of the trail (and its associated restoration efforts) on retail and other businesses in the neighborhood.
Table 13: Average Difference in Retail Overall Rent Percent Growth Per Year
Trail CBSA ΔBEFORE
(%)
ΔAFTER
(%)
ΔAFTER – ΔBEFORE
(%)
LE
A
D
-ING
Mill Creek Greenway Trail Cincinnati 4.21 46.84 42.63
Morgana Run Trail Cleveland -48.03 -20.69 27.34
LA
GG
ING
Fairfield Heritage Trail Columbus 2.90 -0.18 -3.08
Iron Horse Trail Dayton 7.78 4.09 -3.70
Garrett Wonders Bike Trail Youngstown -6.20 -12.51 -6.31 Dr. Richard D. Ruppert Rotary Trail Toledo 13.30 -0.62 -13.92
Genoa Trail Columbus 20.38 -3.29 -23.66
Table 14: Retail Rent: Leading and Lagging Trail Characteristics
Category Characteristic Leading Trail
Corridors
Lagging Trail Corridors
Difference (Leading - Lagging)
Location
CBSA Type
(% of Trail Corridors Located in Metropolitan Statistical Area)
100.0% 100.0% 0.0%
Socioeconomic/ Demographic
Average Population Density
(population per square mile) 3806.1 2775.5 1030.6 Average Median Household
Income $ 25,135.30 $ 53,868.94 $ (28,733.64) Average Active Commute
Mode Share 2.0% 4.4% -2.4%
Destinations
Schools Present in Trail
Corridor 100.0% 100.0% 0.0%
Universities Present in Trail
Corridor 50.0% 42.9% 7.1%
Parks Present in Trail Corridor 100.0% 100.0% 0.0%
Accessibility
Trail Connections Present 0.0% 42.9% -42.9%
Trailheads Present 0.0% 28.6% -28.6%
Parking Areas Present 50.0% 85.7% -35.7% Source: See Table 2.
A greater sample of trails had data available for retail occupancy rates, with nine trails having rates that outpaced the surrounding CBSA (Table 15). As seen with several other indicators, the leading trail corridors had a higher percent active commute mode share than the lagging corridors (Table 16). However, the leading trails were more often located in lower density corridors in micropolitan statistical areas compared to the lagging trails. While lagging trails had a higher percentage of instances where parks and schools were present in the trail corridor, there were a greater percentage of corridors with universities present amongst the leading trails. This characteristic is noteworthy from the point of view of the proposed Delhi trail because this trail will ultimately connect Mt. St. Joseph’s University to a major retail area.
Table 15: Average Difference in Retail Occupancy Percent Growth Per Year
Trail CBSA ΔBEFORE
(%)
ΔAFTER
(%)
ΔAFTER – ΔBEFORE
(%)
LE
A
D
ING
Union City Gateway Trail Greenville -5.10 2.40 7.50
Iron Horse Trail Dayton -0.45 6.55 7.00
Lake to Lake Trail Cleveland -2.00 3.25 5.25 Morgana Run Trail Cleveland -1.00 1.90 2.90 Mill Creek Greenway Trail Cincinnati -0.20 2.40 2.60 Fairfield Heritage Trail Columbus -1.85 0.40 2.25 Tecumseh Trail Springfield -1.00 0.20 1.20 Chippewa Rail Trail Cleveland -3.45 -3.00 0.45
County Line Trail Wooster 0.10 0.45 0.35
LA
GG
ING
Dr. Richard D. Ruppert Rotary Trail Toledo 0.40 -0.30 -0.70
Genoa Trail Columbus -0.05 -1.05 -1.00
Fairfax Bike Trail Cincinnati 1.75 0.20 -1.55 Garrett Wonders Bike Trail Youngstown 1.65 0.00 -1.65 Foor Leisure Path Columbus 4.20 -0.35 -4.55 Canal Winchester Trail System Columbus 5.40 0.70 -4.70 Roberts Pass Trail Columbus -1.90 -9.25 -7.35 Steel Mill Trail Cleveland 1.30 -18.65 -19.95 Source: CoStar, 2017.
Table 16: Retail Occupancy: Leading and Lagging Trail Characteristics
Category Characteristic Leading Trail
Corridors
Lagging Trail Corridors
Difference (Leading - Lagging)
Location
CBSA Type
(% of Trail Corridors Located in Metropolitan Statistical Area)
77.8% 100.0% -22.2%
Socioeconomic/ Demographic
Average Population Density
(population per square mile) 1849.6 2033.6 -184.0 Average Median Household
Income $ 46,490.13 $ 60,627.84 $ (14,137.71) Average Active Commute
Mode Share 3.8% 2.4% 1.4%
Destinations
Schools Present in Trail
Corridor 77.8% 100.0% -22.2%
Universities Present in Trail
Corridor 44.4% 12.5% 31.9%
Parks Present in Trail Corridor 77.8% 100.0% -22.2%
Accessibility
Trail Connections Present 22.2% 62.5% -40.3%
Trailheads Present 44.4% 37.5% 6.9%
3.2.4 Job Growth
Table 17 shows the ΔAFTER – ΔBEFORE values for job growth in each of the trail corridors compared to the surrounding CBSA. There was a normal distribution of values, ranging from an increase of 13.4%, to a decrease of 15.2%. Interestingly, several of the leading trails in job growth were also leading trails in other metrics, including the Fairfax Bike Trail and the Mill Creek Greenway, which also had the greatest increases in office rents and retail rents, respectively. However, the Union City Gateway Trail and the Canal Winchester Trail System, which were the highest leading trail corridors in retail occupancy and multifamily rents and occupancy, are near the bottom of the lagging trails in job growth.
Table 17: Average Difference in Job Percent Growth Per Year
Trail CBSA ΔBEFORE
(%)
ΔAFTER
(%)
ΔAFTER – ΔBEFORE
(%)
LE
A
D
ING
Steel Mill Trail Cleveland 4.47 17.88 13.40 Loudonville Pedestrian and Bicycle
Pathway
Ashland -2.83 9.71 12.54
4C Bicentennial Trail Wilmington -5.38 3.22 8.60
Genoa Trail Columbus 4.36 12.66 8.30
Garrett Wonders Bike Trail Youngstown -6.78 0.40 7.18 Foor Leisure Path Columbus -5.88 0.92 6.80 Mill Creek Greenway Trail Cincinnati -3.95 1.37 5.32 Chippewa Rail Trail Cleveland 0.15 4.45 4.30 Fairfax Bike Trail Cincinnati -1.21 2.87 4.08 Fairfield Heritage Trail Columbus -4.31 -1.26 3.05 Roberts Pass Trail Columbus -1.63 1.08 2.70
LA
GG
ING
Table 18: Job Growth: Leading and Lagging Trail Characteristics
Category Characteristic Leading Trail
Corridors
Lagging Trail Corridors
Difference (Leading - Lagging)
Location
CBSA Type
(% of Trail Corridors Located in Metropolitan Statistical Area)
81.8% 53.3% 28.5%
Socioeconomic/ Demographic
Average Population Density
(population per square mile) 1570.5 1580.4 -9.9 Average Median Household
Income $ 54,144.76 $ 50,568.25 $ 3,576.51 Average Active Commute
Mode Share 4.3% 4.0% 0.4%
Destinations
Schools Present in Trail
Corridor 81.8% 86.7% -4.8%
Universities Present in Trail
Corridor 27.3% 26.7% 0.6%
Parks Present in Trail Corridor 90.9% 86.7% 4.2%
Accessibility
Trail Connections Present 54.5% 20.0% 34.5% Trailheads Present 45.5% 26.7% 18.8% Parking Areas Present 90.9% 86.7% 4.2% Source: See Table 2.
Generally, as seen in Table 18 above, the leading job growth trail corridors were more often located in metropolitan statistical areas; however the average population density between the leading and lagging corridors was very similar, as was median average household income and active commute mode share; this may be in part due to the larger sample size available for this metric compared to some of the others. The two characteristics that are most noticeably different, on average, between the two groups of trails, are the presence of trailheads and connections to other trails. This suggests the high visibility and connectivity may be important factors for the effect of trails on job growth in the surrounding corridor.
4
C
ASE
S
TUDY
:
M
ORGANA
R
UN
T
RAIL
Based on the results of the data analysis, it can be seen that while generally there was little consistency between the groups of leading and lagging trails across metrics, there were in fact a few instances where trail corridors performed consistently well across metrics. In order to better understand on-the-ground factors and policies that may influence the success of the trail corridors that performed well, a small case study was conducted for one of the consistently leading trails, the Morgana Run Trail in the Cleveland CBSA. The Morgana Run Trail outperformed the surrounding region at a greater rate after trail construction than before for all metrics except job growth, and was the highest leading trail with respect to office occupancy (Table 19). This latter part of this section will delve deeper into some common threads identified among leading trails identified in Section 3: coordinated community and business participation, broader economic revitalization planning efforts, and the connection of residential, recreational, and commercial areas.
Table 19: Morgana Run Trail Real Estate and Growth Metrics
Metric ΔBEFORE (%) ΔAFTER (%) ΔAFTER – ΔBEFORE (%)
Multifamily Rent -0.27 0.80 1.07
Multifamily Occupancy -0.10 0.13 0.23
Office Rent -4.15 2.85 7.00
Office Occupancy -15.55 9.87 25.43
Retail Rent -48.03 -20.69 27.34
Retail Occupancy -1.00 1.90 2.90
Job Growth -0.41 -5.05 -4.64
Source: CoStar, 2017; LEHD On The Map, 2017.
4.1
M
ORGANAR
UNT
RAILC
ONTEXT ANDH
ISTORY4.1.1 Neighborhood Context
The Morgana Run Trail is located in the Slavic Village neighborhood in Cleveland (City of Cleveland Planning Commission 2017; see Figure 1). The neighborhood is located south of Cleveland’s downtown area and abuts the Industrial Valley manufacturing district (Miller 2009). The neighborhood, historically settled by Polish, German, Czechoslovakian, Irish, and Welsh immigrants, has generally been inhabited by working-class, low-income residents (Miller 2009). In more recent years, the demographics of the neighborhood have shifted, with increases in the African-American and Latino population (Miller 2009). Between 1990 and 2000, the percent of residents in Slavic Village increased from 24% to 27%, while it fell from 28% to 26% in Cleveland as a whole. The unemployment rate in Slavic Village also increased during this time period, from 11% to 12%, while it fell from 14% to 11% in the City of Cleveland. The average median income of the trail corridor is reflective of the surrounding neighborhood at $22,917 (ACS 2010). The trail corridor’s characteristics are outlined in Table 20.
4.1.2 Trail Construction
Commission 2017). The total cost of trail construction was $2,493,657 (City of Cleveland Planning Commission 2017).
4.1.3 Trail Usage
According to Trevor Hunt, a neighborhood planner at the City of Cleveland Planning Commission, trail usage has been high, with many people using the trail, primarily for walking, except during the winter (2017). He notes that, anecdotally, usage is primarily recreation at this time (as opposed to commuting), and that many of the users are school age children (Hunt 2017).
Table 20: Morgana Run Trail Characteristics
Characteristic Measure Characteristic Measure
CBSA Cleveland Active Commute Mode Share 3.2%
CBSA Type Metro Schools in Trail Corridor Yes
Year 2007 Universities in Trail Corridor No
Length (miles) 2.1 Parks in Trail Corridor Yes
Surface Asphalt Trail Connections No
Population Density (per square mile) 4,163 Trailheads 0
Average Median Household Income $22,917.04 Parking Areas 0
Source: See Tables 1 and 2.
Figure 1: Morgana Run Trail Map
4.2
C
OMMERCIALD
EVELOPMENT IN THEM
ORGANAR
UNT
RAILC
ORRIDORSome of the unique circumstances and features of the Morgana Run Trail that may have contributed to its success in spurring, strengthening, or supporting commercial development in the corridor are discussed further in the subsections below.
4.2.1 Community and Business Involvement
Slavic Village Development (SVD), a neighborhood non-profit organization, has played a major role in the success of the trail (Hunt 2017). SVD’s mission is to work “with and for its residents, businesses, and institutions to promote civic engagement, community empowerment, and neighborhood investment” (Slavic Village 2017). The organization does work in several areas, including affordable housing, economic development, community organizing, and greenspace planning (Miller 2009).
In 2009, SVD spearheaded an effort to work with local partners to reshape the Slavic Village community through an “Active Living by Design” initiative (Miller 2009). This effort involved developing strategies for preparation, promotions, programs, policy, and physical projects (Miller 2009). Several initiatives specifically involved the Morgana Run Trail (Miller 2009). For example, promotional activities included branding of the trail, development of an Active Living map, and formation of a Friends of the Trail group to encourage use of the trail (Miller 2009). The Friends of the Trail group also played a large role in trail programming, organizing bike safety rodeos and neighborhood bike rides (Miller 2009). SVD itself is also responsible for much of the events and programming on the trail, including the annual Pierogi Dash 5k race (Hunt 2017).
For its “Active Living by Design” initiative, SVD engaged with multiple public and private partners, including the Cleveland Department of Public Health, Steps to a Healthier Cleveland, the Greater Cleveland YMCA, Clevelanders in Motion, the Ohio City Bicycle Co-op, Cleveland EVMS, and general community members engaged in the outreach process (Miller 2009). Sustained coordination with these community groups and businesses has likely contributed to the overall success of the trail.
In addition to more active engagement of the community through SVD, one of the most noticeable features of the trail is its visibility within the community. In 2007, at the time of trail construction, SVD partnered with local artists to develop a public art master plan for the trail (LAND Studio 2017). Portions of the plan have come to fruition in the intervening years, including markings at the trail’s intersections with neighborhood streets, and a large mural on an industrial building facing the corridor’s main roadway (LAND Studio 2017). This mural, made possible in part through donations from Sherwin Williams, is one of the largest in the city and serves the dual purpose of both creating a sense of place along the trail, and drawing attention and interest to the trail and the surrounding corridor for those passing by (LAND Studio 2017).
4.2.2 Economic Revitalization
located alongside the Morgana Run Trail, as the anchor project for Slavic Village; anchor projects are defined as high-impact, large scale projects “aimed at changing marker perceptions of the area” (SVD 2007).
The plan also specifically identified several synergies between the trail and commercial development in its goals and objectives. For example, under the goal of rebuilding a vibrant and divers retail, commercial, and industrial community, one of the objectives is to “use transportation and infrastructure improvements to increase the attractiveness of industrial and commercial development opportunities” (SVD 2007). Based on this goal and objective, the plan calls for the redevelopment of key commercial sites around the intersection of the Morgana Run Trail and Broadway Avenue (SVD 2007). Additionally, the plan notes that infrastructure enhancements like the trail are useful ways to define neighborhood character, creating a vision for visitors who may one day decide to become residents, business owners, or employees in the neighborhood (SVD 2007).
More recently, SVD published its Strategic Plan 2016-2018. The report highlights that Slavic Village has become one of Cleveland’s premier neighborhoods for active living, and that several of the main commercial corridors have undergone redevelopment and reinvestment focuses on bicycle and pedestrian improvements (SVD 2016). The plan notes that Slavic Village’s relatively new identity as an active living hub, largely linked to the presence of the Morgana Run Trail, can be further leveraged to draw in new residents and businesses (SVD 2016). This plan also emphasizes the connection between the trail and economic development, citing the need to connect residents with employment and activity centers via multi-use paths and greenways (SVD 2016).
4.2.3 Residential, Recreational, and Commercial Connectivity
Although it is only 2.1 miles long, the Morgana Run Trail passes through a variety of land uses (Rails to Trails Conservancy 2017). Most of the trail runs through a formerly abandoned rail corridor, while portions consist of signed bike routes along existing roadways (City of Cleveland Planning Commission 2017). The trail provides access to several neighborhood destinations, including thirteen schools, fifteen parks and recreations spaces, and a multitude of businesses, community centers, and public art installations (see Figure 1). Passing through both commercial and residential areas, the trail also connects other amenities including an Aldi grocery store and the Metrohealth Broadway Health Center (Google Maps 2017). Several public bus stops are also located in close proximity to the trail along Broadway Avenue (Google Maps 2017).
5
C
ONCLUSIONS
A
ND
D
IRECTIONS FOR
F
UTURE
R
ESEARCH
Generally, commercial real estate metrics and job growth in trail corridors did not significantly outpace the surrounding regions; in fact, trail corridors on average had lower rates of change after trail construction in multifamily occupancy, retail rent, retail occupancy, and job growth. These results indicate that while there may be many benefits to trail development, ranging from health to tourism, to property value increases, construction of a trail alone may not have significant impacts on commercial real estate and job growth. Additionally, economic benefits may be linked to using trials as a revitalization mechanism, in which case there may be a lag time between the opening of a trail and any noticeable benefits. Thus, in the short term, planners may wish to focus their efforts on maximizing other known positive outcomes from trails, such as health benefits, positive environmental impacts, and recreation opportunities. The trails that did perform well in certain metrics had a wide range of characteristics. Some of the common factors that may have contributed to the success of leading trails included coordinated community and business participation, broader economic revitalization planning efforts, and the connection of residential, recreational, and commercial areas.
It is important to note that the results of this study may have been limited by relatively small sample sizes and data availability for certain metrics in certain years. Further research on this topic may be strengthened by expanding the number of comparable trails to surrounding states to increase the dataset for analysis, as well as use of a greater time span for each metric if more robust longitudinal data is made available.
A
PPENDIX
A:
T
RAIL
C
HARACTERISTICS
Trail CBSA CBSA
Type Year
Length
(mi) Surface
Pop. Density (per sq. mile) Average Median Household Income Active Commute Mode Share Schools in Corridor Univer-sities in Corridor Parks in Corridor Trail Connections Trail-
heads Parking
4C
Bicentennial Trail
Wilmington Micro 2004 1.3 Asphalt 557.4 $ 46,489.63 19.3% N Y Y Y 2 2
Canal
Feeder Trail Sidney Micro 2007 2.4 Asphalt 409.4 $ 61,988.02 1.5% N N N N 0 2
Canal Winchester Trail System
Columbus Metro 2007 4.8 Asphalt 1190.6 $ 87,985.34 1.2% Y Y Y N 1 1
Chippewa
Inlet Trail Cleveland Metro 2002 4
Asphalt, crushed stone
349.8 $ 66,516.02 1.2% N N Y N 3 4
Chippewa
Rail Trail Cleveland Metro 2009 2.4 Asphalt 423.5 $ 64,775.75 1.8% N N N N 1 1
County Line
Trail Wooster Micro 2010 6.8 Asphalt 524.0 $ 63,582.23 1.8% Y N Y N 4 4
Dr. Richard D. Ruppert Rotary Trail
Toledo Metro 2009 2.4 Asphalt 4952.0 $ 24,654.44 5.1% Y N Y N 0 1
Fairfax Bike
Trail Cincinnati Metro 2009 0.8 Asphalt 4279.7 $ 61,435.56 4.2% Y N Y N 0 0
Fairfield Heritage Trail
Columbus Metro 2009 9.5 Asphalt 2381.5 $ 43,420.15 4.2% Y Y Y N 4 8
Foor Leisure
Path Columbus Metro 2009 1.3 Asphalt 849.3 $ 78,789.03 0.6% Y N Y Y 0 1
Franklin Township Greenway Trail
Celina Micro 2006 6.5 Asphalt 151.8 $ 53,138.34 1.4% Y N Y N 0 2
Garrett Wonders Bike Trail
Youngstown Metro 2010 3.2 Asphalt 2348.6 $ 29,543.39 1.6% Y N Y Y 0 1
Genoa Trail Columbus Metro 2009 4 Asphalt 1286.7 $ 102,296.98 0.1% Y N Y Y 4 1
Greenville
Trail CBSA CBSA
Type Year
Length
(mi) Surface
Pop. Density (per sq. mile) Average Median Household Income Active Commute Mode Share Schools in Corridor Univer-sities in Corridor Parks in Corridor Trail Connections Trail-
heads Parking
Hydraulic
Canal Run Dayton Metro 2003 2.3 Asphalt 2074.7 $ 52,578.56 1.9% Y N Y Y 0 3
Iron Horse
Trail Dayton Metro 2009 7.6 Asphalt 2889.8 $ 54,316.80 0.6% Y Y Y Y 0 1
Lake to Lake
Trail Cleveland Metro 2009 2.4
Asphalt,
boardwalk 1290.3 $ 61,415.27 15.0% Y Y Y N 0 2
Lebanon Countryside YMCA Trail
Cincinnati Metro 2005 8.2 Asphalt 1070.7 $ 96,222.40 2.4% Y N Y Y 1 1
Loudonville Pedestrian and Bicycle Pathway
Ashland Micro 2006 1.5 Asphalt 338.0 $ 41,170.32 8.3% Y N Y N 0 2
Lowe's
Drive Trail Wilmington Micro 2005 0.7 Asphalt 360.1 $ 42,425.85 4.0% Y N Y N 0 0
Marietta
River Trail Marietta Micro 2005 3.4 Asphalt 1690.6 $ 27,075.67 13.7% Y Y Y N 0 3
Mill Creek Greenway Trail
Cincinnati Metro 2009 3 Asphalt,
concrete 3448.9 $ 27,353.56 0.7% Y Y Y N 0 3
Morgana
Run Trail Cleveland Metro 2007 2.1 Asphalt 4163.3 $ 22,917.04 3.2% Y N Y N 0 0
Nickelplate
Trail Canton Metro 2004 2.5
Asphalt, crushed stone
898.6 $ 52,939.56 0.9% Y N Y N 0 2
Roberts
Pass Trail Columbus Metro 2007 6.5 Asphalt 260.9 $ 53,697.79 6.2% Y N Y Y 0 1
Steel Mill
Trail Cleveland Metro 2008 2 Asphalt 1100.7 $ 46,620.14 0.6% Y N Y Y 2 2
Tecumseh
Trail Springfield Metro 2010 2.4 Asphalt 1247.2 $ 56,664.50 1.8% Y N Y N 1 3
Union City Gateway Trail
Greenville Micro 2008 0.7 Asphalt 277.7 $ 23,965.85 5.4% N N N Y 0 1
Wellston
Bike Path Jackson Micro 2003 1.8 Asphalt 444.1 $ 31,747.33 3.1% Y N Y N 0 0
A
PPENDIX
B:
E
Q
UESTIONNAIRE
The following questions were included in an email inquiry to staff at the City of Cleveland Planning Commission to learn more about the Morgana Run Trail:
How was the trail publicized before, during and after construction?
Does the trail have its own recognizable branding?
Has trail usage met the city's expectations
How was the community involved in the trail planning and design process?
Is there public or private programming associated with the trail
R
EFERENCE
L
IST
American Community Survey (ACS). 2010. “Five-Year Estimates.” American FactFinder.
https://factfinder.census.gov/faces/nav/jsf/pages/index.xhtml. Accessed March 1, 2017.
Anspach, Eric. 2015. “Construction Nearing Completion for Latest $546k Phase of Mill Creek Greenway.”
Urban Cincy.
http://www.urbancincy.com/2015/01/construction-nearing-completion-for-latest-546k-phase-of-mill-creek-greenway/.
Aukerman, Cynthia. 2009. “Union City adopts downtown revitalization plan.” Winchester News-Gazette. http://www.indianaeconomicdigest.net/main.asp?SectionID=31&ArticleID=49219.
Campbell, Harrison S. and Darla K. Monroe. 2007. “Greenways and Greenbacks: The Impact of the Catawba Regional Trail on Property Values in Charlotte, North Carolina.” Southeastern
Geographer 47: 118-137.
City of Canal Winchester. 2017. “Development Projects.”
http://www.canalwinchesterohio.gov/197/Development-Projects. Accessed March 24, 2017.
City of Marietta. 2016. “The River Trail.”
https://www.mariettaoh.net/index.php/30-city-government/buildings-parks-cemetery-and-recreation/public-facilities/97-the-river-trail.
City of Piqua. 2017. “Linear Park.” http://piquaoh.org/parks/linear-park/.
City of Sidney. 2017. “Parks & Recreation Canal Feeder Trail.” http://www.sidneyoh.com/Parks/parks-canal-feeder-sidney-ohio.asp.
City of Wilmington. 2017. “City of Wilmington Trails Descriptions.” http://ci.wilmington.oh.us/trails.cfm#4-C.
Cleveland City Planning Commission. 2017. “Bikeway Master Plan: Morgana Run Trail.” http://planning.city.cleveland.oh.us/bike/morgana.html.
CoStar Realty Information, Inc. (Costar). 2017. http://www.costar.com/. Accessed February 24, 2017.
Crompton, John L. 2001. “Perceptions of How the Presence of Greenway Trails Affects the Value of Proximate Properties.” Journal of Park and Recreation Administration 19: 114-132.
Farris, Cori. 2009. “Lake-to-Lake Trail will be dedicated July 9: Middleburg Heights Happenings.” Sun
News. http://blog.cleveland.com/newssun/2009/07/laketolake_trail_will_be_dedic.html.
Forkenbrock, David J., and Shauna Benshoff. 2011. “Assessing the Social and Economic Effects of Transportation Projects.” National Cooperative Highways Research Program.
Google Maps. 2017. www.maps.google.com.
Google Earth. 2017. http://www.google.com/earth/.
Groundwork Cincinnati. 2017. “Greenways.” http://groundworkcincinnati.org/greenways/.