Abstract
Migratory bird species must coordinate their migration and breeding to coincide with a
period of peak resource availability in the location where they raise their young. Recent evidence
suggests that migratory birds have been responding to climate change at different rates than their
arthropod food sources. This can lead to a phenological mismatch, where the timing of resource
availability produced by a lower trophic level does not align with the timing of resource need of
a higher trophic level. Migratory bird species are unable to feed their hatchlings, inhibiting
reproductive success. We characterized the seasonal variation of foliage arthropods over the
summers of 2015 and 2016 at the North Carolina Botanical Garden in Chapel Hill, NC and the
Prairie Ridge Ecostation in Raleigh, NC. Timing and magnitude of peaks in occurrence varied
with arthropod order, year, and survey method. Caterpillars and orthopterans had peaks of
greater intensity than combined orders of arthropods that represent “bird food.” Timing of peaks
were then compared to spring greenup and temperature. Later greenup corresponded with later
arthropod peak occurrence with one survey method at both sites, but this was not true for the
other survey method or for arthropod peak occurrence comparisons to temperature. The arrival of
some bird species aligned with temperature, greenup, and arthropod peak occurrence. These
findings help to improve the characterization of arthropod phenology in future studies, and they
also demonstrate the importance of testing a network of phenological variables when considering
Introduction
The consequences of climate change for bird species is a topic of rising importance, as
many anthropogenic processes are negatively impacting populations in ways that are not fully
understood (Walther et al. 2002). Migratory bird species are especially sensitive to climate
change as they must time their migration, breeding, and raising of young to coincide with a
period of peak resource availability in a distant location, and the climatic and environmental cues
they have historically relied on may no longer be reliable. Therefore, two key questions are (1)
how have birds been responding to the environmental cues of spring temperature and foliage
greenup (the greening of plant matter), and (2) to what extent have they been responding in a
manner similar to the arthropods on which they depend?
Temperature plays a key role in the timing of foliage greenup (Zhang et al. 2003), and is
affecting arthropod and bird phenology as well (Hinks et al. 2015, Lany et al. 2015, Visser &
Holleman 2001, Visser & Holleman 2006). For every 1̊ C rise in spring temperature, migratory
bird species in North America are shifting their breeding ground arrival date on average 0.8 days
earlier, with some species arriving as much as 3 to 6 days earlier per 1̊ C rise (Hurlbert & Liang
2012). Though birds are shifting their migration timing, they may be adjusting too little or too
much. A number of studies show climate change-induced mismatches in phenological shifts
across trophic levels. For example, in the Netherlands, the peak date in caterpillar abundance has
been advancing faster than the breeding dates of the bird species that rely on them (Both et al.
2009). Visser and Both (2005) summarized multiple studies on the response of species to a
phenological yardstick, such as oak budburst for the winter moth or the caterpillar biomass peak
for great tits. They found that species often respond too much or too little to changes in timing of
detrimental; many bird species that are unable to adjust their migration patterns show decreasing
population trends (Møller et al. 2008).
While large-scale, high-resolution data exist on temperature (Hart & Bell 2015), greenup
(Tuck & Phillips 2016), and bird phenology (Sullivan et al. 2009), there are no standardized
datasets available on the phenology of foliage arthropods. The citizen science project Caterpillars
Count! was created to address this data gap. I present here the results from this two-summer
study of arthropod seasonal abundance, providing a first glimpse into characterization of
arthropod abundance phenology. The goals of this study are to (1) characterize arthropod
phenology, while also comparing phenologies between arthropod order, site, year, and method,
(2) characterize greenup and spring temperature at sites since 2000, (3) compare greenup and
spring temperature to estimates of arthropod peak occurrence date, (4) compare greenup and
spring temperature to estimates of bird arrival date, and (5) compare estimates of arthropod peak
occurrence date to bird arrival date. Exploring these characterizations and relationships will
begin to provide answers to the key questions mentioned previously.I predict higher peaks for
the individual orders (caterpillars and orthopterans) than combined “bird food” (caterpillars,
orthopterans, spiders, beetles, and true bugs), because arthropods peak at various stages of the
summer and adding more orders could add noise to any individual peaks in abundance. I also
predict differences due to methodology to be order-specific, because arthropod orders respond to
the surveying methods differently. Peak intensity and timing differences due to year may be due
to spring greenup or temperature, and this will be explored as well. I predict later arthropod peak
dates to correspond with later greenup more strongly than temperature, as most arthropods are
directly relying on fresh leaves as food. Using bird arrival date as an estimation for the timing of
reproductive events, I predict bird arrival dates to align with greenup more so than temperature,
arrival date (Hurlbert & Liang 2012), greenup should have a more direct effect on the availability
of arthropod food. Species that are not following trends in arthropod abundance might be
expected to have decreasing population trends in NC. Relevance to migrating birds and their
peak resource need is discussed, along with future goals of large-scale arthropod data collection.
Methods Arthropods
In both 2015 and 2016, foliage arthropods were surveyed from mid-May to late July
twice a week by trained scientists (including PI Hurlbert and students of the Hurlbert Lab) at the
Prairie Ridge Ecostation in Raleigh, NC and the North Carolina Botanical Garden in Chapel Hill,
NC. Survey trees were distributed in groups ("circles") of five around each of the two sites in a
semi-standardized fashion (Figure 1). The center tree in each circle was chosen based on the
existence of sufficient nearby vegetation for sampling. To obtain an unbiased representation of
the woody vegetation at the site, the four remaining survey trees in each circle were chosen by
identifying the first suitable tree (≥50 leaves, each ≥5 cm long) at least 5 meters away in each of
the four cardinal directions from the circle center. A total of 60 survey trees were selected at
Prairie Ridge, and 40 survey trees at the Botanical Garden.
Two types of survey methods were used: 50-leaf visual surveys and beat sheet surveys.
For the visual surveys, observers checked the top and bottom of 50 leaves and associated twigs
of the survey branch from standing height, and recorded the identity (to order) and length of all
arthropods greater than 2 mm. Observers conducted beat sheet surveys by beating a branch over
a 2’ x 2’ white sheet, and then recording the identity and length of all arthropods observed, as
Cleaning and analysis of the arthropod data was conducted in R (R Core Team 2015).
Phenology was characterized using two different variables: mean density per survey by day, and
fraction of surveys on which the taxon occurred by day. Mean density is useful in that it takes
into account the abundance of the arthropod taxon at each survey, a factor that birds may be
relying on. Occurrence, or the fraction of surveys, was used in this study because large outliers
that were surveyed do not affect the possible trends in the data. Note that the occurrence here
represents the average over a week of surveying, so that each point is the mean arthropod
occurrence of the whole week at the middle Julian day (numbered days of the year with January
1 = Julian day 1) of that week. This was done to compare this data to weekly volunteer data,
which will be analyzed in another study. Peak occurrence was estimated by fitting a spline to the
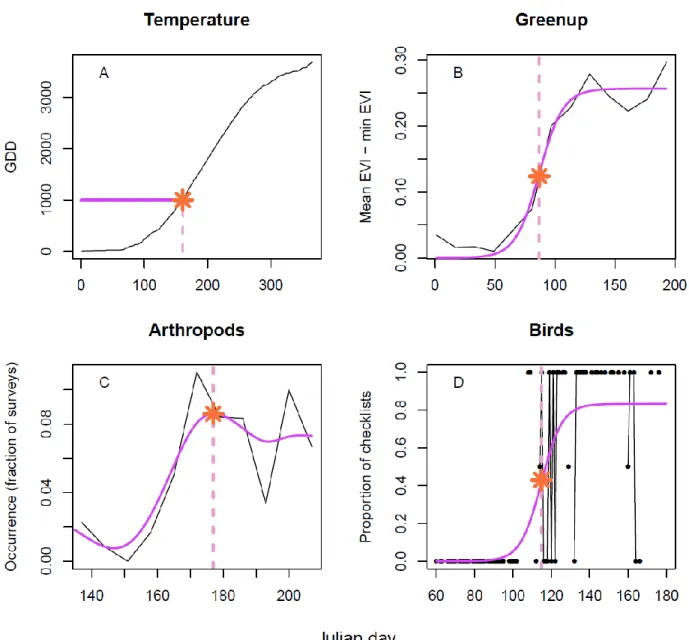
phenology curves and noting the date of the peak in the spline fit (Figure 2C).
Temperature
Average daily temperature data at a 4 km resolution was downloaded for each site from
PRISM using the prism package in R (Hart & Bell 2015). Growing degree day (GDD) units are
used in phenology studies to predict the timing of stages of development, often for plants
(Bonhomme 2000). GDDs were calculated with the temperature data by taking a cumulative sum
over a full year of consecutive daily average temperatures that are above 7 degrees Celsius and
below 30 degrees Celsius (McMaster & Wilhelm 1997), with the date at which 1000 GDDs
(GDD1000) was reached serving as a comparison point (Figure 2A). This threshold, although
arbitrary, was chosen because 1000 GDDs typically accumulates between June 5th and June 15th,
Spring greenup
Enhanced Vegetation Index (EVI) data at a 250 m resolution was downloaded for each
site with the MODISTools package in R (Tuck & Phillips 2016). EVI is a remotely sensed index
of greenness, and usually follows a logistic trajectory into the summer and then a browndown
period in the fall, where the greenness falls quickly. The date of spring greenup was calculated
by fitting a logistic curve to the first 200 days of the year (with EVI data occurring every 16
days) and finding the date of the inflection point (Figure 2B).
Bird arrival
Bird arrival dates were estimated using data from the citizen science website and online
database, eBird (Sullivan et al. 2009). Users of eBird submit checklists of bird species and
abundance they see at a location with unique longitude-latitude coordinates, and indicate how far
they travelled and how long they were birding. Data from eBird for the years 2007 - 2016 was
used to estimate bird arrival dates to the two sites using the general methods described in
Hurlbert and Liang (2012). Focal bird species used include indigo bunting, red-eyed vireo,
common yellowthroat, and blue-gray gnatcatcher, as these species are all migrants that rely on
foliage arthropods and are seen frequently at the two sites. Estimates for bird arrival dates were
found by fitting logistic curves to plots of the proportion of eBird checklists including the focal
bird species, and finding the Julian day of the inflection point (Figure 2D). The proportion of
checklists were used because this adjusted the presence of the focal bird species based on the
amount of birding activity. There is a general tradeoff between estimating bird arrival dates at a
fine spatial scale so as to better pair with the on-the-ground collected field data versus using a
larger spatial scale that would include more observations, and therefore a better estimate of
was sufficient data in the last three to eight years for these focal bird species to estimate bird
arrival date.
Results
Arthropod phenology
Between years, seasonal patterns were present at Prairie Ridge. Caterpillar occurrence
was highest around Julian day 170 both years (Figure 3A, 3B), and orthopterans consistently
peaked later in both years (Figure 3C, 3D). The intensities of the peaks were also similar
between years. The bird food category showed no obvious peak in either year (Figure 3E, 3F).
Occurrence was also usually higher for the beat sheet surveys compared to the visual surveys at
Prairie Ridge (note the green line’s placement compared to the brown line, Figure 3).
At the Botanical Garden, seasonal patterns between years were less consistent. Intensity
of the peak in caterpillar occurrence varied between years, especially for visual surveys (peak
occurrence of 0.19 in 2015 versus 0.09 in 2016 according to spline fits, Figure 4A, 4B). Timing
of peaks also appears less consistent between years than it does at Prairie Ridge. With visual
surveys, the bird food category at the Botanical Garden has clear peaks, unlike the patterns seen
at Prairie Ridge (Figure 4E, 4F).
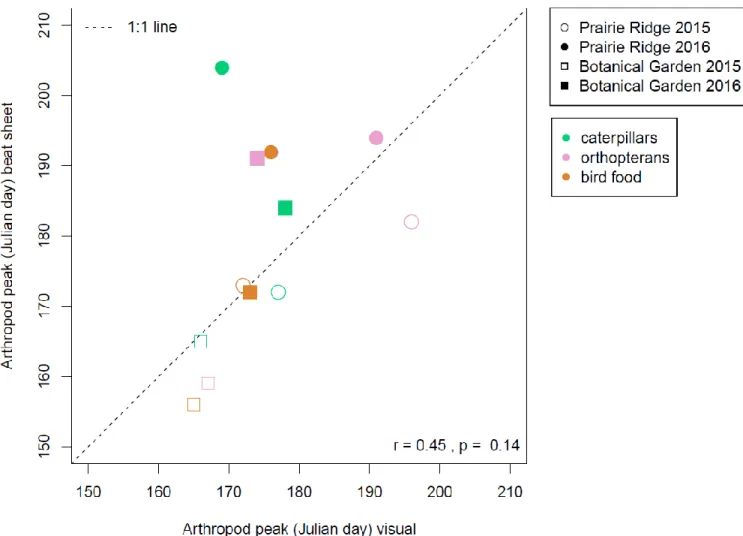
The relationship between peak date estimated by visual surveys versus peak date
estimated by beat sheet surveys gives indication of how survey method might impact estimation
of peak occurrence dates (Figure 5). The two survey methods are generally correlated (r = 0.45, p
= 0.14). Most combinations of arthropod and site fall below the 1:1 relationship in 2015, while
GDD and greenup comparisons between sites
To test whether years with earlier temperature accumulation correspond to years with
earlier greenup, I compared estimates of spring greenup date and GDD1000 date between each
other and at both sites. Deviations from the mean at each site for each predictor variable were
calculated for easier comparison. The deviations for GDD1000dateand spring greenup date are
strongly correlated with each other (r = 0.53, p < 0.01) with estimates generally falling close to
the 1:1 line (Figure 6A). This indicates that years with later accumulation of temperature also
tend to have later greenup. Exceptions include the Botanical Garden in 2004 and 2013, when
greenup was later or earlier, respectively, than what would be expected by the GDD1000 date.
Spring temperature was similar between the two sites across years (r = 0.98, p < 0.01),
with the Botanical Garden usually reaching GDD1000 3 days before Prairie Ridge (Figure 6B).
Greenup date was not strongly correlated between sites (r = 0.22, p = 0.41), although most points
were above the 1:1 line, indicating that greenup at the Botanical Garden usually preceded
greenup at Prairie Ridge (Figure 6C).
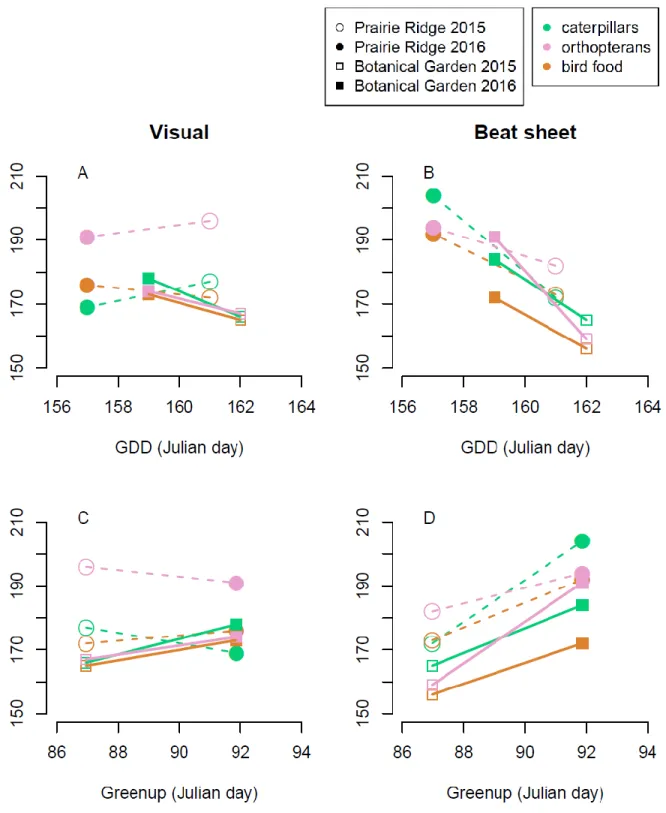
Arthropod peak comparisons to greenup, GDD
To test whether arthropod phenology is corresponding with temperature accumulation
and spring greenup, I compared estimates of these two predictor variables to the timing of
arthropod peak occurrence. The predicted pattern of later predictor variables corresponding with
later arthropod peak occurrence was seen with greenup for all orders at both sites when surveyed
by beat sheet (Figure 7D), and the opposite relationship was seen with GDD for all orders at both
sites when surveyed by beat sheet (Figure 7B). The trends based on visual survey data were more
Bird arrival and greenup, GDD
Over Julian day, the proportion of checklists with the focal bird species started at 0, and
then started rising to higher proportions at a date dependent on the species (Figure 2D). The scale
parameters of the logistic fits usually spanned a time period less than two days, indicating that
the rise in the logistic fits were sharp. Points with narrower 95% confidence intervals on arrival
date were weighted more heavily for the linear models comparing GDD1000 date or greenup
date to bird arrival date. Birds usually arrived later in years with later GDD1000 dates or greenup
dates (Figure 8), even if the relationships had low R2 and high p-values (Table 1). Relationships
of the bird arrival date to the predictor variable were tighter with GDD (mean R2 = 0.57) than
greenup (mean R2 = 0.41) (Figure 8, Table 1). The common yellowthroat and blue-gray
gnatcatcher showed the predicted positive relationship across all four combinations of site and
predictor variable, the red-eyed vireo exhibited a positive relationship at three of the four
combinations, and the indigo bunting only one of four (Figure 8). Arrival date is variable for the
four focal species, but especially the common yellowthroat.
Bird arrival and arthropod peak occurrence
The red-eyed vireo arrives later at both sites with later arthropod peak occurrence
according to beat sheet surveys (Figure 9D). The opposite occurs for the common yellowthroat
and blue-gray gnatcatcher according to beat sheet surveys (Figure 9F, 9H). The visual surveys
are similar to these three bird species’ relationships to arthropod peak occurrence date at the
Botanical Garden, but are variable at Prairie Ridge (Figure 9C, 9E, 9G). The indigo bunting had
identical estimates of arrival date in both years despite variation in both GDD1000 date and
Discussion
The arthropod phenology dataset that was collected and used in this study is novel in its
ability to address important questions in climate change ecology, as arthropod abundance is the
missing link in a chain of phenological events that impact birds and other organisms.
Furthermore, this is one of the first studies in North America to simultaneously consider bird
migration phenology with respect to arthropod phenology, spring greenup, and temperature.
Seasonal peaking of arthropod availability is present, differing in timing and intensity
with order, site, and year. Most groups of arthropods (caterpillars, orthopterans, and bird food)
exhibit a peak during the summer season. The bird food category exhibited a broader peak at
Prairie Ridge, likely due to different orders peaking at various stages throughout the summer.
Within an order, variability between species in phenological timing might also contribute to how
broad a peak in abundance or occurrence may be. This matters because a narrow phenological
peak in resource availability for a migrating bird species might make it more susceptible to
phenological mismatch. The broader the peak in arthropod abundance, the higher chance that
nesting timing will overlap with a time of greater resource availability (Miller-Rushing et al.
2010). Caterpillars and orthopterans are often listed as key arthropod orders in an insectivorous
bird species’ diet (Poole 2005), but more work must be done in characterizing the diets of
hatchlings specifically. If more is known about what is required for feeding a hatchling during
the critical period of resource need, there will be a better understanding of how reproductive
success is affected by changes in arthropod phenology, as we will be able to predict which bird
species are phenologically mismatching with their specific arthropod prey. Still, it is significant
that caterpillars and orthopterans, composing a large fraction of the prey that is needed for
amount of food resources is thus not always available to birds depending on the timing of their
migrations and reproductive events.
The nature of the survey method likely caused differences in the results for beat sheet
surveys and visual surveys. With a visual survey, there is more room for human error while
checking each leaf. Arthropods that are able to camouflage themselves are likely to be missed in
the count. With the beat sheet surveys, arthropods that are particularly mobile when the branch is
disturbed might fly or hop away and not be observed on the beat sheet. This includes
orthopterans that can jump in any direction when a branch is hit. Arthropods that are able to cling
to a leaf strongly might also be missed in the beat sheet counts, such as caterpillars.
Peak occurrence dates for arthropods did not consistently track GDDs or spring greenup,
although there was a trend of later arthropod peak dates correlating with later greenup date
according to beat sheet surveys at both sites (Figure 7D). With only two years of data, I was
unable to fully evaluate the effects of spring greenup and GDD on arthropod phenology. Peaks in
arthropod phenology are predicted to correlate more with spring greenup rather than GDD,
because arthropods, especially caterpillars, are directly affected by greenup as a food source.
Yet, the relationship between GDD and spring greenup (r = 0.53, p < 0.01) indicates that
temperature might also indirectly affect arthropod phenology. If arthropods shift in peak timing
in response to the timing of greenup and GDD, I would expect positive slopes for all plots. It is
relevant to note that the occurrence was used to calculate timing of peaks, when it might be more
accurate to use biomass phenology data, since birds are interested in the amount of energy they
gain when consuming prey. Dates of peak occurrence also occasionally do not occur within the
relevant time window for migrating birds. For example, beat sheet surveys of caterpillars in 2016
edge of the time window. Patterns relating to the tendency of an arthropod order to peak over the
summer would be more evident with more sites and years of collecting data.
Bird arrival dates tracked GDDs and spring greenup, but most relationships were not
significant, likely due to low sample size. It was thought that bird arrival would have a stronger
relationship with greenup because this is a more directly related yardstick, yet there was a tighter
relationship with GDD. In terms of the variability of arrival date, the species that show more
variability, such as the common yellowthroat, may be able to track environmental cues better.
For some species, migration timing may be more internal or instinctive so they arrive the same
time every year, making them more prone to mismatch. Most species were variable in their
arrival dates, at least at this scale. The sample size for most species was small due to the size of
the sites and the frequency of activity of birders, making any patterns difficult to discover.
Some bird species showed patterns in their arrival date related to arthropod peak date,
and this relationship has the potential, with the continuation of this project, to explain population
trends of these species in NC. The indigo bunting, red-eyed vireo, and common yellowthroat all
show decreasing population trends in North Carolina from 2005 to 2015 (-1.77, -0.87, and -2.12,
respectively) (BBS). The common yellowthroat, with the most decreasing population trend, was
one of the species that had patterns of later arrival with earlier arthropod peak date. However, the
blue-gray gnatcatcher also had these patterns and has a population trend of +0.93. The red-eyed
vireo was the only bird in this study with frequent patterns of later arrival in response to later
arthropod peak occurrence, and it had the least decreasing population trend. The red-eyed vireo
might be better at picking up on cues that will directly affect their reproductive success, while
other species could be following trends that are not going to aid the success of their breeding
relation to temperature (Hurlbert & Liang 2012). It also has a slow migration speed, so it may be
picking up on environmental cues more thoroughly than other species (Hurlbert & Liang 2012).
There are complications involved in measuring and interpreting avian phenology. The
effect of arthropod abundance phenology on reproductive success is likely to vary based on the
broadness of the diet of the hatchlings of that species. Species that are generalists would be able
to adapt better to changes in phenology than species that are specialists. Likewise, migratory
species are more prone to being affected by changes in arthropod phenology, compared to
resident species, because they do not have the same amount of time to pick up on cues in the
spring before starting their breeding period. It is also relevant to note the scale that these
interactions are occurring at. Occurrence was calculated across the field site, when birds may be
constrained to much smaller ranges while feeding their hatchlings (Hinks et al. 2015). Also, due
to limitations in data, I only looked at bird arrival date, though this date is assumed to be parallel
to reproductive timing.
There is more work to be done to gauge how much arthropod peak occurrence timing is
affected by temperature and spring greenup, and how much bird arrival date is affected by
temperature, spring greenup, and arthropod peak occurrence. The arthropod phenology results
from these two summers can be used to determine how to efficiently set up new field sites and
survey routines. It is possible that beat sheets are picking up on any existing trends more easily
than visual surveys because arthropods are more visible to the surveyor. More frequent surveying
throughout the summer also may have the potential to pick up on nuanced phenologies. More
years of arthropod phenology data will be helpful in identifying how spring greenup and GDD
relate to seasonal peaks in arthropod abundance. Quantifying the intensity of arthropod peaks
and comparing this between order would provide a better understanding of the patterns regarding
The earth continues to warm, and plants are following this trend with earlier greening
(Schwartz et al. 2006) Climate change has been shown to be predictor of arthropod phenology
(Cayton et al. 2015), and has also played a significant role in decreasing population trends of
North American birds (Reif 2013), with migratory birds especially at risk (Møller et al. 2008).
The results here, along with other phenology studies (Hinks et al. 2015, Lany et al. 2015, Visser
& Holleman 2001, Visser & Holleman 2006), indicate that birds and arthropods are responding
to changes in their resources, illustrating a need to address climate change and its impact on
ecosystems.
Acknowledgements
I would like to thank Dr. Allen Hurlbert for mentoring me and helping me to grow
throughout this research. I would also like to thank the rest of the Hurlbert Lab, specifically Sara
Snell, Robbie Burger, Molly Jenkins, and Tara McKinnon for help and support along the way. I
thank Dr. Amy Maddox and my writing group, including Anita Simha, Josh Hanover, and Tara
McKinnon, for feedback on the written thesis. I thank the Office of Undergraduate Research,
Summer Undergraduate Research Fellowship, and Taylor Honors Fellowship for opportunities
References
Bonhomme, R. 2000. Bases and limits to ‘degree.day’ units. European Journal of Agronomy 13:
1-10.
Both, C., Van Asch, M., Bijlsma, R. G., Van Den Burg, A. B. & Visser, M. E. 2009. Climate
change and unequal phenological changes across four trophic levels: constraints or
adaptations?. Journal of Animal Ecology 78: 73–83.
Cayton, H. L., Haddad, N. M., Gross, K., Diamond, S. E., & Ries, L. 2015. Do growing degree
days predict phenology across butterfly species? Ecology 96: 1473-1479.
eBird. 2012. eBird: An online database of bird distribution and abundance [web application].
eBird, Ithaca, New York. Available: http://www.ebird.org. (Accessed: September 20,
2016).
Hart, E. M., & Bell, K. 2015. prism: Download data from the Oregon prism project. R package
version 0.0.6 http://github.com/ropensci/prism DOI: 10.5281/zenodo.33663
Hinks, A. E., Cole, E. F., Daniels, K. J., Wilkin, T. A., Nakagawa, S., & Sheldon, B. C. 2015.
Scale-dependent phenological synchrony between songbirds and their caterpillar food
source. The American Naturalist 186: 84-97.
Hurlbert, A. H. & Liang, Z. F. 2012. Spatiotemporal variation in avian migration phenology:
citizen science reveals effects of climate change. PLoS ONE 7: e31662.
Lany, N. K., Ayres, M. P., Stange, E. E., Sillet, T. S., Rodenhouse, N. L., & Holmes, R. T. 2015.
Breeding timed to maximize reproductive success for a migratory songbird: the
importance of phenological asynchrony. Oikos 000: 001:011.
McMaster, G. S. & Wilhelm, W. W. 1997. Growing degree-days: one equation, two
interpretations. Agricultural and Forest Meteorology 87: 291-300.
mismatches on demography. Phil. Trans. R. Soc. B. 365: 3177-3186.
Møller, A. P., Rubolini, D., & Lehikoinen, E. 2008. Populations of migratory bird species that
did not show a phenological response to climate change are declining. PNAS 105: 42.
North American Breeding Bird Survey Trend Results (BBS). USGS- Patuxent Wildlife Research
Center. http://www.mbr-pwrc.usgs.gov/.
Poole, A. (Editor). 2005. The Birds of North America Online. Cornell Laboratory of
Ornithology, Ithaca, NY; Accessed July 2015. http://bna.birds.cornell.edu/BNA/.
R Core Team. 2015. R: A language and environment for statistical computing. R Foundation for
Statistical Computing, Vienna, Austria. URL https://www.R-project.org/.
Reif, J. 2013. Long-term trends in bird populations: a review of patterns and potential drivers in
North America and Europe. Acta Ornithologica 48: 1-16.
Schwartz, M. D., Ahas, R., & Aasa, A. 2006. Onset of spring starting earlier across the Northern
Hemisphere. Global Change Biology 12: 343-351.
Sullivan, B.L., Wood, C.L., Iliff, M.J., Bonney, R.E., Fink, D., & Kelling, S. 2009. eBird: a
citizen-based bird observation network in the biological sciences. Biological
Conservation 142: 2282-2292.
Tuck, S., & Phillips, H. 2016. MODISTools: MODIS Subsetting Tools. R package version
0.95.0, <URL: http://cran.r-project.org/package=MODISTools>.
Visser, M. E. & Both, C. 2005. Shifts in phenology due to global climate change: the need for a
yardstick. Proc. R. Soc. B 272: 2561-2569.
Visser, M. E. & Holleman, L. J. M. 2001. Warmer springs disrupt the synchrony of oak and
winter moth phenology. Proc. R. Soc. Lond. B 268: 289-294.
Visser, M. E. & Holleman, L. J. M. 2006. Shifts in caterpillar biomass phenology due to climate
164-172.
Walther, G. R., Post, E., Convey, P., Menzel, A., Parmesan, C., Beebee, T. J. C., & Fromentin, J.
M., et al. 2002. Ecological responses to recent climate change. Nature 416: 389–395.
Zhang, X., Friedl, M. A., Schaaf, C. B., & Strahler, A. H. 2004. Climate controls on vegetation
phenological patterns in northern mid- and high latitudes inferred from MODIS data.
Global Change Biology 10: 1133-1145.
Appendix
R scripts used for this project can be found in the Caterpillars Count GitHub repository,
https://github.com/hurlbertlab/caterpillars-count-analysis. Relevant scripts include:
summary_functions.r, data_cleaning.R, prism_10year.R, modis_10year.R, spline_thesis.R,
Figure 7. A, B. Julian day of the peak date of caterpillar (green), orthopteran (pink), or bird food (orange) occurrence as a function of GDD1000 date. C, D. Julian day of the peak date of caterpillar, orthopteran, or bird food occurrence as a function of spring greenup date. Peak arthropod occurrence dates are based on visual surveys (left column) and beat sheets surveys (right column). Segments connected between years (open shapes, 2015; closed shapes, 2016) for a given site (circles, Prairie Ridge; squares, Botanical Garden) and arthropod group (colors).
Species Site Metric R2 p
Indigo bunting PR GDD 0.68 0.09
Red-eyed vireo PR GDD 0.97 0.11
Common yellowthroat PR GDD 0.47 0.31
Blue-gray gnatcatcher PR GDD 0.58 0.13
Indigo bunting BG GDD 0.3 0.21
Red-eyed vireo BG GDD 0.86 0
Common yellowthroat BG GDD 0.55 0.04
Blue-gray gnatcatcher BG GDD 0.19 0.29
Indigo bunting PR Greenup 0.62 0.11
Red-eyed vireo PR Greenup 0.93 0.17
Common yellowthroat PR Greenup 0.53 0.28
Blue-gray gnatcatcher PR Greenup 0.26 0.38
Indigo bunting BG Greenup 0.02 0.74
Red-eyed vireo BG Greenup 0.45 0.1
Common yellowthroat BG Greenup 0.46 0.06
Blue-gray gnatcatcher BG Greenup 0.18 0.3
Table 1. R2 and p-values for weighted linear models for each bird