In the latter half of the 1990s, Cary launched an active program of constructing dedicated pedestrian and bicycle facilities. While Cary has been aggressive in building these new facilities, no information was available on their usage. Realizing this shortcoming, the Town of Cary’s Greenway Committee, composed of citizen volunteers and serving the Parks, Recreation, and Cultural Resources Advisory Board, launched a program to measure greenway use. To date, this count program has been under way for three years.
A goal at the outset was that this information would increase support for the overall program and help the Committee and Town staff identify which facilities were well used and which were not attracting patrons. These baseline measurements are valuable benchmarks for setting future goals since these facilities will eventually link together to form a transportation network throughout the town and with adjacent jurisdictions.
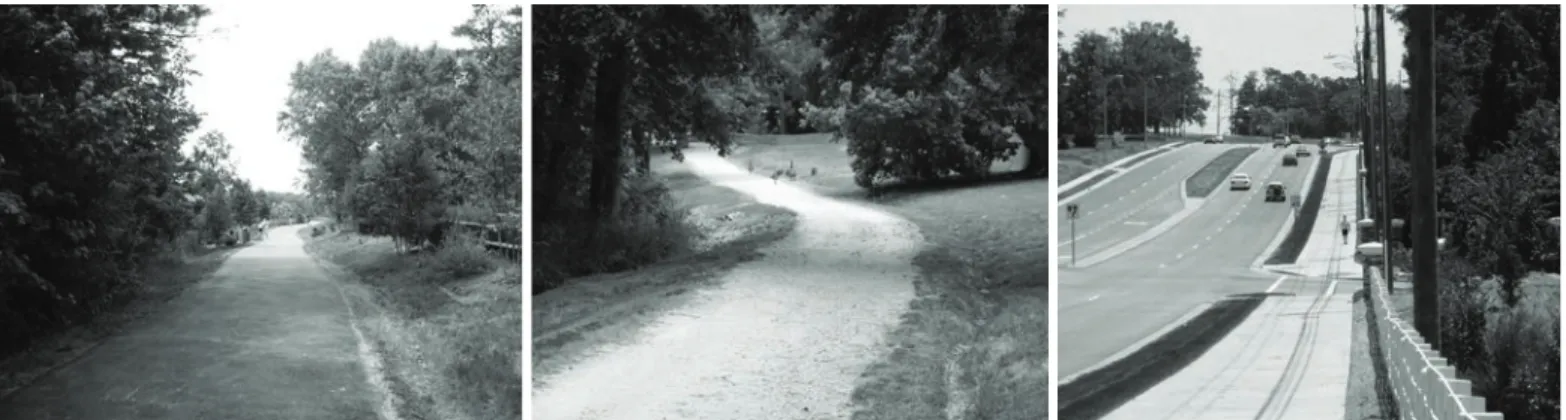
The Town of Cary has three types of dedicated pedestrian and bicycle facilities: greenways, trails, and multi-use paths (Figure 1). Greenways are paved, off-road facilities; trails are unpaved greenways, generally with a crushed-gravel surface; and multi-use paths are wide
sidewalks, either concrete or asphalt, located adjacent to a roadway. These facilities can be grouped into two classes: metro facilities, which attract users from throughout Cary and surrounding towns; and neighborhood facilities, which are used primarily by those who live, work, or shop in close proximity, generally within walking distance. Throughout this study, “facility” is used as a generic term to describe greenways, trails, or multi-use paths in either of these settings. “Segments” are portions of any of these facilities and represent the basic geographic unit of the
observation.
The study revealed that overall median usage for any segment is 11.35 users per hour on weekends. Metro segments have a much greater usage than do neighborhood segments, with 44.42 users per hour, compared to 8.40 users per hour. In addition, locating facilities alongside a lake, providing more access to surrounding development,
If You Build It, Will They Come?
Measuring Greenway Usage in Cary, N.C.
Robert Bush, AICP
A decade ago, the Town of Cary, N.C. implemented a greenway program but had no information available on the
facilities’ usage. To address this shortcoming, the Town’s volunteer Greenway Committee initiated a program
in 2007 to measure weekend greenway use. Study results showed that overall median usage for any segment
on weekends is 11.35 users per hour. User counts were much higher on metro segments than on neighborhood
segments. In addition, locating facilities alongside certain amenities, such as a lake or trailhead parking,
may increase usage. Overall, walking was the most prevalent mode of travel. Temperature was found to have
a definite impact on usage, with the highest usage occurring when temperatures were in the 60°Fs. There is
little variation by time period or day; the notable exception is Sunday evening, when the median usage level
increases to 15.28 users per hour. These results should provide a good guide for comparable suburban cities
in similar climates regarding the potential weekend usage of their greenways.
Robert Bush, AICP, is chair of Cary’s Greenway Committee and
and providing parking at a trailhead may increase usage.
The Setting
Cary, N.C., is a rapidly growing suburb of Raleigh. Cary has seen phenomenal growth during the last half-century, with the population at least doubling at each decennial Census since 1950. At that time, Cary had a population of just 1,496, but by 2000, it had grown to 94,536, with further increases leading to an estimated 137,483 by October 2009 (Town of Cary Estimate). In 2009, Cary’s municipal limits encompassed 55.34 square miles, up from 9.86 square miles in 1980. The current estimate of population density is 2,484 persons per square mile. By comparison, Raleigh had an estimated density of 2,630 in 2007 (City of Raleigh Comprehensive Plan, 2009).
Cary’s greenway program began in the late 1970s, with the first trail opening in 1979. A few additional Town greenways and trails were opened during the 1980s, but the majority of the facility construction during this period was completed by private developers. Two planned unit developments, Kildaire Farms and Lochmere, included construction of extensive trail systems. These facilities are both paved and unpaved, but they are not part of the public system.
From the late 1980s to 1995, leaders and residents of Cary became more serious about constructing a network of greenways and similar facilities. By the time the first formal greenway plan was completed in 1995, the public system of greenways and trails was 10 miles long, with 25 miles ultimately proposed. In 1998, the plan was updated to recommend the development of a continuous system of greenways, trails, and bikeways throughout Cary, which would transform the fragmented paths into a system serving both recreational and commuting trips. The system as proposed would have approximately 70 miles of greenways and trails, and 50 miles of bikeways. The plan was further updated in 2003, expanding the network to 160 miles.
In addition to this extensive planning, the Town enacted a series of ordinances that have been essential to the creation of a system of trails. For example, in the late 1970s the Town Council passed a land dedication
ordinance that required a greenway easement for those properties under development where an approved public greenway had been proposed.
The ability to obtain easements was further enhanced after 2000, when the Town approved a stream buffer ordinance. The Town now requires 50- or 100-foot buffers, depending on the stream classification, and greenway construction is permitted in the outer edge of the 100-foot buffers. With all new development subject to this requirement, more land is available for the construction of greenways. In addition, new greenways are now possible through the acquisition of joint sewer and greenway easements through new, and in some cases existing, developments. In 2004, the Town began to negotiate actively with developers to provide them with credits to construct public greenways in lieu of paying required recreational fees. Developers are seeing benefits in locating properties along a Town-designated facility, as evidenced by more home listings noting the proximity to a greenway, and by reduced developer opposition to
greenway funding and construction.
Currently, the Town of Cary’s greenway system is 58 miles long. With an additional 17 miles under development, the greenway system is still evolving. While extensive construction has taken place, the majority of facilities are short and not well connected. This separation reflects the pace and location of new residential developments on former farmland. The Town is actively filling in the gaps between developer-built greenways and is extending the system into older areas of town, but available funding levels and the lingering difficulties in securing new easements have slowed implementation of a unified system. Figure 2 shows Cary’s existing public system.1
In addition to path fragmentation, the Town faces the challenge of an uninformed public regarding the greenway system. Most of the constructed greenways, trails, and paths do not have signage beyond “no motor vehicles” or “greenway closes at sunset.” The original eight segments do have entrance signs (known locally as “tombstone” signs after their shape) and posted maps, and the private greenways have a trail icon; however, facilities constructed since 2000 did not include any signage until late last year. As a result, most users learn of local facilities
by happening upon them, through word of mouth, or via the Town’s greenway and bikeway map.2
The Town recently completed a signage study for all parks, recreation, and cultural resources and has begun installing signs along the greenways. Four greenways have the new signage, which is expected to increase visibility and usage of the facilities.
Methodology
The Greenway Committee’s objective was to measure usage of the greenways, trails, and paths. A count could be conducted in one of two ways: a check at a single point on a segment (point check), or a check along the entire length of a segment (walking check). A point check would be analogous to roadway traffic counts that are made at individual locations along a roadway. Most reported greenway counts around the country are point checks. In Cary’s case, no data was available to indicate which facilities were more heavily used, much less to identify segments where the highest usage occurred. Point checks also would not provide any information on usage between check locations.
Due to these drawbacks, the Committee opted to conduct a walking check instead of a point check. The advantage of a walking check is that it checks all portions of a greenway segment, not just the number of users passing a single location. For segments with multiple access points, a walking check also provides a more comprehensive evaluation of usage along the entire length, allowing at minimum a subjective identification of areas with higher and lower usage. This approach has the added benefits of allowing Greenway Committee members the
opportunity to become more familiar with the facilities and to identify any maintenance needs.
Observation Period
Since the principal objective of the study was to identify hourly usage for the system as a whole and to note variation among facilities, an observation period for each check was set at approximately one hour. To provide for some flexibility, a minimum observation time of 50 minutes was set for each facility, with a desired maximum observation time of 70 minutes. For shorter facilities or segments, two roundtrips were often required to provide the minimum 50-minute observation time. Longer facilities were divided into smaller segments, if required, to reduce the observation time to less than 70 minutes (see following section for further discussion). Overall, 87% of the checks fell within these parameters.
Checks were made by Greenway Committee volunteers only during weekends. No observations were made during weekdays because most volunteers had regular weekday jobs. Therefore, the results to-date do
not provide information related to potential usage of the facilities for work or school commutes.
Checks were taken during daylight hours (the official hours the greenways are open). Over the course of a year, there are just over 633 weekend daylight hours – an average of 10.5 hours per day in fall and winter, and nearly 14 hours per day in spring and summer.
Segment Selection
Segments were established as the basic observation unit. A broad net was cast to count as many facilities as possible. Facilities encompassed public and private greenways and trails within Cary, as well as segments in adjacent jurisdictions scheduled to connect with Cary’s public system. Without any previous information available, it was unknown whether Cary’s facilities were used more or less heavily than those of other systems in the area. A broad check would permit this comparison.
for observation. Break points between segments were selected based upon a combination of easily identifiable locations, the length of the resulting segments, and the physical characteristics of the facilities. For example, in a facility with approximately equal portions that were paved and unpaved, the segment breakpoint would coincide with the change in the facility surface. The Greenway Committee ultimately identified a total of 53 segments.
Given the system’s ongoing development in Cary, most facilities had only one segment. Of the 53 segments, eight would be considered part of a longer facility. For example, the Black Creek Greenway has several segments, but from a user’s perspective these are separate facilities due to gaps or other distinctive breaks where the greenway crosses a major roadway. Only the northern portion had to be segmented due to its length – Black Creek-Lake Crabtree and Black Creek-North Dynasty would be considered by users as a single facility, but the resulting length of 2.4 miles was too long to permit a roundtrip observation within 70 minutes. Similarly, three other facilities required segmentation: the White Oak Green Level West and White Oak Church-Chatham County segments of a 2.1-mile stretch of the American Tobacco Trail (ATT); the 3.3-mile Davis Drive Path-North and South segments, and the 3.6-mile White Oak Creek and White Oak-West segments.
Extremely short facilities (those less than 0.6 miles) and those located in newer, unpopulated neighborhoods were not included in the segment selection, due to their extremely low usage. Including these facilities would have distorted the overall picture of facilities’ usage within the Town. Some short facilities, notably those that will eventually be part of a major greenway or that will be modified in the near future, were included; these constituted only 15% of the observations.
Sampling Plan
Since no data had been previously collected, this count was designed to determine the relative use of all facilities as well as to develop an estimate of the overall usage of the system. Checks were not limited to the peak hours; rather, they were made year-round throughout weekend days to provide a complete picture.
The Greenway Committee adopted a two-step selection process to determine the sample. First, a sample set of segments was randomly selected for each member of the Greenway Committee to observe; these segments were then placed in a random order. Second, each segment was randomly assigned a day (Saturday or Sunday) and observation period to be checked. To provide flexibility to the volunteer committee members, the day was divided into three time periods: Morning (sunrise to midday), Midday (the middle one-third of daylight hours), and Evening (midday to sunset). The breakpoints varied by season, but were around 11 a.m. and 2:30-3:30 p.m. Checkers were instructed to conduct their checks in the order assigned on their selected day and within the hours
for the assigned time period. A new sample was drawn for each checker every three months.
A further sample was made consisting of all 53 segments in random order, with a randomly assigned day and time period. Since no data existed on any facility, this additional sample ensured that some data was collected on each facility. Initially, all segments were checked each quarter, but as the database became more substantial, this frequency was reduced so that each segment was checked at least once per year.
Checking Procedure
During the assigned check period, the checker was instructed to walk the designated segment. A simple form was provided upon which the checkers recorded the mode of travel of the users by placing tic marks for each user of that mode. Eleven different modes were identified, including an “other” category for unusual circumstances. The modes are described in a later section.
Checkers were instructed to count users each time a “meet” or “overtake” occurred. A runner who repeatedly passed a checker would be counted at each encounter; no attempt was made to keep track of individual users. The intent was to replicate the type of count that would result from a stationary automated traffic counter, where each vehicle is counted every time it passes the counter. In the walking check, a user was counted each time he/she passed the (moving) counter.
Checkers gathered additional information on demographics, such as sex, race, and age of the users. Such an approach is admittedly subjective for the race, age, and sometimes sex categories and therefore is not reproduced here. While subjective, this information does provide some general indication of who the users are on the greenways, trails, and paths. Checkers also recorded the number of users traveling together (pairs or groups) and the temperature at the time of the check.
Checkers were instructed to make their checks throughout the annual quarter so that observations were made in all seasons and conditions. This instruction was tempered by the limitation that checks should be made during normal conditions. Checks were not conducted during special events (e.g., a run or festival along the facility), during rain (or occasionally snow), or during extreme temperatures (less than 25°F or more than 95°F).
Results
Systemwide
Throughout the system, the median number of weekend users per hour is 11.35. This amount is the median for all segments, all time periods, and all temperatures. As Figure 3 shows, the 95% confidence interval is quite narrow at 10.59 to 12.00 users per hour.
This narrow band for the system as a whole masks some differences among the segments. Next to the overall median, the median and confidence interval are shown by type of facility. As illustrated, the median number of users for greenways (13.20) and trails (13.47) is almost
three times higher than the median number of users for
paths (5.39). The conclusion could be that paths are much poorer performers and that greenways (paved) and trails (unpaved) are about the same. This analysis also masks some important information.
The third set of bars shows a truer picture of usage. Segments have been grouped as metro facilities serving the entire Cary community, or neighborhood facilities serving a much smaller area. The Greenway Committee grouped each segment based on its qualitative characteristics, since members did not conduct interviews with users to determine how far the users traveled to access the facility. Metro facilities have been identified by the presence of well-used parking, indicating that users traveled from farther distances; as well as subjective observations of long-distance travelers (pace of travel, presence of a water/juice bottle belt, and recognition of individuals seen on multiple segments). Coincidentally, most of the metro segments will become part of the East Coast Greenway,4
a facility planned to offer off-road travel from Maine to Florida. In the Cary area, this greenway will consist of the American Tobacco Trail, White Oak Greenway, and Black Creek Greenway.
The results indicate considerable differences between metro and neighborhood facility usage. Metro segments have a median of 44.42 users per hour, while neighborhood segments have a median of 8.40 users per hour. The 95% confidence intervals are 38.57 to 49.09 for metro segments and 7.50 to 9.06 for neighborhood segments. The metro results should be interpreted with some caution because there are only 210 observations on 13 segments. The neighborhood results are firmer since there are 616 observations on 40 segments. Additional metro facilities are under development and will be included in future counts, thereby improving the accuracy
of these results.
While these usage levels may not sound impressive,
especially compared with traffic volumes, the usage adds up. Total estimated usage on any given Saturday or Sunday for this system is 10,756 users, and 1,118,285 weekend users over the course of a year. Given Cary’s population of 137,483, the equivalent of 8% of residents use a facility every weekend day, and the typical Cary resident uses a facility eight times on weekends during a year. Weekday usage only adds to these levels. Based on available Town data, no other park, recreation, or cultural resource in Cary approaches this level of patronage.
Individual Segments
The individual segments showed some variation from their class median. Figure 4 shows the median and confidence interval for the metro segments, and Figure 5 shows the same for the neighborhood segments. Only segments with at least nine observations are shown. The differences among the segments offer some insights into what makes for a more heavily used segment – such as parking availability, connectivity to surrounding Figure 3: Median Usage by Class (Overall, Facility Type, and Segment Type).
Median with 95% Confidence Interval by Type
neighborhoods, and presence of other amenities (e.g., park or lake features).
As the graph in Figure 4 shows, four different usage groups emerged within the metro segments. Apex Lake Greenway stands alone with the highest usage, at 124.47 users per hour, with a 95% confidence interval of 87.00 to 160.38. This usage is about twice as high as the next group, likely due to several characteristics: the Apex Lake Greenway is a circumferential greenway around Apex Lake, and is contained within the Apex Community Park; ample parking is provided, along with direct connections to an adjacent apartment complex; and a gazebo is located on the lake shoreline. Cary’s greenway plans call for eventually connecting a major greenway into this facility.
The second group – segments with usage between 60 and 70 users per hour – consists of two segments: one that is part of the American Tobacco Trail (ATT) and another that is part of the Black Creek Greenway. The ATT is a rail-to-trail facility that has recently been extended to 13.5 miles; the segment in the second-highest usage group includes a trailhead with ample parking. The Black Creek segment, located alongside Lake Crabtree, is part of the current 2.4-mile Black Creek Greenway. Connecting spurs are offered to an adjacent apartment complex and neighborhoods. A gazebo is located on the lake shoreline. Informal parking alongside a roadway is located at one end, but it was often over capacity, and demand for this segment may be constrained by the lack of adequate parking.
The third group includes seven segments with usage of 30 to 45 users per hour. These segments connect with two segments in the second-highest-usage group and four greenways or trails in the 310-acre Bond Park – Cary’s metro park. This park has a lake with a boathouse and ample parking. It will be the central hub for Cary’s
greenway system. The last segment is part of the other metro greenway, the White Oak Greenway. This segment is disconnected from Bond Park, but offers some parking and connecting spurs to nearby single-family neighborhoods.
The fourth group has one segment – the outer segment of the White Oak Greenway. This segment had the lowest number of hourly users for the metro greenways, at 16.82 users per hour. This western segment is more isolated than the other segments, since few neighborhoods exist in this area and no connecting spurs are in place. No parking exists on this segment, although users have developed an informal roadside parking lot. Usage on this facility is anticipated to increase over time, especially if a trailhead is constructed.
The neighborhood class (Figure 5) also has four rough groups of segments. As with the metro class, one greenway is at the top by itself: the Loch Lomond Lake Greenway, with 39.29 users per hour. This greenway circles a neighborhood lake, and although no parking is provided, there is good connectivity to single-family and multi-family developments in the area.
Three segments are in the second group with usage between 20 and 25 users per hour. These three segments are all surrounding or alongside a lake. Symphony Lake Greenway is located primarily in an office park, while the other two are located within neighborhoods.
The largest group consists of 27 segments with usage between four users per hour and 15 users per hour. These segments include a wide variety of greenways, trails, and paths that are publicly and privately owned and located in residential, retail, and office developments. Some of these segments are short, while others are more than one mile long. The users appear to come from the immediate area, with only limited parking offered for most segments. The wide range of usage along the Indian Creek Greenway Figure 4: Metro Segments, Median Usage.
Median Metro Users/Hour with 95% Confidence Interval
likely reflects the newness of this greenway and the limited number of checks. This greenway is anticipated to stabilize closer to the top of its range.
The lowest-usage group consists of six segments with fewer than four users per hour. Three of these segments are multi-use paths located alongside a roadway; one is a short private greenway located within a neighborhood; another is located in an office park with no nearby residential development; and the third segment is a short trail.
Usage by Travel Mode
Travel mode of users was reported for the system as a whole (“overall”) and for the metro and neighborhood segments separately. Four travel modes accounted for 94% of the facilities’ usage: walking, traveling-with-pet, running, and bicycling. Seven other types of travel modes were recorded: wheelchair, skate, skateboard, scooter, stroller, baby-in-arms, horse riding, and other.
Overall, walking was the most prevalent mode of travel, recorded for 39% of the users. Biking was second most popular, with 24%, and traveling-with-pet and running were tied at 15% each. The traveling-with-pet category encompassed all modes where the user was out with his or her pet. Most such users were walking a dog, but others were running or riding a bike and at least one user was walking her cat. Bicycling encompasses traveling by two wheels, whereas bike trailers, tag-alongs, bike seats, and tricycles are all in the “other” category.
The type of travel mode varied somewhat by facility class. Metro segments had higher usage by runners and bicyclists, while neighborhood segments had higher usage by walkers and traveling-with-pet. The greatest usage differences between metro and neighborhood facilities was for walking (37% vs. 45%) and bicycling (29% vs. 17%).
Levels of activity in the “other” travel modes were
lower than what the Greenway Committee anticipated at the outset. The wheelchair category deserves special mention. Wheelchair use on greenways, trails, and paths was extremely low, with only five users out of 16,768 recorded using a wheelchair. Of the “other” category, strollers had the highest use, with 3%; the remaining “other” modes each had usage below 1%. Two greenways serve the Ska8-Cary Park, but these segments did not show a significantly higher usage by skaters or skateboarders. Moreover, the “horse riding” category only applies to the ATT where horses are permitted.
Usage by Temperature
Checkers were instructed to record the temperature at the time of each check, in order to account for different usage levels in varying weather. This measurement is somewhat subjective depending upon whether the temperature was measured at the segment (such as by the temperature reading in a car), or by the reported temperature at the nearby Raleigh/Durham International Airport. Temperature could also vary by 10 degrees or more over the course of a check, depending on the time of day.
Given these qualifiers, the results by temperature are insightful. Figure 6 illustrates the results for all facilities regardless of class, compared with the overall median, by 10°F increments. There is a clear central tendency when temperatures are in the 60°Fs, with a usage level of 18.69 users per hour. Usage shows a smooth drop-off as temperatures increased or decreased, down to a level of just 6.00 users per hour when the temperature was 30°F or 90°F. The results should be viewed cautiously because sample sizes are still small, ranging from 35 to 208 observations for each 10-degree range. Checks were made when the temperature was in the 20°Fs, but only three such checks were recorded and these results are not shown. Figure 5: Neighborhood Segments, Median Usage.
Median Neighborhood Users/Hour with 95% Confidence Interval
Usage by Time Period and Day of Week
As noted in the sampling plan, the day was divided into three time periods each on Saturday and Sunday. This division was reflective of the idea that the checkers needed some flexibility in their assignments, and the realization that the accuracy by any shorter division would be poor. Three time periods per day provides some indication of whether usage varies much over the daylight hours.
There is little variation by time period or day, with
most showing a median usage near the overall median of
11.35 users per hour. The notable exception is Sunday evening, when the median usage level increases to 15.28 users per hour. Sample sizes are still somewhat small, with the number of samples per time period ranging from 96 observations to 171 observations.
Conclusions
The ongoing usage count program has been under way for three years. The methodology developed for this program is working well: the Greenway Committee members and Town staff have a greater understanding of the usage of each segment and facility type. Having the checkers walk each segment has increased the amount of monitoring of the system, allowing maintenance issues to be identified and addressed more promptly by the Town Public Works and Utilities Department. Moreover, checkers report graffiti to the Town Police Department.
These results should provide a good guide to comparable suburban cities in similar climates, regarding the potential usage of their greenways on weekends. For a shorter neighborhood facility, a usage level between four and 15 users per hour is a likely range. For longer facilities that draw users from a larger area, a usage level of 30 to 45 users per hour is a good assumption. For both types of facilities, locating a facility along or around a lake could be expected to increase use. Providing parking and other trailhead amenities would also increase usage,
as would connections to adjacent single- and multi-family developments.
Towns and cities should consider multiple reasons for conducting a greenway usage study. Implementing a counting program will provide staff with needed information to defend spending for an existing greenway program or aid in applications for grant funding. The usage counts can provide ready answers when elected officials and city managers need to know the benefits of greenways. Moreover, usage counts can inform engineering staff about the types of crossings needed, and whether usage is sufficient to justify installing a grade-separated crossing. As municipalities look to expand their greenway networks and integrate with adjacent systems, these counts will allow for the prioritization of new greenways, trails, and multi-use paths.
Endnotes
1 Additional information can be found at the Town of
Cary’s website for greenways: www.townofcary.org/ Departments/Parks__Recreation___Cultural_Resources/ Parks_and_Greenways/Greenways.htm
2 The map is posted online at: www.townofcary.org/
Departments/Planning_Department/Projects___Plans/ Bicycle_Plan/Map.htm
3 For readers interested in the math behind the
identification of the confidence interval for small sample sizes, see www.wadsworthmedia.com/marketing/ sample_chapters/053438465X_ch05.pdf and www.math. unb.ca/~knight/utility/MedInt95.htm
4 For more information on this multi-state facility, see
www.greenway.org/ Figure 6: Usage by Temperature (°F).