ORIGINAL ARTICLE
Effect of Utility Deregulation and Mergers on Consumer Welfare
Ralph Sonenshine
American University, Department of Economics, 4400 Massachusetts Avenue, NW, Washington, DC 20016.
Abstract: In the late 1990s, many U.S. states deregulated electric utilities, allowing for competition among power generators. Deregulated states then adopted retail choice programs, allowing customers to choose their power provider. In addition, a significant merger wave among large utilities ensued. How did these events impact consumer welfare? This study examines the effects of utility deregulation and mergers, by analyzing electricity price and output changes among deregulated and regulated states. I find that deregulation may have had a positive effect when states adopted certain measures, such as retail choice or fuel changes, that enhanced competition and lowered costs. Mergers also affected consumer welfare, with differential impacts found between the merger of generation firms versus the merger of generation and transmission companies.
Keywords: Deregulation; Mergers; Regulated Industries; natural monopoly
1. Introduction
As of the writing of this paper, deregulation of electric utilities in the U.S. has been in place in many states for 15 to 17 years. Electricity deregulation, referring to both the unbundling of electricity generation from distribution and the retail choice of generation suppliers, was instituted to create efficiencies through competitive power production and, therefore, lower retail (residential, industrial, and commercial) electricity prices. Studies to-date, however, have not shown deregulation to have a definitive impact on the growth in electricity prices.
Utility deregulation was initiated in the early 1990s via the 1992 Energy Policy Act (EPACT). EPACT 1992 created a new category of corporations, exempt wholesale generators (EWGs), which were allowed to own generators and sell electricity at wholesale anywhere in the world[1]. The effect was to reduce vertical integration within the
electricity supply chain, with the goal being to free up the generation stage for competition, therefore, lowering prices; in addition, regulators were hoping that prices would become more uniform between states. The deregulation of utilities was part of a trend to deregulate industries, which were previously perceived to be natural monopolies. A decade earlier, the U.S. deregulated the telecommunications industry with great success, resulting in a precipitous drop in the price of long distance phone calls to their marginal cost or just above zero by the end of the 1990s. More closely related, the U.S. natural gas industry was deregulated in the 1980s and 1990s, which resulted, in part, in lower natural gas prices nationwide. Many policy makers and economists, therefore, expected that deregulating electric utilities would have a similar effect of lowering prices.
Copyright © 2017 Ralph Sonenshine doi: 10.18686/fm.v2i2.967
This is an open-access article distributed under the terms of the Creative Commons Attribution Unported License
(http://creativecommons.org/licenses/by-nc/4.0/), which permits unrestricted use, distribution, and reproduction in any medium, provided the original work is properly cited.
Most of the states that deregulated, did so in the late 1990s or early 2000s. These newly deregulated states generally had higher generation costs and were concentrated in the Northeastern and the Mid-Atlantic states. The movement toward electricity deregulation appeared to have stalled after the disastrous effects of electricity shortages in California in 2000 and 2001.These shortages were attributed to market manipulation and other factors, which were made possible by deregulation.
At the time of deregulation, regional transmission organizations (RTOs) were created by the Federal Energy Regulatory Commission (FERC) to move electricity over large inter-state areas. RTOs provide non-discriminatory grid access and generally take the place of the vertically integrated utility. The RTOs essentially formed their own electricity markets.
Electricity deregulation then spurred a wave of mergers. Mergers occurred among rival power producers, as well as among utilities seeking to vertically integrate or even to diversify between gas and electricity. Acquirers believed they could benefit from scale in procurement, production, etc. In addition, a merger may enable a firm to acquire an inefficient utility and improve the management and operations of the firm, post deregulation. Mergers may then lower costs and prices. Conversely, mergers may enhance the market power of the combined utility, resulting in higher prices and lower output.
Over the past several years the pace of deregulation has diminished with generally high priced or high cost states having already deregulated and other states remaining regulated. Part of this standoff can be explained by the uncertainty regarding the net benefits of deregulation. This study seeks to understand some of the effects of electricity deregulation and mergers on consumer welfare. To do so, I examine the effects that electric utility deregulation and mergers have had on the growth in annual electricity prices and output in each of the 50 U.S. states and the District of Columbia from 2001 through 2014. I also investigate the differential impact of mergers among deregulated and regulated states on the growth in electric utility prices as well as differences between key regional transmission organizations (RTOs).
The findings from this study are that deregulation helped slow the growth in electric utility prices and output over time, particularly as customers adopted retail choice to select their power provider. This paper is unique in its use of annual adoption rates for retail choice programs in testing how deregulation has impacted the growth in prices and output. Regarding electric utility mergers, which increased significantly after deregulation, I find that mergers have a small, negative effect (higher growth) on prices and output in deregulated states.
The layout of the paper is as follows. Section II discusses the relevant literature. Section III discusses my data and empirical strategy. Section IV presents the regression results, and Section V provides some concluding remarks.
2. Literature Review
2.1 Considerations regarding deregulation
Arguments for utility deregulation focus on improved technological efficiency, productivity enhancement, eliminating regulatory capture, promoting innovation, and introducing competition to lower industry prices. It has been argued that when an industry is deregulated, unrestricted competition and entry help promote innovation and force firms to shed costs[2]. Also, industry regulation may promote inefficient capital allocation, particularly when a regulator
determines a firm’s profit as a percent of its capital investment[3]. Winston[2]further contends that regulation hampers
firms from efficiently reacting to industry shocks, as regulated firms have to gain regulatory approval to change their rates, losing valuable time to properly respond to an industry event. Finally, deregulation advocates argue that regulatory commissions are often captured by industry, so it is best to introduce competition, particularly in the
generation of electricity[4].
Electric utilities have been regulated since the early 1900s in the US and many other countries under the natural monopoly theory, stipulating that in certain market segments characterized by high fixed costs and declining average unit cost over the relevant demand, it is cheaper for a regulated firm to produce the commodity than two or more firms. Critics of the natural monopoly argument date back to the 1960s and 1970s. Harold Demsetz[5]for example, argued that
a better way to regulate is to auction off a franchise contract among competing operators to manage the natural monopoly. Through this mechanism, the government would create competition in the field[6].
Stigler[7] added that regulation by commission could be considered a market itself, which is subject to supply and
demand, with demand being the utilities and supply being the regulators. Stigler and Friedland[8]studied U.S.electric
utilities and found no difference between regulated and unregulated utilities over a long period of time. They concluded that utility price regulation is ineffective in controlling electricity rates, because regulated utilities are still subject to competition from other energy sources, such as oil, natural gas and coal, for power generation.
Jarrell[9] examined the history of U.S. electric utility regulation, to explore why some states created regulatory
commissions prior to others. Jarrell empirically tested the effect of regulation by comparing prices, profits, and output among the states that adopted state regulation during the early wave, between 1912 and 1917, and those that adopted state regulation after 1917. He found that prices and profits in the early-adopting states were 45 and 30 percent lower respectively than they were in the later adopting states, while output per capita was 25 percent higher. His evidence contradicts the proposition of the public interest theory that regulation should have been established first in states where electric utilities were most successful in exploiting their monopoly power[6].
More recently, technological advances in electricity power generation and distribution have called into question the natural monopoly argument of Becker-Bease et al.[4]. Technological improvements include changes in the size and
efficiency of gas turbines, thus allowing far smaller turbines to be used to generate power. As a result, economies of scale may not be as prevalent in power production as previously considered. Empirical studies differ regarding the significance of economies of scale among U.S. electricity utilities, pre-deregulation. Also, there were improvements in transmission lines enabling electricity to be shipped across multiple regions, which created regional electricity markets.
Joskow[10] summarizes lessons learned from electricity deregulation and suggests a textbook method of electricity
restructuring and deregulation worldwide. These methods include 1) privatizing state-owned utilities, 2) vertically separating generation from transmission/distribution, and 3) creating a competitive wholesale market with a spot market.
Prior to 1992, U.S. electric utilities were all regulated from generation to distribution at the state level. Still, the U.S. electricity market consisted of a large number of independent power producers, often with many coexisting per state. This market structure differed from the single firm monopoly structure in most other countries, and was thus well suited for competitive, wholesale markets[13].
Then, in the late 1990s, California, Massachusetts, and Pennsylvania adopted utility deregulation, whereby power production and transmission/distribution were separated. However, rates were capped for a number of years after deregulation, at which point residential, commercial, and industrial customers were allowed to switch their power generation supplier. Pilot experiments were set up in certain states with the goal of enabling consumers to obtain lower electricity prices from independent start-up companies, many who presumably use the latest technologies and have lower cost structures than older incumbent utilities. The incumbent utilities often have large sunk costs of plant and equipment already installed and may have contractual commitments to buy independently generated power at very high rates. Deregulation programs were then implemented in many states.
differences can be attributed to different natural resource endowments across regions as well as poor investments and contract decisions made in the 1970s and 1980s in certain states[14]. Starting in the late 1990s and early 2000s,
deregulation occurred in the higher cost states, particularly in the Northeast and Mid-Atlantic. In addition, state to state differences can be attributed to the stringency of retail rate regulation and increasingly to renewable portfolio standards.
2.2 Utility Deregulation Studies
A number of studies were published in the early to mid-2000s examining the effect of electric utility deregulation. These included studies by Cambridge Research Associates (CRA)[15], Joskow[16], Taber, Chapman and Mount[17], Fagan [18], and Law and Consulting Group[19]. These studies provided little evidence of gains in efficiency or benefits due to
deregulation in the United States[20]. The methodological approaches of these studies differed, but can generally be
classified, according to Kwoka[21] in four ways. First, studies compared electricity prices in regulated versus
non-regulated states. Second, the authors compared intensity of regulation. Third, studies predicted the effect of deregulation in a laboratory experiment, and fourth, the authors developed a model to estimate demand, costs, etc. to predict the effects of deregulation. The method used in this paper follows the first approach.
Kwoka[21] points to several problems with these studies, most significant of which are the complexities of
deregulation. Electricity deregulation, Kwoka[21]asserts, was often a phased approach, versus an event in a single year.
In addition, pre-and post-reform prices were not consistent, due to initial rate freezes, as well as divestment of generation assets. Also, deregulation allowed for recovery of stranded assets over time, which were fixed investments that the utility was not likely to recover in a competitive market. These effects then would dissipate over time. Finally, Kwoka[21]argues that there was excessive expansion of generation capacity around 2004, which depressed prices for a
period thereafter, and thus masked the effect of deregulation.
Kwoka[21] also contends that there are often measurement problems in deregulation studies. He suggests that
empirical studies should use fixed effects by state and employ a difference-in-difference method when appropriate to examine price differences before and after deregulation. This study employs fixed effects by state to incorporate idiosyncratic differences of states and regions. In addition, this study uses a dynamic panel model to incorporate prior year electricity prices into the model.
Few studies examined the effect of electricity deregulation by state. White[22]provided state-by-state evidence on the
distribution of potential gains to consumers (and losses to utilities) from predicted deregulatory reforms. He affirmed that new power production facilities can be developed by entrants at average costs well below those of many incumbent utilities. Entrants should thus translate into lower electricity prices.
2.3 Mergers and responses to industry deregulation
Firms have often responded to deregulation by merging with rivals. This trend was observed in the deregulation of railroads, airlines, and banks, with mixed results found on social welfare. Winston[2]elaborates that end-to-end mergers
have helped railroads become more efficient, but parallel mergers may have reduced competition between railroads, while producing few efficiency gains. Similarly, some airline mergers have been found to enhance social welfare, while others have not[2].
Kole and Lehn[23]add that deregulation destabilizes the business environment. It simultaneously increases the role of
managers and makes their performance less observable. They argue that deregulation adds to monitoring costs, increasing incentives to concentrate ownership structures. In addition, executive compensation is likely to grow, providing more incentives for M&A activity[23].
deregulation, as in 1999 (the first year many states deregulated), electric utility share prices declined sharply. It is, therefore, reasonable for utilities to merge as a defensive move to retain their market power.
Most of the merger studies relating to utilities were event studies that assessed the relative gains between shareholders. Ray and Thompson[24] , Leggio and Lien[25] and Berry[26] all studied utility mergers and found relative
gains to target shareholders using event studies. Scherer and Ross[27] , in contrast, in an earlier study found utility
mergers to generally result in poor performance.
Kwoka[28] pointed to a merger wave in the late 1990s and early 2000s in response to deregulation. In his study of
these mergers, Kwoka[28]did not find mergers to improve cost performance. In contrast, Hattori et al.[29]in their study of
mergers among UK distribution companies, found mergers to improve productivity. More recently, Becker-Bease’s[4]
event study of utility mergers, as a response to deregulation, generally found mergers to have a negative or insignificant effect on shareholder value.
3. Data and Empirical Methodology
3.1 Sample and summary analysis
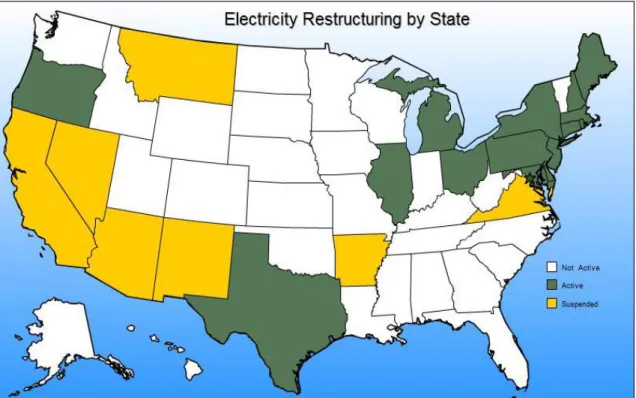
This paper examines the effect that electric utility deregulation and mergers have on the growth in electricity prices and output in the United States over a 14-year period from 2001 to 2014. As of the end of 2014, there were 17 states, plus the District of Columbia where electricity generation was deregulated in some manner, meaning that customers have a choice of generation suppliers and generation was separate from distribution. Among the regulated states, seven states (California, Arizona, Virginia, Arkansas, Montana, New Mexico, and Nevada) deregulated and then re-regulated because of poor experience with deregulation. All of these states, except for California and Montana, were identified as regulated. California and Montana were identified as de-regulated for years when a retail choice program existed. Figure 1 shows each of the U.S. states, illustrating whether electricity is regulated or has been deregulated.
Figure 1: Electricity Restructuring by State
To analyze the effect of deregulation and mergers on consumer welfare, I utilize data from the US Energy Information Agency (EIA) on total1 annual electric utility prices and output by state. Also, I used EIA data for the total, annual number of electric utility customers. We see from the map that most of the states that deregulated are in the higher cost, Northeastern states. While these states deregulated around the year 2000, many of the states did not lift rate caps till many years later. In this study we identify the deregulated states, then use the years when the rates were uncapped to assess the effect of regulation on electricity pricing and output by state to assess demand usage.
In addition, I gathered the annual percentage of industrial, commercial, and residential customers in each state that elected to use the retail public choice option, to assess how competition in the market affected electricity prices and output. This information is critical in assessing how the adoption of retail choice affects electricity prices and output.
Figure 2 shows average annual utility prices for all sectors and differences in electricity prices between regulated and non-regulated states.
Figure 2: Annual Growth in Electricity Prices – Regulated vs. Deregulated States
From the graph we see that deregulated states have higher electricity prices in all years under review. However, it appears that since roughly 2008 or 2009, which is the time when many deregulated states uncapped electricity prices, that average electricity prices were converging between regulated and deregulated states, though this convergence may have stopped in 2013/2014. This finding contrasts greatly with an earlier EIA finding in 2007 showing the difference in electricity prices between regulated and deregulated states to be actually diverging.
To assess differences in electricity prices, the composition of fuel used to generate electricity was incorporated by state. Figure 3 shows the U.S. generation of electricity by fuel source by year.
Figure 3:U.S. Electricity Generation by Fuel Source
From Figure 3 we see that coal declined from 51 percent in 2001 to 39 percent in 2014, with natural gas and renewables, primarily wind, increasing during this time period.
Prices through the time period under investigation varied significantly among RTOs. Currently, 31 of the states and the District of Columbia are part of an RTO, with the other 20 states being classified as independent. See Figure 4 for the average electricity utility price by RTO.
Figure 4: Annual Electricity Prices by RTO
Here again we see electricity prices are the highest in two of the three RTOs (New England and New York) where states are largely deregulated. From the figure it also appears that the average utility price declined after 2008 in Texas and New England.
To assess the effect of utility mergers on electricity prices and output, a list of 37 mergers were identified where the target company was an electric utility and over 50% of the target was sold. Company names, locations, and transaction values were identified using Thomson’s SDC database, as well as the EIA database. The average transaction value of these mergers was $4,249 million, as shown in Table 1.
Table 1: Summary Statistics for Mergers
Merger Variable Number Mean
(in millions) DeviationStandard Min Max
Transaction value 37 4,249 4,838 56.5 25,818
Generation merger transaction value 24 4,725 5,308 74.7 25,818
Transmission merger transaction value 8 2.849 3,608 75.7 11,826
Diversifying merger transaction value 5 4,295 4,237 270 5,600
Mergers in deregulated states 30 0.81 - -
-There is a wide range in transactions values, with a low of $59 million and a high of $25.8 billion. Of the 37 mergers, 65% (24 mergers) were horizontal mergers of generation companies, 23% (8 mergers) were horizontal mergers of transmission companies, and 13% (5 mergers) were diversifying mergers, or mergers occurring between a transmission and a generation company. The average transaction size of transmission mergers ($2.85 billion) is considerably less than the average transaction size of generation and diversifying mergers ($4.7 respectively and $4.3 billion respectively). My hypothesis, based on general industrial organization theory, is that mergers, particularly larger combinations, will limit competition, which will increase the growth trajectory in prices but lower the output path relative to the pre-merger course. Alternatively, mergers might improve the operations of the target firm, resulting in cost improvement, which are passed along to customers in the form of lower prices, or growth in prices.
To assess the effect of deregulation, mergers, and other factors on the growth in utility prices and output, I used a two-step, dynamic panel, fixed effect model utilizing the Arellano-Bover/Blundell Bond General Method of Moments
(GMM) for panel data. This estimator is often used in studies under the assumption that current year dependent variable is a function of last year’s dependent variable. In this case when using a lagged dependent variable as a covariate, OLS is not an appropriate estimation technique because the unobserved panel-level effects are correlated with the lagged dependent variables making standard estimators inconsistent. This model certainly seems appropriate given that regulated utility prices have historically been set based in part on prior year rates. The two-step model is used to control for endogeneity.
A reduced form regression equation was developed to assess the factors that influence electricity pricing (equation 1) and output (equation 2) as follows:
(1)lnPricesi,t=β1+β2Pricesi,t-1+β3Customersi,t+β4Deregulatedi,t+β5Uncappedi,t+β6%*CustType*i,t+β7Mergei,t+β8Fuel
Sourcei,t+
(2)lnOutputi,t=β1+β2Outputi,t-1+β3Customersi,t+β4Deregulatedi,t+β5Uncappedi,t+β6%*CustType*i,t+β7Mergei,t+β8Fuel
Sourcei,t+
In these equations i refers to the states and t refers to the years. Lagged prices (Pricesi,t-1) and output (Outputi,t-1) refer
to the prior year prices and output, logged, with i referring to the year. Price refers to the annual electricity price averaged between residential, industrial, and commercial customers by state. Similarly, output refers to the average kilowatts hours of electricity produced by state, averaged between residential, industrial, and commercial customers. Customers (logged) refers to the number of electricity customers in each state.
Deregulated refers to the years where states deregulated electricity at the wholesale and retail levels. A dummy variable (1 for deregulate) was used to indicate the years in which the state was deregulated. Most of the 17 states and Washington DC deregulated by 2001. Uncapped refers to the years when electricity rates were uncapped in the deregulated states. In many of the 17 deregulated states, electricity rates were uncapped many years after the states deregulated to give the utilities time to adjust and recover stranded costs.
Customer type* refers to the percentage of industrial, commercial, and residential customers by year who use the retail choice option to choose the utility generation provider in a deregulated state. The asterisk (*) refers to interacting these retail choice percentages with the uncapped variable as the retail choice would only have an effect when the rates are uncapped. All of the deregulated states in the data base implemented a retail choice program throughout the period (2001-2014) of the study, except for California who suspended their program in 2001 and then resumed the program in 2010. Information on the retail choice program percentages was provided by EIA as well as in annual ABACCUS reports. This percentage was also interacted with rates uncapped. By including this interaction term with the deregulation term, we can separate out the retail choice part of deregulation from other aspects (e.g. unbundling generation from distribution
As shown in the summary statistics in Table 2, few residential customers (9.5%) use the retail choice option, but a larger percent of commercial (33%) and industrial customers (43%) in the deregulated states used the retail choice option.
Table 2: Summary Statistics for Retail Choice Option
Variable Mean Standard
Deviation Min Max
Percent Residential customers- deregulated states .095 .16 0 .6
Percent commercial customers – deregulated states .332 .27 0 .85
Percent industrial customers – deregulated states .432 .32 0 1
Percent of years with a merger- deregulated states .49 .4 0 1
Figure 5 shows the annual change in the retail choice option by customer type. Here we see that there was little change in the percent of residential customers with the retail choice option till 2011, when the percent increased significantly from roughly 6% to 22%.
Figure 5: Percent of Customers that Adopted Retail Choice in Deregulated States
The percent of commercial and industrial customers on the retail choice option were higher than the percent of residential customers. The percent of each of the segments on the retail option grew significantly after 2009/2010.
The vector Mergei,tincludes variables related to mergers. These include merger presence, with a 1 indicating whether
a large merger (>$500 million) occurred in the state where the target is located. A one (1) is placed in the year of the merger announcement and all subsequent years. From this variable I am testing the effect of electric utility consolidation on the growth in prices and output. We see from Table 2 that 49% of the years in deregulated states underwent consolidation via a merger, while only 10% of the years in regulated states had consolidation of supply from a merger.
In addition, I include transaction value to weight the size of the merger in the year the merger was announced. In cases where more than one merger occurred in a state, as in New York, with five mergers and Pennsylvania with three mergers, the transaction values were added together in the year of the merger. Merger value was also interacted with Firm Type (generation versus transmission utility) to assess the differential impact between the merger value of generation companies versus transmission companies on the growth in utility prices and output.
Finally, fuel source refers to the percentage of electricity generated in each state by fuel source. The fuel sources included are coal, nuclear, hydro/geothermal, natural gas, wind, and other.
My hypothesis is that deregulation will spur competition among power generators, which will lower prices or at least reduce the rate of growth in prices, either at the inception of deregulation or after rates are uncapped. In contrast, I expect mergers to provide utilities with market power and therefore, have a positive impact on the growth in electricity prices and a negative effect in the growth in output.
4. Results
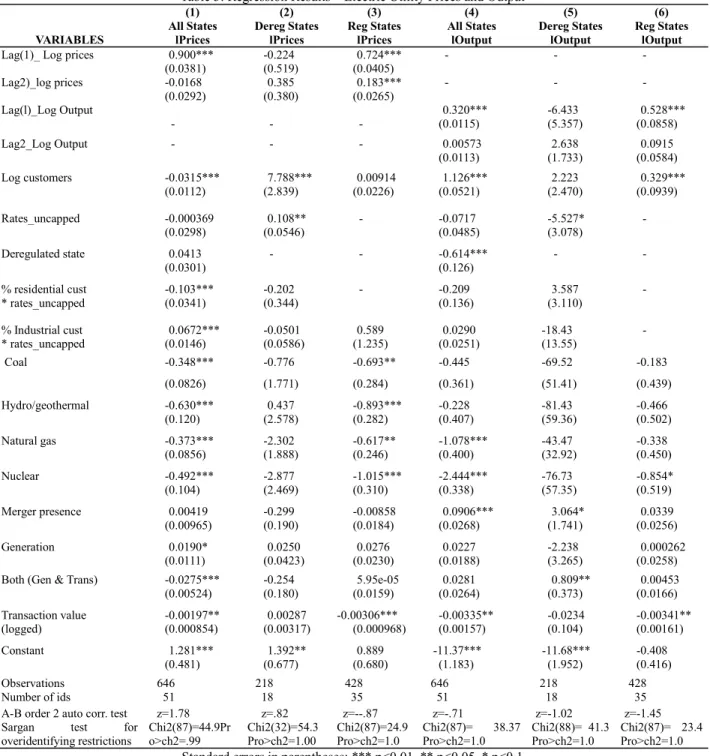
Table 3 shows the results from the electric utility price and output regressions. The first three columns provide findings relating to the log of electricity prices with column 1 showing the total results and columns 2 and 3 providing the results
for the restricted sample of 18 deregulated states (includes California for some years and the District of Columbia) and 34 regulated states. Columns 4 through 6 then provide the same results for the log of electricity output with columns 5 and 6 restricting the sample to deregulated and regulated states. In each regression, we ran the test for serial correlation of the error term as well as the Sargan test for over-identifying restrictions. In each regression, we were able to accept the null hypothesis of no serial correlation in the error terms at the 5 percent level in the first regression and 10 percent in all other regressions. In addition, the results of the Sargan test enabled us to accept the chi-squared test being that the p value is each regression was greater than the critical value.
Table 3: Regression Results – Electric Utility Prices and Output
(1) (2) (3) (4) (5) (6)
All States Dereg States Reg States All States Dereg States Reg States
VARIABLES lPrices lPrices lPrices lOutput lOutput lOutput
Lag(1)_ Log prices 0.900*** -0.224 0.724*** - -
-(0.0381) (0.519) (0.0405)
Lag2)_log prices -0.0168 0.385 0.183*** - -
-(0.0292) (0.380) (0.0265)
Lag(l)_Log Output 0.320*** -6.433 0.528***
- - - (0.0115) (5.357) (0.0858)
Lag2_Log Output - - - 0.00573 2.638 0.0915
(0.0113) (1.733) (0.0584)
Log customers -0.0315*** 7.788*** 0.00914 1.126*** 2.223 0.329***
(0.0112) (2.839) (0.0226) (0.0521) (2.470) (0.0939)
Rates_uncapped -0.000369 0.108** - -0.0717 -5.527*
-(0.0298) (0.0546) (0.0485) (3.078)
Deregulated state 0.0413 - - -0.614*** -
-(0.0301) (0.126)
% residential cust -0.103*** -0.202 - -0.209 3.587
-* rates_uncapped (0.0341) (0.344) (0.136) (3.110)
% Industrial cust 0.0672*** -0.0501 0.589 0.0290 -18.43
-* rates_uncapped (0.0146) (0.0586) (1.235) (0.0251) (13.55)
Coal -0.348*** -0.776 -0.693** -0.445 -69.52 -0.183
(0.0826) (1.771) (0.284) (0.361) (51.41) (0.439)
Hydro/geothermal -0.630*** 0.437 -0.893*** -0.228 -81.43 -0.466
(0.120) (2.578) (0.282) (0.407) (59.36) (0.502)
Natural gas -0.373*** -2.302 -0.617** -1.078*** -43.47 -0.338
(0.0856) (1.888) (0.246) (0.400) (32.92) (0.450)
Nuclear -0.492*** -2.877 -1.015*** -2.444*** -76.73 -0.854*
(0.104) (2.469) (0.310) (0.338) (57.35) (0.519)
Merger presence 0.00419 -0.299 -0.00858 0.0906*** 3.064* 0.0339
(0.00965) (0.190) (0.0184) (0.0268) (1.741) (0.0256)
Generation 0.0190* 0.0250 0.0276 0.0227 -2.238 0.000262
(0.0111) (0.0423) (0.0230) (0.0188) (3.265) (0.0258)
Both (Gen & Trans) -0.0275*** -0.254 5.95e-05 0.0281 0.809** 0.00453
(0.00524) (0.180) (0.0159) (0.0264) (0.373) (0.0166)
Transaction value -0.00197** 0.00287 -0.00306*** -0.00335** -0.0234 -0.00341**
(logged) (0.000854) (0.00317) (0.000968) (0.00157) (0.104) (0.00161)
Constant 1.281*** 1.392** 0.889 -11.37*** -11.68*** -0.408
(0.481) (0.677) (0.680) (1.183) (1.952) (0.416)
Observations 646 218 428 646 218 428
Number of ids 51 18 35 51 18 35
A-B order 2 auto corr. test Sargan test for overidentifying restrictions z=1.78 Chi2(87)=44.9Pr o>ch2=.99 z=.82 Chi2(32)=54.3 Pro>ch2=1.00 z=--.87 Chi2(87)=24.9 Pro>ch2=1.0 z=-.71 Chi2(87)= 38.37 Pro>ch2=1.0 z=-1.02 Chi2(88)= 41.3 Pro>ch2=1.0 z=-1.45 Chi2(87)= 23.4 Pro>ch2=1.0
Standard errors in parentheses: *** p<0.01, ** p<0.05, * p<0.1
in the full sample as well as the regulated states sample with coefficients of .90 and .72 percent for the first year of lagged prices. In contrast, the coefficient for the first-year lagged prices was smaller and insignificant in the deregulated sates. Similar results, as shown in columns 4 and 6, were found with lag of output. These findings suggest that deregulated states may adjust prices and output to a greater degree due to economic or competitive forces rather than relying on a markup of prior year prices.
Also, we see that the coefficient for the log of customers is significant when regressed against the log of prices for the full sample and the deregulated sample. This result again would suggest that utilities are responding to market or economic conditions in deregulated states with price being impacted by the number of customers as would be expected when estimating demand. In contrast, log of output is a positive function of the number of customers in the full sample regression (column 4) and the regulated sample (column 6), but not in the deregulated sample. This result might again suggest that utilities may again have more flexibility in setting output in deregulated than in regulated states.
In addition, we see from Table 3 that fuel source appears to be a key driver of price and output. We find negative significant, coefficients for the hydro/geothermal, natural gas, and nuclear fuel percentage in the full sample – column 1, as well as the regulated sample – column 3. These results suggest that a 1 percent increase in the percent of output based on hydro/geothermal, natural gas, and nuclear relative to other fuel sources will result in a 0.63, 0.37, and 0.49 percent decline in electricity prices in the full sample. The coefficient for the percentage of usage for these fuel sources (hydro/geothermal, nuclear, and natural gas) and coal were also found to be significant and negative in the regulated sample – column3. In contrast, the coefficients for these fuel sources were insignificant in the de-regulated states regression, when regressed against the log of prices. These findings suggest that the composition of fuel sources may have a greater impact on the growth in prices in regulated than deregulated states, as deregulated states may have been able to restructure their costs to mitigate the effect of the change in fuel source. Regarding output, we find that the percent nuclear and natural gas has a negative impact on output in the overall sample (column 4), but the effect is not found in the regulated or deregulated sample.
Next, we turn to the effect of retail choice and uncapping of prices. Here, we find that the coefficient for the percent of residential customers on the retail choice program is negative and significant in the overall sample, but not in the deregulated states sample. This finding provides some evidence that while deregulation itself may not impact the growth in electricity prices, since the coefficient for deregulation was insignificant, implementing the retail choice program may be effective in lowering the growth in electricity prices by promoting competition among power producers. In contrast, we find that the coefficient for rates uncapped was positive and significant in the deregulated sample. This finding would suggest that, in contrast, to our hypothesis, utilities might raise prices when rates are uncapped. Also, we find the coefficient for the percent of industrial customers on the retail choice option to be positive and significant in the full sample, but not in the deregulated sample. This result, however, is less meaningful given the size disparities between industrial customers. In contrast, residential customers are relatively similar in their electricity usage, which gives more credence to the finding for the percent residential customers, though the coefficient was not significant in the deregulated sample.
Overall, we do not find the coefficients for deregulate to be significant when regressed against log of prices. We, however, do see a negative significant coefficient for deregulation when regressed against the growth in electricity output, as shown in column 4. This finding indicates that the growth in electricity output appeared to have slowed in deregulated states. There are, of course, many possible explanations, besides deregulation, of lower output in these states, to include the movement of large industrial customers away from these states. In addition, we find the coefficient for rates uncapped to be negative, large, and weakly significant when regressed against log of output for the deregulated sample. This finding provides limited evidence that uncapping rates may move customers up the demand curve toward
higher prices and lower output.
Next, we turn to the impact of mergers on the growth in utility pricing and output. Here, we do not find the coefficient for merger presence to be significant when regressed against log of prices. However, the coefficients for the mergers of generation and transmission companies (both) as well as the coefficient for the log of transaction value were negative and significant when regressed against log of prices. This finding suggests that mergers among generation and transmission companies may have a positive effect on consumer welfare as these mergers may reduce the growth in prices. In contrast, we find the coefficient for the merger of generation companies to be positive and significant suggesting these horizontal mergers result in higher prices. When segmenting the sample (columns 2 and 3), we see that the effect of transaction value on the growth in prices is driven by mergers in regulated states. This finding suggests that larger transactions have a significant, negative effect on the growth in prices in regulated states, perhaps due to economies of scope, but this effect is not found in deregulated states, where the impact on prices is found in other variables.
Regarding output, we find that the presence of mergers has a positive effect on output, and this result is driven by the deregulated states sample, where most of the mergers occurred. As such, in deregulated states an increase in mergers increased the growth in output, perhaps due to increased competition.
In summary, it seems that deregulation may have a positive effect when states adopted certain measures that introduce competition and lower costs. These measures include allowing residential customers to choose their generation supplier through a retail choice option and employing lower cost fuels for power generation. The results relating to utility mergers suggest that vertical mergers and larger mergers may have a positive effect on consumer welfare by lowering the growth in prices. In contrast, the merger of generation companies may have a negative effect on consumer welfare by increasing the growth in utility prices.
5. Conclusions
This study examines the effect of electric utility deregulation and mergers on consumer welfare. To do so, I examine how deregulation and mergers impact the growth in electric utility prices and output from 2001 to 2014. I find that throughout this period electric utility prices grew faster in deregulated states than regulated states. However, the percent of residential customers choosing the retail choice option had a negative effect on the growth in electric utility pricing, suggesting that competition for power generation suppliers may be lowering the growth in electricity pricing. This finding would suggest that policy makers may want to be more aggressive in promoting retail choice options in deregulated states. I also find that changing fuel composition impacted electric utility prices and output to a greater degree in deregulated versus regulated states, which may suggest that utilities in deregulated states may have more flexibility in altering their cost structure.
I also investigated the impact of mergers on utility pricing and output. Here, the results suggest that larger mergers and vertical mergers may have a positive effect on limiting the growth in prices, while the merger of generation companies has the opposite effect of increasing the growth in utility prices.
In summary, there was some evidence that deregulation may have had a positive impact on social welfare by creating competition via the retail choice program and possibly improving efficiency through changes in fuel composition. Mergers also affected consumer welfare, though the impact varied by the type of merger. While this study has examined the effect of deregulation and mergers on consumer welfare, it is left to other studies to assess other aspects of deregulation.
References
1. Hempling, S. 1995. Electric utility holding companies: the new regulatory challenges. Land Economics, 71(3): 343-353. 2. Winston, Clifford, 1998. US Industry adjustment to economic deregulation, The Journal of Economic Perspectives, Vol. 12, No.
3, pp. 89-110.
3. Averch and L. Johnson, 1962. The behavior of the firm under regulatory constraint, American Economic Review, 52: 1052-1069.
4. Becker-Bease, J., Goldberg, L., Kaen, F., 2008. Mergers and acquisitions as a response to the deregulation of electric power industry: value creation of value destruction? Journal of Regulatory Economics, 33:21-53.
5. Demsetz, Harold, 1968. Why Regulate Utilities? The Journal of Law & Economics, 11:1 55-65.
6. Priest, George, 1993. The origins of utility regulation and the "theories of regulation" debate: The Journal of Law & Economics, 36:1:2, 289-323.
7. Stigler, George J. (1975). (In collaboration with Claire Friedland) "What can regulators regulate? the case of electricity". The Citizen and the State: Essays on Regulation, 61- 77. Chicago: University of Chicago Press.
8. Stigler, George, 1971. The theory of economic regulation, 2 Bell Journal of Economics and Management Science, 2:1, 3-21. 9. Jarrell, G.A. 1978. The demand for state regulation of the electric utility industry. Journal of Law and Economics, 21:2,
269-295.
10. Joskow, P. 2008. Lessons learned from electricity market liberalization, Energy Journal, 29:9–42.
11. Cowing, T. G. and Smith, V. K. 1978. The estimation of a production technology: a survey of econometric analyses of steam-electric generation. Land Economics, 54 (2): 156-186.
12. Kaserman, D. and Mayo, J. 1991. The measurement of vertical economies and the efficient structure of the electric utility industry. Journal of Industrial Economics, 39:5 483-502.
13. Peltzman, S., Winston, C., 2000. Deregulation and regulatory reform in the U.S. electricity industry industries: what's next? AEI - Brookings Joint Center for Regulatory Studies., in deregulation of network.
14. Borenstein, S., Bushnell, J. 2000. Utility restructuring: deregulation or reregulation, Regulation 23 (2), 46-52.
15. Cambridge Energy Research Associates. 2005. Beyond the crossroads: the future direction of power industry restructuring. 16. Joskow, P., 2006. Markets for power in the United States: an interim assessment, The Energy Journal, 2: 1–36.
17. Taber, J., Chapman, D., Mount, T., 2006. Examining the effects of deregulation on retail electricity prices. Department of applied economics and management, Cornell University, Working Paper 2005-14.
18. Fagan, M. 2006. Measuring and explaining electricity price changes in restructured states. Electricity Journal, 19:5, 35-42. 19. Law & Economics Consulting Group. 2006 revised June 2007. Analysis of the impact of coordinated electricity markets on
consumer electricity charge. Cambridge, MA.
20. Adams, Aster, 2008. Impact of deregulation on cost efficiency, financial performance and shareholder wealth of electric utilities in the United States, desertion found in http://etd.library.vanderbilt.edu.proxyau.wrlc.org/available/etd-09052008-143901/ unrestricted/asteradamsdissertationfinal.pdf
21. Kwoka, J., 2008. Restructuring the electric power sector: a review of recent studies, Review of Industrial Organization, 32:3-4, 165-196.
22. White, M. W. 1996. Power struggles: explaining deregulatory reforms in electricity markets. Brookings Papers on Economic Activity: Microeconomics, 201-250.
23. Kole, S. and Lehn, K. 1997. Deregulation, the evolution of corporate governance structure, and survival, American Economic Review, 87:2, 421-425.
24. Ray, J. Thompson,H.1990. Fifty in five: the prospects for merger in the electric utility industry Journal of Regulatory Economics, 2 111–128.
25. Leggio, K, Lien, D., 2000. Mergers in the electric utility industry in a deregulatory environment, Journal of Regulatory Economics, 17:2. 69–85.
26. Berry, S.K. 2000. Excess returns in electric utility mergers during transition to competition. Journal of Regulatory Economics, September 2000, 18(2): 175-88.
27. Scherer, F.M. Ross, D.1990. Industrial Market Structure and Economic Performance (Third Edition) Houghton Mifflin Company, Boston.
28. Kwoka, J., Pollit, M., 2010. Do mergers improve efficiency? Evidence from restructuring the US electric power sector, International Journal of Industrial Organization, 28 (6): 645-656.
29. Hattori, T. Jamasb, T. Pollitt, M. 2005. The electricity distribution in the UK and Japan: a comparative efficiency analysis 1985–1998. Energy Journal, 26: 2, 23–47.