BASEL III REFORMS: UPDATED
IMPACT STUDY
RESULTS BASED ON DATA
AS OF 31 DECEMBER 2019
Contents
List of figures 5 1. Executive summary 8 1.1 Introduction 8 1.2 Overall impact 10 1.3 Complementary analysis 13 2. General remarks 152.1 Background and mandate 15
2.2 Data collection process governance 16
2.3 Sample 17
2.3.1 Classification criteria 17
2.3.2 Consolidation 17
2.3.3 Cumulative sample: summary statistics 17
2.4 Methodology 20
2.4.1 Aggregation 20
2.4.2 Impact assessment scenarios 20
2.4.3 Impact metrics 23
2.4.4 Main differences with respect to other exercises 24
2.5 Data quality issues and interpretation of the results 26
2.5.1 Sample 26
2.5.2 Proxies 27
2.5.3 Conservatism in our estimates 27
2.6 Structure of the report 28
3. Main findings 29
3.1 Changes in minimum required capital (T1 MRC) 29
3.1.1 Basel III scenario 29
3.1.2 EU-specific scenario 32
3.2 Impact on capital ratios and capital shortfalls 34
3.2.1 Basel III scenario 34
3.2.2 EU-specific scenario 35
3.3 Impact during the transitional period 36
3.3.1 Basel III scenario 37
3.3.2 EU-specific scenario 38
3.3.3 Alternative EU-specific scenario 40
3.4 Alternative implementation options for output floor 41
3.4.1 Basel III scenario 42
4. Complementary analysis: COVID-19 pandemic and the impact on the Basel III reforms 45
4.1 Introduction 45
4.2 Policy and legislative response to COVID-19 outbreak 46
Time horizon of the application of extraordinary policy and legislative measures 48
4.3 Implications of the COVID-19 outbreak on the banks’ balance sheets. 49
4.4 Interactions of COVID-19 impact and the revised Basel III framework. 50
4.4.1 Credit risk SA 51
4.4.2 Credit risk IRB 52
4.4.3 Operational risk 54
4.4.4 Market risk: FRTB standardised approach 56
4.4.5 Market risk: FRTB internal model approach 56
4.4.6 Output floor 58
4.5 Sensitivity analysis on credit risk of loan portfolios 58
Annex 1: Sample coverage 64
Annex 2: Additional results 65
Cumulative analysis based on June 18 data for the consistent sample 65
Basel III scenario 65
EU-specific scenario 66
Capital shortfalls 67
Basel III scenario 67
EU-specific scenario 67
Transitional impact 67
Basel III scenario 67
EU-specific scenario 68
’Parallel stack approach‘ for the implementation of the output floor 68
Basel III scenario 69
EU-specific scenario 70
Basel III scenario including prudential treatment of software assets and P2R composition
features 71
EU-specific scenario including impact of prudential treatment of software assets and P2R
composition features (features considered in the end-point only) 71
Annex 3: Sensitivity analysis on credit risk of loan portfolios: a methodological annex 73
Data sources 73
Sample 73
General considerations 73
Stress effect considered in the sensitivity analysis 74
COVID-19 mitigation measures considered in the sensitivity analysis 75
Annex 4: Qualitative assessment of the implementation of the final adjustments to the CVA risk
framework in the EU 77
Annex 5: MREL analysis 80
Basel III scenario 82
EU -Specific scenario 83
Subordination levels under BRRD2 86
Methodology and shortfall estimates 86
Summary of the methodology 86
Background on the MREL monitoring exercise 87
List of figures
Table 1 Percentage change in T1 MRC (relative to current T1 MRC), by implementation scenario 10 Table 2 Capital ratio and shortfalls (EUR billion), by implementation scenario 11 Table 3 Cumulative analysis sample, by bank size (highest level of EU consolidation) 18
Table 4 Cumulative analysis sample, by country 18
Table 5 Cumulative analysis sample, by business model 19
Table 6 Main implementation features of Basel III and EU-specific scenario 21
Table 7 Percentage change in T1 MRC (relative to current T1 MRC), by bank size, Basel III scenario,
December 2019 data 30
Table 8 Distribution of percentage change in T1 MRC (relative to current T1 MRC), all banks,
Basel III scenario, December 2019 data 30
Figure 1 Percentage change in T1 MRC (relative to current T1 MRC), by business model, Basel III
scenario, December 2019 data 31
Figure 2 Percentage change in T1 MRC (relative to current T1 MRC), by country, Basel III scenario,
December 2019 data 31
Table 9 Percentage change in T1 MRC (relative to current T1 MRC), by bank size, EU-specific
scenario, December 2019 data 32
Table 10 Distribution of percentage change in T1 MRC (relative to current T1 MRC), all banks,
EU-specific scenario, December 2019 data 33
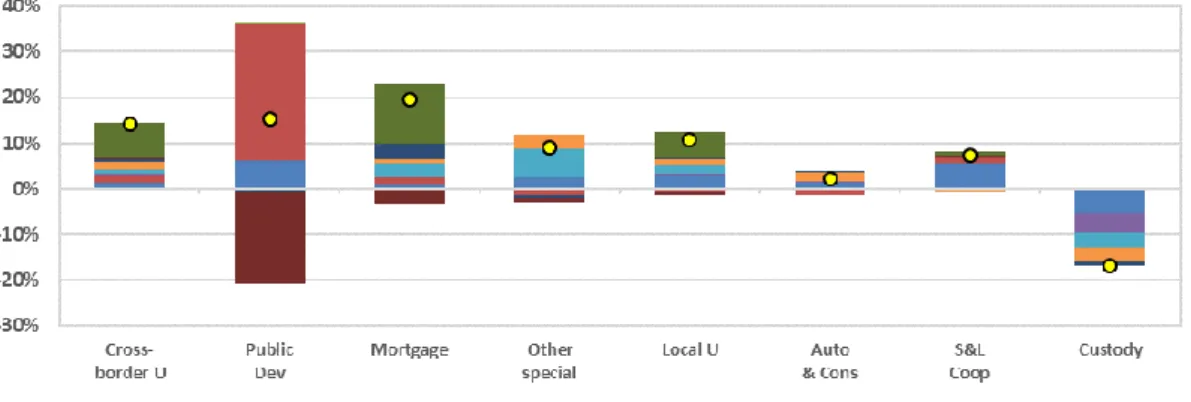
Figure 3 Percentage change in T1 MRC (relative to current T1 MRC), by business model,
EU-specific scenario, December 2019 data 33
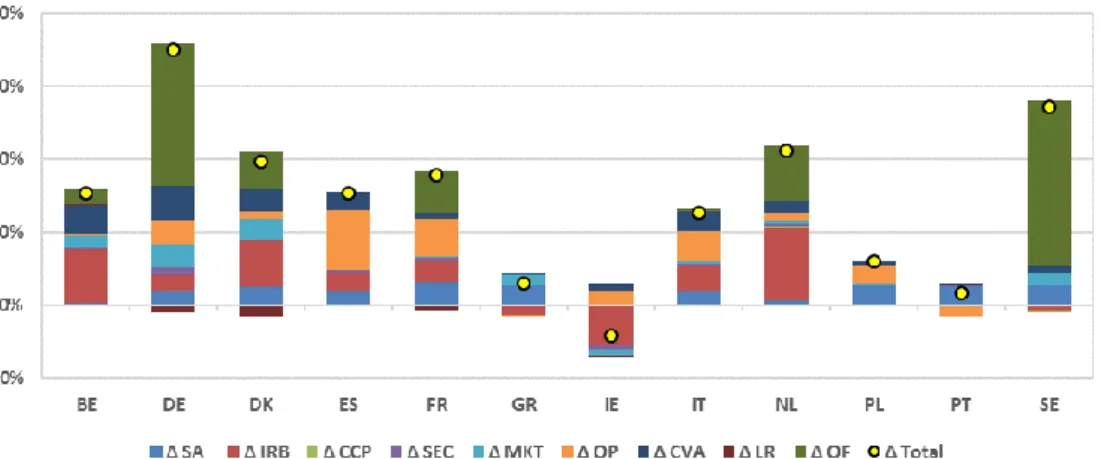
Figure 4 Percentage change in T1 MRC (relative to current T1 MRC), by country, EU-specific
scenario, December 2019 data 34
Table 11 Capital ratios and shortfalls, Basel III scenario, December 2019 data 35 Table 12 Capital ratios and shortfalls, EU-specific scenario, December 2019 data 36 Table 13 Transitional arrangements for output floor calibration and operational risk ILM 37 Figure 5 Contribution of the output floor to the total T1 MRC impact (relative to current T1 MRC)
during the transitional period, Basel III scenario, December 2019 data 38
Table 14 Capital shortfall (EUR billion) during the transitional period, Basel III scenario,
December 2019 data 38
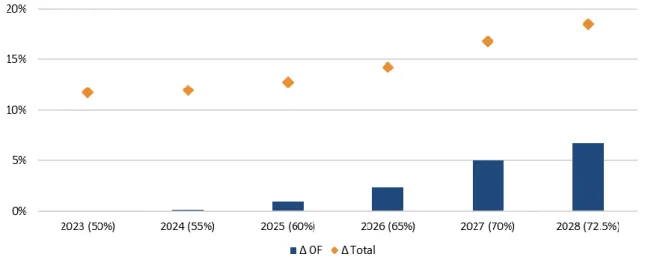
Figure 6 Contribution of the output floor risk to the total T1 MRC impact (relative to current T1 MRC) during the transitional period, EU-specific scenario, December 2019 data 39 Table 15 Capital shortfall (EUR billion) during the transitional period, EU-specific scenario,
December 2019 data 39
Figure 7 Contribution of the output floor and operational risk to the total T1 MRC impact (relative to current T1 MRC) along the transitional period, alternative EU-specific scenario, December 2019
data 40
Table 16 Capital shortfall (EUR billion) during the transitional period, alternative EU-specific
scenario, December 2019 data 41
Table 17 Percentage change in T1 MRC (relative to current T1 MRC), by bank size, Basel III
scenario, December 2019 data 42
Table 18 Number and percentage RWA of internal model institutions (highest level of EU consolidation) constrained by the different regulatory metrics, by output floor implementation
option, Basel III scenario, December 2019 data 43
Table 19 Percentage change in T1 MRC (relative to current T1 MRC), by bank size, EU-specific
Table 20 Number and percentage RWA of internal model institutions (highest level of EU consolidation) constrained by the different regulatory metrics, by the output floor
implementation option, EU-specific scenario, December 2019 data 44
Figure 8 Expected time horizon of application of extraordinary policy and legislative measures 48 Table 21 Key elements of the Basel III reform related to IRB and expected post COVID-19
impact 52
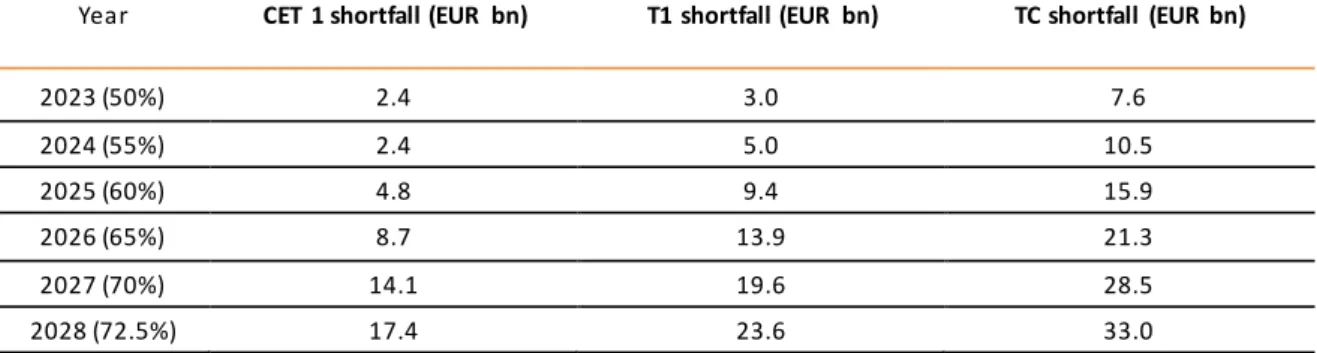
Table 22: Capital ratios and capital shortfalls (EUR billion) during the transitional period as of 1 January 2023, EU-specific scenario and EU-specific scenario with COVID-19 impact , December
2019 data 61
Table 23 QIS cumulative sample coverage in terms of banking assets, by country and total EU 64 Table 24 Percentage change in T1 MRC (relative to current T1 MRC), by bank size, Basel III
scenario, June 2018 data 65
Table 25 Capital ratios and shortfalls, Basel III scenario, June 2018 data 66
Table 26 Percentage change in T1 MRC (relative to current T1 MRC), by bank size, EU-specific
scenario, June 2018 data 66
Table 27 Capital ratios and shortfalls, EU-specific scenario, June 2018 data 66 Table 28 Number of banks incurring a shortfall in total capital and respective shortfall amount (EUR bn), by bank type and OF approach, Basel III scenario, December 2019 data 67 Table 30 Number of banks incurring a shortfall in total capital and respective shortfall amount (EUR bn), by bank type and OF approach, EU-specific scenario, December 2019 data 67 Table 32 Contribution of the output floor to the total T1 MRC impact (relative to current T1 MRC) and shortfall in total capital (EUR bn) throughout the transitional period, by OF approach, Basel III
scenario, December 2019 data 67
Table 33 Contribution of the output floor to the total T1 MRC impact (relative to current T1 MRC) and shortfall in total capital (EUR bn) throughout the transitional period, by OF approach,
EU-specific scenario, December 2019 data 68
Table 34 Percentage change in T1 MRC (relative to current T1 MRC) and shortfalls, parallel stack
approach, by bank size, Basel III scenario, December 2019 data 69
Table 35 Number of banks incurring a shortfall in total capital and respective shortfall amount (EUR bn), by bank type and parallel stack approach, Basel III scenario, December 2019 data 69 Table 37 Contribution of the output floor to the total T1 MRC impact (relative to current T1 MRC) and shortfall in total capital (EUR bn) throughout the transitional period, parallel stack approach,
Basel III scenario, December 2019 data 69
Table 38 Percentage change in T1 MRC (relative to current T1 MRC) and shortfalls, parallel stack
approach, by bank size, EU-specific scenario, December 2019 data 70
Table 39 Number of banks incurring a shortfall in total capital and respective shortfall amount (EUR bn), by bank type and OF approach, EU-specific scenario, December 2019 data 70 Table 41 Contribution of the output floor to the total T1 MRC impact (relative to current T1 MRC) and shortfall in total capital (EUR bn) throughout the transitional period, parallel stack approach,
EU-specific scenario, December 2019 data 70
Table 42 Percentage change in T1 MRC (relative to current T1 MRC), by bank size, Basel III
scenario including sofware and P2R features, December 2019 data 71
Table 43 Capital ratios and shortfalls, Basel III scenario including software and P2R features,
December 2019 data 71
Table 44 Percentage change in T1 MRC (relative to current T1 MRC), by bank size, EU-specific
scenario and impact of software and P2R features, December 2019 data 72
Table 45 Capital ratios and shortfalls, EU-specific scenario and impact of sofware and P2R
features, December 2019 data 72
Table 43 MREL shortfall attributable to revised Basel III –BRRD2 based sample under the Basel
scenario 82
Table 44 MREL shortfall attributable to revised Basel III –BRRD1 based sample under the Basel
scenario 83
Table 45 MREL shortfall attributable to revised Basel III – aggregation of BRRD2 based and BRRD1
based sample under the Basel scenario 83
Table 46 MREL shortfall attributable to revised Basel III –BRRD2 based sample under the EU
Specific scenario 84
Table 47 MREL shortfall attributable to revised Basel III –BRRD1 based sample under the EU
Specific scenario 84
Table 48 MREL shortfall attributable to the revised Basel III – aggregation of BRRD2 based and
BRRD1 based sample under the E-specific scenario 85
Table 49 MREL shortfall attributable to revised Basel III – aggregation of BRRD2 based and BRRD1
1.
Executive summary
1.1
Introduction
The final Basel III framework is a central element of the global regulatory response to the financial crisis.
In response to the global financial crisis, the Basel Committee endorsed the final elements of the Basel III framework and the final market risk framework (the fundamental review of the trading book — FRTB) in December 2017 and January 2019, respectively. The revised standards address shortcomings of the pre-crisis regulatory framework and provide a foundation for a resilient banking system that can support the real economy through the economic cycle.
In 2019, the EBA delivered its advice to the European Commission, supporting the implementation of the final Basel III standards in the EU.
The EBA delivered its advice on the final Basel III framework in two parts in August 2019 and December 2019, responding to the European Commission’s Call for Advice (CfA) of May 2018.1,2,3 The advice included a quantitative impact
assessment at the highest level of consolidation, a set of policy recommendations and a macroeconomic impact assessment, produced jointly by the EBA and the ECB.4,5 In
March 2020, the EBA complemented the quantitative impact assessment with an analysis at the individual entity (solo) level. The EBA supports the full implementation of the Basel III reforms, which in its view will enhance credibility in the EU banking sector (such as enhanced resilience of banks). This credibility benefit far outweighs in the view of the EBA the overall limited regulatory capital gains assessed in those reports from deviating from international standards.
In August 2020, the European Commission requested the EBA to update its impact
assessment, also taking into
Following the outbreak of the COVID-19 pandemic and the subsequent deferral of the Basel III implementation by one
1 European Commission (2018), ‘Call for Advice to the EBA for the purpose of revising the own fund requirement for
credit, operational, market and credit valuation adjustment risk’.
2 EBA (2019), EBA advises the European Commission on the implementation of the final Basel III framework.
3 EBA (2019), 'Basel III reforms: Impact study and key recommenda tions - Macroeconomic assessment, credit valuation
adjustment and market risk'. At the time of publication, the final targeted revisions to the CVA framework, published on July 2020, were not available. Consequently, the EBA provided only an indicative s ensitivity analysis on the potential impact of these adjustments, based on the targeted adjustments proposed in the BCBS consultation document ‘Credit Valuation Adjustment risk: targeted final revisions ’ published in November 2019
4 EBA (2019), EBA advises the European Commission on the implementation of the final Basel III framework.
5 EBA (2019), 'Basel III reforms: Impact study and key recommendations - Macroeconomic assessment, credit valuation
adjustment and market risk'. At the time of publication, the final targeted revisions to the CVA framework, published on July 2020, were not available. Consequently, the EBA provided only an indicative sensitivity analysis on the potential impact of these adjustments, based on the targeted adjustments proposed in the BCBS consultation document ‘Credit Valuation Adjustment risk: targeted final revisions’ published in November 2019
account the potential impact of COVID-19 pandemic.
year to 1 January 20236, the EU Commission postponed the
adoption of its legislative proposal to implement the final elements of the Basel III framework in the EU and requested the EBA to update its previous advice on the final Basel III reforms.7
This report presents the updated quantitative impact assessment of the final Basel III reforms and a complementary analysis of the potential impact of the COVID-19 pandemic.
This report provides an update of the EBA’s previous impact assessment of the final Basel III framework using data from regular EBA data collections as of end-December 2019. No ad-hoc data collection was carried out. Compared to the earlier Call for Advice reports, which benefitted from a specific ad hoc data collection, the results are based on a reduced sample of 99 banks8 from 17 EU countries and are
thus not directly comparable.9 Due to the limited sample,
results shown by size, country and business model could be biased, although the results can be considered valid on an aggregate level, as the sample represents around 75% of total EU banks’ assets.
The update is complemented by an analysis of the potential additional impact of the COVID-19 pandemic on top of the usual impact of the implementation of the Basel III framework. This part of the analysis is mainly qualitative in nature; however, a quantitative credit risk sensitivity analysis is included in the assessment.
The EBA conclusions in the original report remain
unchanged. The EBA continues to support the policy
recommendations published in its advice in 2019.
The policy analysis conclusions and recommendations presented in the original report remain unchanged, as the analysis has fundamentally not changed with regard to the overall benefits stemming from the introduction of the Basel III framework in the EU. On the contrary, the positive effects of the reform remain unchanged, whereas the capital impact has decreased overall. The EBA continues to support the considerations and the policy recommendations that it put forward in the advice it published in 2019.
The cumulative results of the present CfA report are not directly comparable to those of the Basel III monitoring report.
Beyond the results of the present CfA report, on 10 December 2020, the EBA has also published its regular Basel III monitoring report, based on the same data as of end-December 2019.10 The cumulative results of the present CfA
report are not directly comparable to those of the Basel III
6 BCBS (2020), Governors and Heads of Supervision announce deferral of Basel III implementation to increase operational
capacity of banks and supervisors to respond to Covid-19
7 The EC also requested an update to the macroeconomic impact assessment, to be produced jointly by the EBA and the
ECB. A separate report will be delivered on this in 2021 Q1.
8 The results presented in the December 2019 CfA report were based on a sample of 198 banks. In this report, the terms
‘banks’ and ‘institutions’ are used interchangeably.
9 Results based on the 2018 Q2 data used in the previous CfA reports for the consiste nt sample are provided in the Annex
for comparability purposes.
monitoring report, due to different samples and some key methodological differences.
Calculations are based on several assumptions, most leading to potential
overestimation of the impact.
Similarly to the 2019 exercise, the quantitative assessment is based on several assumptions that may lead to an over or underestimation of the results. Taken together these assumptions are expected to lead to an overestimation of impact. Information reported by banks in quantitative impact studies like the present one also tends to err on the conservative side, particularly when banks are asked to estimate the impact of completely new pieces of regulation. Finally, some impacts are based on proxies and should be interpreted with caution.
1.2
Overall impact
The overall impact is presented under two implementation scenarios: the first one updates the impact presented in the previous CfA reports; the second one considers the additional features requested by the European Commission in its CfA
The overall impact is presented under two implementation scenarios. The first scenario (called ‘Basel III’), corresponds to the Basel III central scenario in the August 2019 and December 2019 CfA reports and is in line with the EBA policy recommendations. The goal of this scenario is to update the impact of the Basel III framework as presented in the August 2019 and December 2019 CfA reports. The second scenario (called ‘EU-specific’) considers the additional features requested by the European Commission in its Call for Advice: applying the SME supporting factors on top of the Basel SME preferential risk weight treatment; maintaining EU CVA exemptions; exercising the jurisdictional discretion contemplated in the Basel III framework to exclude the bank-specific historical loss component from the calculation of the capital for operational risk (ILM=1). Some features in this scenario deviate from the EBA’s policy recommendations from the August 2019 and December 2019 CfA reports. In addition, two measures that have been frontloaded to mitigate the effect of Covid-19 pandemic have been considered (the change in the prudential treatment of software assets and the change in Pillar 2 composition rules). Both scenarios consider proxy calculations for the final CVA risk framework published in July 2020.
Table 1 Percentage change in T1 MRC (relative to current T1 MRC), by implementation scenario Scenario ∆ SA ∆ IRB ∆ CCP ∆ SEC ∆ MKT ∆ OP ∆ CVA ∆ LR ∆ OF ∆ Total
Basel III 2.4 2.6 0.0 0.4 0.8 3.8 2.1 -0.2 6.7 18.5
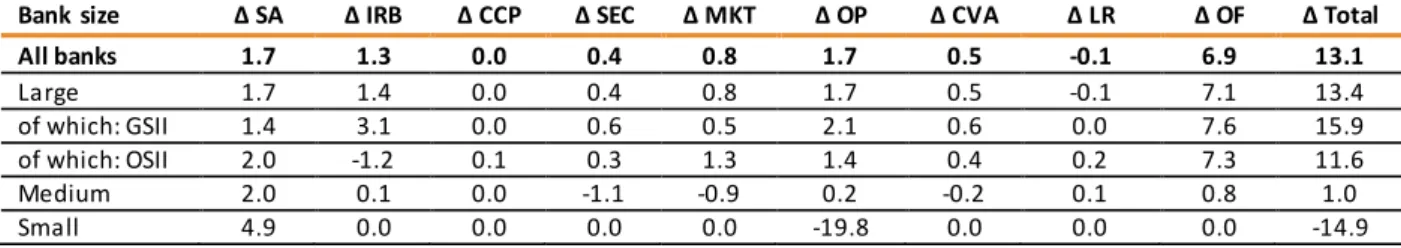
EU-specific 1.7 1.3 0.0 0.4 0.8 1.7 0.5 -0.1 6.9 13.1
Sources: EBA 2019-Q4 QIS data and EBA calculations.
Notes: Based on a sample of 99 banks: SA, standardised approach to credit risk; IRB, internal ratings-based approach to credit risk, CCP, central counterparty, SEC, securitisation; MKT, market risk; OP, operational risk; CVA, credit valuation adjustment; LR, leverage ratio; OF, output floor. ∆ MKT based on ‘reduced bias estimation’.∆ CVA based on July 2020 CVA framework. ∆ OF impact is based on the main approach to implement the output floor.
Table 2 Capital ratio and shortfalls (EUR billion), by implementation scenario
Scenario
CET1 T1 Total capital
Current ratio (%) Revised ratio (%) Shortfall (bn) Current ratio (%) Revised ratio (%) Shortfall (bn) Current ratio (%) Revised ratio (%) Shortfall (bn) Basel III 14.6 12.3 30.2 15.7 13.2 41.0 18.2 15.3 52.2 EU-specific 14.6 12.9 17.4 15.8 13.9 23.6 18.2 16.1 33.0
Sources: EBA 2019-Q4 QIS data and EBA calculations.
Notes: Based on a sample of 99 banks. ∆ MKT based on ’reduced bias estimation’.∆ CVA based on July 2020 CVA framework. ∆ OF impact is based on the main approach to implement the output floor.
Under the Basel III scenario, the minimum required Tier 1 capital increases by +18.5%.
Under the Basel III scenario, the steady-state implementation of the overall reform scheduled for January 2028 could increase the Tier 1 (T1) minimum required capital (MRC) amount, which includes Pillar 2 requirements and EU-specific buffers, by +18.5% with respect to the December 2019 baseline. The T1 MRC impact is very heterogeneous across the sample of participating institutions with a modest impact for the median institution (+11.7%) and the weighted average result being driven by some very large outlier institutions in the highest quartile of the distribution.
The impact would determine a EUR 52.2 billion total capital shortfall, of which EUR 30.2 billion of CET1.
The impact would reduce the average total capital ratio of the banks in the sample from 18.2% to 15.3% and result in a shortfall in total capital of EUR 52.2 billion (across 13 out of 99 banks), of which EUR 30.2 billion of common equity Tier 1 (CET1).
The increases in MRC and capital shortfall are noticeably lower than the estimates reported in the December 2019 CfA report, for a consistent sample.
The MRC impact is lower than the +24.1% estimated in the December 2019 CfA report, which used data from June 2018 (when considering consistent samples). The current total capital shortfall is also lower than the EUR 109.5 billion reported in December 2019. The MRC reduction is driven by a lower CVA impact (+2.1% compared to +4.3% based on June 2018 data) following the introduction of the July 2020 CVA framework and a lower impact of the output floor (+6.7% compared to +9.5% based on June 2018 data). The reduction in shortfall is driven by the combination of the banks’ improved capital position and lower MRC.
Under the EU-specific scenario, the MRC impact would reduce to +13.1%, resulting in a total capital shortfall of EUR 33.0 billion, of which EUR 17.4 billion of CET1.
Under the EU-specific scenario, steady-state implementation of the final Basel III framework (i.e. 2028) could increase the T1 MRC amount by +13.1% with respect to the December 2019 baseline, resulting from the additional elements in this scenario which lower the MRC impact for the specific risk type to which they are related. This reduction is then slightly offset by the output floor, which becomes more binding as risk-based requirements become less constraining.
The lower MRC impact would cause a milder reduction in the average total capital ratio from 18.2% to 16.1% and
determine a shortfall in total capital of EUR 33.0 billion, of which EUR 17.4 billion CET1.
The overall conclusion drawn in the previous CfA Reports remain valid.
In line with the findings in the previous CfA reports, the main drivers of the impact remain the output floor, credit risk, and operational risk. The CVA risk is a smaller contributor to the overall impact compared to previous results, but it should be kept in mind that its calculation was based on a proxy for the CVA risk under the new CVA framework introduced in July 2020.
The reform has a materially higher impact on large and systemically important institutions than on medium-sized and small ones. Although the coverage of small and medium-sized banks in the sample is limited and results should therefore be interpreted with caution, the banks in this size category will see their capital requirements increase, mostly due to the revised standardised approach to credit risk, with other reforms, including the output floor, playing a minor role and operational risk a negative role.
The impact of the reform is heterogeneous across countries and business models. Indeed, a number of banks in the sample, especially medium-sized and small banks, will see their overall capital requirements fall from their current levels, mostly due to the changes in the standardised approach and in the operational risk framework.
As in the previous reports, the shortfall in total capital is almost exclusively reported by large banks, with global systemically important institutions (G-SIIs) alone accounting for a material share of its total amount.
The impact of Basel III has been assessed under different implementation approaches for the output floor, as requested in the CfA.
The main results presented in this report are based on the implementation approach for the output floor recommended by the EBA (the main approach in the previous CfA reports). This main approach applies the full stack of EU requirements, including Pillar 2 and EU-specific systemic buffers, to floored RWA. As requested by the Commission, the report also presents results under different implementation approaches, which however have been assessed by the EBA in its Policy Advice published in August 2019 as having significant drawbacks or not being Basel-compliant.
This report also presents the updated impact of Basel III on MREL.
This report also provides an update of the EBA’s previous impact of Basel III framework on MREL, using data as of end-December 2019. As the BRRD2 will become the applicable framework before the implementation of the revised Basel III, the impact is assessed differently for G-SIIs and toptier banks, which are expected to be subject to BRRD2
subordination requirements, and the remaining banks, which are not expected to be subject to those requirements. For the former, the MREL shortfall attributable to the revised Basel III framework is estimated based on the minimum subordination levels prescribed in the BRRD2, while for the latter, this is based on the BRRD1 MREL requirements. Bearing in mind the limited size of the sample and the difficulty to estimate future BRRD2 MREL decisions, overall, under the Basel III scenario, the total estimated MREL shortfall attributable to the final Basel III framework is within the range of EUR 7 billion to EUR 8.6 billion. Under the EU-specific scenario, the MREL shortfall would account for around EUR 2 billion.
1.3
Complementary analysis
The COVID pandemic
represents an unprecedented shock to the EU economies and financial sector. To alleviate its effects, mitigating policy measures were adopted at EU and MS level.
The outbreak of the COVID-19 pandemic has caused an unprecedented economic downturn worldwide. Although the crisis has mainly affected the non-financial sectors of the economy, the impact could yet spread to the financial sector. In order to ensure that banks continue lending to the non-financial sector and to avoid one-off effects to banks’ capital ratios, extraordinary policy measures have been implemented across the EU, including loan moratoria, public sector guarantees, frontloading of selected CRR II/CRD V measures and release of buffers.
The purpose of the complementary analysis is to understand if and to what extent the adverse COVID-19 impact on banks’ balance sheets could interact with the implementation of the revised Basel III framework. The analysis takes into account the fact that the time horizon of the application of the mitigating policy measures may differ and not all of them will be in place at the time of the implementation of the final Basel III framework. It also considers that some elements of the final Basel III framework (i.e. the implementation of the output floor) will have a phase in period of five years, until 2028.
It is expected that the new Basel III standards will interact differently with the effects of the crisis, compared to current framework
There is uncertainty with regards to how banks’ balance sheets will change as a consequence of the COVID-19 crisis. The interaction of the Basel III framework and the impact of the COVID-19 crisis can only be properly assessed once the full effects of the crisis on bank balance sheets have played out. While a complete assessment of how each of the elements of the Basel III reforms interact with the effects of the crisis is not possible in the absence of data that illustrate the actual impacts once these effects are visible, some qualitative reflections on the potential interactions between
different elements of the Basel III framework and the expected shocks to banks’ balance sheets are presented in the latter part of the report.
At the same time, the effects of Basel III taken in conjugation with COVID-19, is not likely to be additive, as pass-through effects are in some cases off-setting. Furthermore, whereas it is certain that the Basel III framework will become fully applicable in January 2028, the losses related to COVID-19 are likely to be transitory, and therefore the timing of the effects may not coincide.
2.
General remarks
2.1
Background and mandate
1. On 7 December 2017, the Group of Governors and Heads of Supervision (GHOS) endorsed the final Basel III framework, completing the global reform of the regulatory framework following the onset of the financial crisis. The main elements of the Basel III standards relate to the standardised approach for credit risk, the internal ratings-based approaches for credit risk, the credit valuation adjustment (CVA) risk framework, the operational risk framework, the leverage ratio framework and the output floor. In parallel, the Basel Committee on Banking Supervision (BCBS) has endorsed the revised framework for market risk (FRTB) in January 2016 and made targeted amendments in January 2019. In July 2020, the BCBS also endorsed the final targeted revisions to the CVA framework, replacing the earlier version of the standard as published in December 2017.
2. In May 2018, the Commission requested technical advice from the EBA11 on the
implementation of the Basel III reforms in the EU. The EBA submitted its advice in two parts, on 5 August 2019 and on 4 December 2019. The first part covered the areas of credit risk, operational risk, securities financing transactions and output floor (August 2019 CfA report).12 The second part covered the areas of market risk and credit valuation adjustment
risk standards13, as well as a macroeconomic impact assessment carried out in cooperation
with the ECB (December 2019 CfA report). The advice included a detailed quantitative impact assessment and a set of policy recommendations on the various elements of the final Basel III standards.
3. On 15 July 2019, the EBA received a supplementary request from the European Commission to provide additional analysis in the areas of specialised lending, equity exposure class (including the impact on intra-group equity exposures), minimum requirements for own funds and eligible liabilities (MREL) and the application of the output floor at all levels (individual, sub-consolidated, consolidated). The additional analysis was submitted in two
11 European Commission (2018), ’Call for Advice to the EBA for the purpose of revising the own fund requirement for
credit, operational, market and credit valuation adjustment risk’ .
12 EBA (2018), 'Basel III reforms: Impact study and key recommendations'
13 EBA (2018), 'Basel III reforms: Impact study and key recommendations - Macroeconomic assessment, credit valuation
adjustment and market risk'. At the time of publication, the final targeted revisions to the CVA framework, published on July 2020, were not available. Consequently, the EBA provided only an indicative sensitivity analysis on the potential impact of these adjustments, based on the targeted adjustments proposed in the BCBS consultation document ‘Credit Valuation Adjustment risk: targeted final revisions’ published in November 2019
parts: the first part on specialised lending and MREL was published on 25 February 202014,15,
and the second part on the output floor and the equity exposure class on 5 March 2020.16
4. In light of the economic impact of COVID-19 pandemic, on 23 March 2020 the GHOS endorsed a set of measures to provide additional operational capacity for banks and supervisors. The measures comprised a change in the implementation timeline of the outstanding Basel III standards and the revised market risk framework, which was deferred by one year to 1 January 2023. The accompanying transitional arrangements for the output floor were also extended by one year, until 1 January 2028.
5. Consequently, the Commission postponed the adoption of the legislative proposal to implement these reforms in the EU (originally planned for June 2020). In addition, on 21 August 2020, the Commission asked the EBA to update its previous advice on the final Basel III reforms, considering the potential impact of the COVID-19 pandemic on the EU banking sector and the wider economy.17 As a separate exercise, the ECB is working to update
the macroeconomic impact assessment included in the December 2019 CfA report.
6. This report provides an update of the EBA’s previous impact assessment on the final Basel III framework using data as of end-December 2019. Beyond the results of the present CfA report, on 10 December 2020, the EBA also published its regular Basel III monitoring report, based on the same reference date (December 2019).18 The cumulative results of the present
CfA report are not directly comparable to those of the Basel III monitoring report, as they are based on somewhat different samples (composition and size), and there are two key methodological differences described in section 2.4.4.
2.2
Data collection process governance
7. The impact assessment in this report is primarily based on end-December 2019 QIS data that institutions provided on a voluntary basis as part of the regular EBA Basel III monitoring exercise.
8. With the purpose of reducing the burden for participating institutions, where the information necessary to address the CfA request was not available in the end-December 2019 QIS templates, the EBA relied on existing available data sources and refrained from carrying out additional data collections. Specifically, the EBA made use of the information collected in the June 2018 CfA QIS exercise, supervisory data (e.g. COREP, FINREP), data collected from
14 EBA (2020), Letter on additional analysis for the Call for Advice for the purposes of revising the own fund requirements
for credit, operational, market and credit valuation adjustment risk: specialised lending
15 EBA (2020), Letter on additional analysis for the Call for Advice for the purposes of revising the own fund requirements
for credit, operational, market and credit valuation adjustment risk: impact of Basel III on MREL
16 EBA (2020), Letter on additional analysis for the Call for Advice for the purposes of revising the own fund requirements
for credit, operational, market and credit valuation adjustment risk: output floor and equity exposure class
17 European Commission (2020), 'Call for advice to the EBA on the implementation of the final Basel III reforms in light of
the impact of the COVID-19 pandemic'
exercises already scheduled in the EBA work programme and publicly available data sources (e.g. European Systemic Risk BoardB macroprudential measures).
2.3
Sample
2.3.1
Classification criteria
9. The Basel framework is designed to apply to large and internationally active institutions. Several jurisdictions, including the EU, traditionally choose to apply the international standards to a wider set of entities.
10. In the August 2019 and December 2019 CfA reports, the sample for the cumulative analysis was significantly enlarged compared to the one used in the regular EBA Basel III monitoring exercise, thanks to a number of additional banks participating on a voluntary basis, improving the coverage in terms of smaller and less complex institutions, as well as different business models.
11. However, given that for this report, the EBA relied on the existing sample of institutions participating in the regular EBA Basel III monitoring exercise, the coverage in terms of different sizes and business models is rather limited, especially for smaller and more specialised institutions (see section 2.3.3 for details on the current sample). To create a comparable sample with respect to the August 2019 and December 2019 CfA report, banks not covered in these reports, but which are part of the regular EBA Basel III monitoring exercise, are excluded.
12. The classification of institutions by size and by business model are explained in section 2.3.1 and 2.3.2 of the August 2019 CfA report.
2.3.2
Consolidation
13. Institutions participating in the QIS data collection exercise were asked to report data at the highest level of EU consolidation to ensure that no double-counting of impact occurs.
14. Unless stated otherwise, subsidiaries of EU parents are included in the average calculations only when impact results are presented by business model or by country, provided that they do not belong to the same business model or country as their parent entity.
2.3.3
Cumulative sample: summary statistics
15. The cumulative analysis published in the August 2019 and December 2019 CfA reports was based on a sample of 189 institutions, reporting data of sufficient quality at the highest level of consolidation.19 Additionally, the cumulative analysis results presented by business model
19 See section 2.3.5 in the August 2019 CfA Report for further details on the sample breakdown by size, business model
or by country included 15 subsidiaries of EU parents, of which 12 were designated as O-SIIs in the jurisdictions where they are located.
16. The current sample is reduced to a subset of 99 institutions submitting data at the highest level of consolidation in the EU (Table 3). Additionally, four subsidiaries of EU parents (from two Member States) are included in the cumulative analysis results by country (Table 4) and business model (Table 5). 20
17. In comparison with the sample included in the August 2019 and December 2019 CfA report, some countries (Estonia, Croatia, Latvia, Malta) and business models (leasing and factoring banks) are no longer represented in the current sample, while others have a much more limited representation. In addition, the coverage in terms of small and medium-sized banks is considerably reduced (4 small banks and 22 medium-sized banks).
Table 3 Cumulative analysis sample, by bank size (highest level of EU consolidation)
Bank size Number of banks
Large 73 of which: G-SII 8 of which: O-SII 46 Medium 22 Small 4 Total 99
Sources: EBA 2019-Q4 QIS data and EBA calculations.
Table 4 Cumulative analysis sample, by country
Bank size Number of banks
(highest level of EU consolidation)
Number of banks (subsidiaries of EU parents) AT 5 BE 4 DE 24 2 DK 4 ES 6 FI 1 FR 7 GR 3 HU 1 IE 8 2 IT 11 LU 2 NL 7 NO 2 PL 4 PT 4
20 A total of 114 institutions have submitted data for the December 2019 EBA Basel III monitoring exercise, of which 12
Bank size Number of banks (highest level of EU consolidation)
Number of banks (subsidiaries of EU parents)
SE 6
Total 99 4
Sources: EBA 2019-Q4 QIS data and EBA calculations.
Table 5 Cumulative analysis sample, by business model
Bank size Number of banks
(highest level of EU consolidation)
Number of banks (subsidiaries of EU parents)
Cross-border U 34
Local U 31 2
Auto & Cons 2 1
Building Soc 2 S&L Coop 11 Private 2 Custody 3 CCP 1 Merchant 2 Public Dev 4 Mortgage 5 Other special 2 1 Total 99 4
Sources: EBA 2019-Q4 QIS data and EBA calculations.
18. The sample covers 76% of the total assets of EU domestic banking groups and stand-alone banks (compared to 86% in the August 2019 and December 2019 CfA reports). The level of coverage varies across jurisdictions (Table 23 in Annex 1). It is lowest for Austria (13%) and varies from 42% to 143% for the remaining jurisdictions. The coverage reaches above 100% in those jurisdictions where some QIS participants are EU-located subsidiaries of non-EU-controlled (e.g. US) groups and are therefore not included in the denominator of the coverage ratio.
19. It should be noted that while at the EU level the reduction in coverage relative to the August 2019 and December 2019 CfA reports is not considered material, this is not the case for some countries. In particular, the coverage in Austria (from 74% to 13%), Luxembourg (from 103% to 65%) and Poland (from 88% to 42%) has dropped significantly. Therefore, for these countries the results in the current report are much less representative and are either not displayed in the country breakdowns or, if shown, should be interpreted with caution.
2.4
Methodology
20. The methodology of this report follows to a large extent the methodology used in the August 2019 and December 2019 CfA reports. This section focuses on selected aspects of the methodology, including proxies, data quality checks and adjustments, which are different from the previous CfA reports. In order to get a complete picture and full description of the methodology, please refer to the previous CfA reports.21
2.4.1
Aggregation
21. Unless otherwise stated in the report:
all averages are weighted (e.g. average RWA in the EU is weighted by country RWA); averages by country or business model include institutions that are subsidiaries of EU
parents, unless they belong to the same country or business model as their parent company.
2.4.2
Impact assessment scenarios
22. In accordance with the CfA request, the cumulative analysis presented in this report is based on two different implementation scenarios for the final Basel III reforms in the EU.
The first scenario (called ‘Basel III’) corresponds to the Basel III central scenario in the August 2019 and December 2019 CfA reports and is in line with the EBA policy recommendations. It represents the situation as it would have been in 2019 if the Basel III framework had already been fully implemented and the transitional period had passed. The goal of this scenario is to update the impact of Basel III framework as presented in the August 2019 and December 2019 CfA reports.
The second scenario (called ’EU-specific’) considers additional features requested by the European Commission in its Call for Advice22: applying the SME supporting factors
on top of the Basel SME preferential risk weight treatment; maintaining EU CVA exemptions; exercising the jurisdictional discretion contemplated in the Basel III framework to exclude the bank-specific historical loss component from the calculation of the capital for operational risk (ILM=1). Some features in this scenario deviate from the EBA’s policy recommendations from the August 2019 and December 2019 CfA reports. In addition, two measures that have been frontloaded to mitigate the effect of COVID-19 have been considered (the change in the prudential treatment of software assets and the change in Pillar 2 composition rules). These two measures were
21 EBA (2019), 'Basel III reforms: Impact study and key recommendations' and EBA (2019), 'Basel III reforms: Impact study
and key recommendations - Macroeconomic assessment, credit valuation adjustment and market risk'. 22 The additional features were considered on a best effort basis based on data availability.
considered in both the starting point and end point of the scenario, as these items have already been approved and are now permanent features of the EU framework.
23. Table 6 presents the main implementation features of the Basel III and EU-specific scenario.
Table 6 Main implementation features of Basel III and EU-specific scenario
Risk Area Basel III EU-specific
Credit Risk
SA-CR: ECRA framework adopted
SA-CR: loan-splitting method adopted on GRRE, GCRE, IPCRE + hard test
No SME supporting factor
SA-CR: ECRA framework adopted
SA-CR: loan-splitting method adopted on GRRE, GCRE, IPCRE + hard test
SME supporting factor
CVA
Final CVA framework (July 2020)
No CVA exemptions
CVA simplified method (based on EUR 100 billion threshold)
Final CVA framework (July 2020)
CVA exemptions
CVA simplified method (based on OEM eligibility criteria)
Operational Risk
ILM: bank-specific
Minimum loss threshold: EUR 20 000
ILM = 1 for bucket 2 and 3 banks
(ILM = 1 as a phase-out arrangement will also be measured)
Prudential treatment
of software assets Deduction from CET1 items Subject to 100% risk weight* Capital requirements Change in P2R composition*
Note: Similarly to the August 2019 and December 2019 CfA reports, the Basel III scenario considers the SME preferential risk weight treatment introduced with the Basel III reform, while the EU specific scenario applies the SME supporting factor on top of the SME preferential risk weight treatment introduced with the Basel III reform.
(*)These features were considered at both the starting point and end point of the scenario, as these items have already been approved and are now permanent features of the EU framework.
24. The features included in the EU-specific scenario are the following:
CRR2 SME supporting factor: maintaining the supporting factor for exposures to SMEs envisaged in CRR2 proposal under SA and IRB (including for the purpose of the output floor calculation);
CVA exemptions: maintaining the current CVA exemptions in the own fund requirements for CVA risks;
CVA simplified method: reusing the eligibility criteria of the original exposure method (OEM) (see Article 273a(2) of the CRR2) 23 for the eligibility criteria of the simplified
method for the own funds requirements for CVA risks;
ILM = 1: assuming that the EU will exercise the discretion included in the final Basel III framework to set the historical loss component equal to 1 on the own funds requirements for operational risk, either permanently for buckets 2 and 3 banks only;
23 Article 273a(2) of the CRR2 specifies that a n institution may use the OEM, provided that the size of its on- and
off-balance-sheet derivative business is equal to or less than both of the following thresholds on the basis of an assessment carried out on a monthly basis using the data as of the last day of the month: (a) 5 % of the institution's total assets; b) EUR 100 million.
or as a phase-out arrangement, aligned with the phase-in period for the output floor, in which the discretion would be applied at the beginning of the phase-in period for buckets 2 and 3 banks only but would be then linearly phased-out until the end of the phase-in period.
Prudential treatment of software assets: under the RTS on prudential treatment of software assets, ‘prudently valued software assets’, which are not materially affected in a gone concern situation can be exempted from the deduction of intangible assets from CET1 items.24 For these assets, the positive difference between the prudential and
the accounting accumulated amortisation shall be fully deducted from CET1 capital, while the residual portion of the carrying amount of software is to be risk-weighted. The original application date of the revised treatment of software assets has been set to 12 months after the entry into force of the RTS. However, the CRR quick fix has brought forward the date of application of the exemption and allow banks to use it as soon as the RTS enters into force. For the purpose of this report, the residual portion of the carrying amount of software is assumed to be risk weighted under the standardised approach, with a risk-weight of 100%.
Pillar 2 requirements (P2R) composition: under the Capital Requirements Directive (CRD V), the approach for P2R composition has changed allowing P2R to be covered by at least 56.25% CET1, 18.75% Additional Tier 1 instruments (AT1) and 25% Tier 2 instruments. This change in capital composition under P2R was initially scheduled to come into effect in January 2021, in line with the revised approach, but is being frontloaded for the banks under the ECB supervision (significant institutions) and in two other countries represented in the sample which frontloaded this measure for their less significant institutions.
25. The final CVA framework published in July 2020 is reflected under both scenarios via a proxy (see section 2.4.4 for more details).25 Annex 4 provides additional qualitative considerations
of the implementation of the new CVA framework in the EU.
26. Moreover, as requested in the CfA, the report presents the individual impact of three implementation options for the output floor in both scenarios as identified in the EBA’s policy report on the output floor (Box 1): 26
The main approach, whereby the floored RWA is applied to the full stack of capital requirements applicable in the EU, i.e. Pillar 1 minimum capital requirements, Pillar 2 requirements and the combined buffer requirement for the floored RWA.
24Draft Regulatory Technical Standards on the prudential treatment of software assets under Article 36 of Regulation
(EU) No 575/2013 (Capital Requirements Regulation – CRR)
25 Under both scenarios, the final CVA framework is only reflected in the cumulat ive analysis based on data as of
December 2019 presented in chapter 3. It is not reflected in the cumulative analysis based on data as of June 2018 and the consistent sample presented in the annex. For more details on the latter, see Annex 2.
The alternative approach, whereby the floored RWA is applied only to the capital requirements explicitly mentioned by the Basel III standards on the output floor, i.e. the Pillar 1 minimum capital requirements, the CET1 capital conservation buffer and the CET1 G-SII/ O-SII buffer (where applicable). The pre-floor RWA would be applied to Pillar 2 requirements as well as the systemic risk buffer.
The parallel stacks approach, whereby the output floor requirement, calculated by applying the requirements explicitly mentioned by the Basel III standards to the floored RWA, serves as a backstop amount to the full stack of EU capital requirements, i.e. to the Pillar 1, Pillar 2 and combined buffer requirements applied to the pre-floored RWA. The impact of this approach was not assessed in the August 2019 and December 2019 CfA reports, as the EBA considers this proposal non-compliant with the Basel III standards and has several drawbacks, as discussed later in this report.
27. Unless otherwise stated in the report, the output floor impact results are based on the main approach that is the option recommended by the EBA.
Box 1 Three approaches to implement the output floor (MRC calculation) Main approach: MRC =
Floored RWA × (Pillar 1 minima + Pillar 2 requirements + combined buffer)
Alternative approach: MRC = sum of:
Floored RWA × [Pillar 1 minima + CCB buffer + CCyCB buffer + max (G-SII,O-SII buffer)];
Pre-floor RWA × (Pillar 2 requirements + contribution27 of the SRB buffer to the combined buffer)
Parallel stacks approach: MRC = higher of:
Floored RWA × (Pillar 1 minima + CCB buffer + CCyCB buffer + G-SII buffer); Pre-floor RWA × (Pillar 1 minima + Pillar 2 requirements + combined buffer)
Note: CCB, capital conservation buffer; CCyCB, countercyclical capital buffer.
28. When comparing the impact across the two scenarios, it should be kept in mind that whenever capital requirements decrease for a non-modellable risk category, i.e. a risk category for which only standardised approaches are available under the Basel III reforms, e.g. CVA or operational risk, it is likely to lead to a higher impact of the output floor. This is because, other things being equal, a higher volume of non-modellable RWA offsets a given gap between internal model RWA and standardised equivalent RWA for market risk and credit risk (i.e. a higher non-modellable requirement may lead to a lower impact of the output floor).
2.4.3
Impact metrics
27 Contribution of the systemic risk buffer (SRB) to the combined buffer requirement means i) excess of SRB over max
(G-SII buffer, O-(G-SII buffer) if the institution applies Article 131(14) of the CRD and ii) the whole SRB amount if the institution applies Article 131(15) of the CRD.
29. The methodologies for computing results shown in terms of MRC and regulatory capital ratios and shortfalls remain the same as for the August 2019 CfA report (for details see section 2.4.2 of that report).
2.4.4
Main differences with respect to other exercises
a.
Differences from previous CfA reports
30. The methodology used in this report is based on the 2018-Q2 CfA methodology. However, some differences from previous CfA exist mainly due to data availability or changes in the QIS templates. The Basel monitoring 2019-Q4 data is less comprehensive than the June-2018 data collection, and as a result, many pieces of data required to assess the impact in the same way as in the August 2019 and December 2019 CfA reports are missing. In such cases, proxies were developed based on other available resources such as COREP 2019-Q4 and June 2018 CfA data collection.
31. The main differences between the two exercises are described below:
P2R data was not available in the 2019-Q4 Basel monitoring data, so a proxy based on 2019-Q4 COREP data was used, where available (74 banks). For 25 banks for which the EBA does not have COREP data, 2018 Basel III CfA data on P2R was used.
SME and infrastructure supporting factors were not available in the 2019-Q4 templates. In the August 2019 CfA Report, this information was specifically added in the templates to assess the impact of this measure. In order to create a proxy for the impact of the SME supporting factor, for each bank and for each exposure class, the % change in RWA was calculated between the ’pure’ Basel III framework and the Basel III framework with the supporting factor using the June 2018 CfA data. The % change was then applied to the RWA by exposure class and by bank in the QIS 2019-Q4.28 For the infrastructure
supporting factor in the August 2019 CfA report data was provided by only two banks and was therefore insufficient to conduct analysis in that report. Therefore, it was not possible to create a proxy for this supporting factor this time either.
EU CVA exemptions were not available in 2019-Q4 templates. In August 2019 CfA report, this information was collected via an EU-specific worksheet (EU CVA) to assess the impact of this EU specificity.29 In order to create a proxy for EU CVA exemptions, for
each bank, the % change in RWA was calculated between the ’pure’ Basel III framework and Basel III framework with EU CVA exemptions using the June 2018 CfA data. The %
28Exclusion criteria were applied by exposure class. If an exposure class was excluded, its value was replaced by average
impact calculated using non-excluded banks from the new sample.
29 The CVA impact calculated in the June 2018 and December 2018 CfA reports was based solely on data collected via the
EU CVA worksheet. Given that this worksheet was not available in the 2019 -Q4 template, slightly different data quality checks had to be applied.
change was then applied to the RWA by exposure class and by bank in the QIS 2019-Q4.30
The July 2020 final CVA risk framework was not included in 2019-Q4 templates, as the framework was published after the launch of the QIS data collection. In order to create a proxy for the July 2020 CVA risk framework, for each bank, the CVA RWA in QIS 2019-Q4 was adjusted to reflect the following revisions: a) reductions in risk weights under the SA-CVA approach for interest rate risk and FX risk; b) overall recalibration of the SA-CVA and BA-CVA approaches. These revisions are expected to be the most impactful on the 2017 CVA risk framework. The remaining revisions were not captured, as the existing data granularity did not make it possible to create a meaningful proxy. The impact for market risk in this report is based on a ’reduced bias estimation’ in line
with the baseline scenario analysis in the regular EBA Basel III monitoring exercise.31
The prudential treatment of software assets was not considered in the 2018-Q2 CfA report. The methodology used to estimate the impact of this treatment follows the methodology used in the impact assessment done in the EBA RTS on prudential treatment of software assets.32 No data on the amount of new investments in software
has been collected for the reference date and sample of banks in this report. Therefore, the amount of new investments in software is proxied as the adjusted annual increase in the deduction of intangible assets excluding goodwill using four years of COREP data (2016-2019).
30 Exclusion criteria were applied by bank. If a bank was excluded, its value was replaced by the weighted average
impact calculated using non-excluded banks from the new sample.
31In the regular EBA Basel III monitoring exercise, the key figures are expressed for two separate samples, owing to the
submission of overly conservative data for market risk by three G-SIIs. To reduce the reported bias, the baseline scenario analysis sets the market risk impact for the three G-SIIs in question equal to zero. The conservative estimation results are based on the originally reported, but overly conservative, market risk data. In the current sample, The three G-SIIs applied a sequence of conservative assumptions, namely, the treatment of all trading book positions in equity investment in funds, that may no longer be allowed to be modelled, using the most conservative standardised approach, i.e. the ’other bucket’ treatment subject to the highest applicable risk weights. This implies that they are unable to use other treatments, such as the index treatment or the mandate-based approach as set out in MAR21.36 (Standardised approach: sensitivities-based method – ways for calculating capital requirements for equity investments in funds that cannot be looked through), which these G-SIIs are expected to be able to apply before the implementation of the framework
32 Three-year prudential amortisation is applied to yearly investments in software. The remaining amount (after
b.
Differences with Basel monitoring
32. While the main source of data for this CfA is the regular 2019-Q4 Basel monitoring exercise, there are differences in methodology between the two exercises:
The most important methodological difference relates to the application of different buffers, which affects the estimation of capital shortfalls.33
Another, less significant, difference is the sequence of estimating the capital requirements for the output floor and leverage ratio. The latter difference has an impact on the minimum required capital assigned to these two categories, but not on the cumulative impact34.
33. In addition to these two key differences, there are some additional differences related to the application of the criteria for exclusion and scaling factors due to updates in the last CfA report and the calculation of the IRB shortfall of provisions due to updates in the last CfA report.
2.5
Data quality issues and interpretation of the results
34. The results should be interpreted with caution, considering data quality and several simplifying assumptions.
2.5.1
Sample
35. The CfA data collection ensured the participation of a large number of small and medium banks, to have a representative sample. The sample in the current CfA update consists of the banks that were included in both the August 2019 CfA report and 2019-Q4 Basel monitoring exercise. The resulting sample include 99 banks, of which only 4 are small banks. Unlike August 2019 and December 2019 CfA reports, which had 24 small banks out of 189, the sample in the updated CfA is not representative of small banks, and hence the results for small banks should be interpreted with caution.
33 The Basel III monitoring report applies Pillar 1 minimum capital requirement, the capital conservation buffer (CCB) and
the global systemically important institutions (G-SIIs) surcharge, where applicable. In addition to these requirements, the present CfA report additionally applies Pillar 2 minimum capital requirements and EU capital buffers. This difference has a meaningful effect on the level of capital shortfalls, i.e. the shortfalls presented in the Basel III monitoring report are generally lower than the shortfalls reported in the present CfA report.
34 The Basel III monitoring report estimates the output floor impact as part of the risk-based capital requirements. The
additional leverage-ratio-based requirement is subsequently calculated as the incremental increase compared to the risk-based capital requirement (incl. output floor). The present CfA report estimates first the risk-risk-based capital requirements excluding the output floor impact. The additional leverage-ratio-based requirement is subsequently calculated as the incremental increase compared to the risk-based capital requirement (excl. output floor). Finally, the impact of the output floor is estimated as the additional incremental increase compared to the maximum of the risk-based capital requirement (excl. output floor) and the leverage-ratio-based requirements.
2.5.2
Proxies
36. As in the August 2019 and December 2019 CfA reports, it is expected that the SME supporting factor impact is underestimating the real impact. The reason is that the implementation of the SME supporting factor as specified in the November 2016 proposal for amending the CRR was used for the data collection, which means that a threshold loan size of EUR 1.5 million was used instead of EUR 2.5 million, to identify the part of the loan which qualifies for the preferential 76.19% RW. The quality and reliability of data on the SME supporting factor from the August 2019 CfA were in some cases assessed as not sufficient. Data quality checks were implemented, leading to an exclusion of some exposure classes at bank level and their replacement with EU averages.
37. It should also be noted that, as in the August 2019 and December 2019 CfA reports, the SME supporting factor applies on top of the SME preferential risk weight treatment introduced with the Basel III reform.
38. The real CVA impact is expected to be lower than the one presented in this report (based on a proxy). The reason is that the proxy used for the July 2020 CVA framework reflects only selected revisions that could be quantified given the existing data granularity. The remaining revisions are expected to further reduce the CVA impact.
39. The proxy for the software impact is expected to underestimate the real impact. The proxy used to estimate the amount of new investments in software is based on the yearly increase in the deduction of intangible assets excluding goodwill, adjusted by a haircut based on the net value of software. The impact is lower than the one calculated in the impact assessment done in the EBA RTS on prudential treatment of software assets.
2.5.3
Conservatism in our estimates
40. As in August 2019 and December 2019 CfA reports, a number of simplifying and conservative assumptions were applied that may result in an overestimation of the capital impact, as follows:
Static balance sheet assumption: institutions do not react to the revised requirements by adjusting their businesses and/or managing their regulatory capital costs.
Static requirements assumption: Pillar 2 and combined buffer requirements as of December 2019, defined as a percentage of the bank’s RWA, were used both for the CRR baseline and the two reforms implementation scenarios (i.e. Basel III and EU-specific scenario).35Higher RWA resulting from the implementation of the revised
framework may lead – in some cases – to a revision and, possibly, re-calibration of the Pillar 2 and buffer requirements.
35 In EU-specific scenario, all the requirements were kept constant as well, except for the P2R requirements, which
Profit retention to cover capital shortfall: the cumulative impact analysis assumes no role for profit retention in rebuilding the capital base.
2.6
Structure of the report
41. This report is structured as follows:
Chapter 3 provides an overview of the impact of the reform based on the two implementation scenarios;
Chapter 4 presents a complementary analysis of the potential effects of the COVID-19 pandemic on the Basel III reforms;
the annexes include i) a qualitative assessment of the implementation of the final adjustments to the CVA risk framework in the EU; ii) additional information on sample coverage; iii) additional impact assessment results; iv) additional information on the methodology used for the complementary analysis.